| Issue |
A&A
Volume 584, December 2015
|
|
|---|---|---|
| Article Number | A14 | |
| Number of page(s) | 11 | |
| Section | Interstellar and circumstellar matter | |
| DOI | https://doi.org/10.1051/0004-6361/201526003 | |
| Published online | 13 November 2015 | |
UV photoprocessing of CO2 ice: a complete quantification of photochemistry and photon-induced desorption processes⋆
1 Centro de Astrobiología (INTA-CSIC), Ctra. de Ajalvir, km 4, Torrejón de Ardoz, 28850 Madrid, Spain
e-mail: This email address is being protected from spambots. You need JavaScript enabled to view it.
2 Sackler Laboratory for Astrophysics, Leiden Observatory, University of Leiden, PO Box 9513, NL 2300 RA Leiden, The Netherlands
3 Space Sciences Center and Department of Physics and Astronomy, University of Southern California, Los Angeles, CA90089-1341, USA
4 Department of Physics, National Central University, Jhongli City, 32054 Taoyuan County, Taiwan
5 Instituto de Estructura de la Materia-Consejo Superior de Investigaciones Científicas (IEM-CSIC), 28006 Madrid, Spain
Received: 2 March 2015
Accepted: 7 September 2015
Abstract
Context. Ice mantles that formed on top of dust grains are photoprocessed by the secondary ultraviolet (UV) field in cold and dense molecular clouds. UV photons induce photochemistry and desorption of ice molecules. Experimental simulations dedicated to ice analogs under astrophysically relevant conditions are needed to understand these processes.
Aims. We present UV-irradiation experiments of a pure CO2 ice analog. Calibration of the quadrupole mass spectrometer allowed us to quantify the photodesorption of molecules to the gas phase. This information was added to the data provided by the Fourier transform infrared spectrometer on the solid phase to obtain a complete quantitative study of the UV photoprocessing of an ice analog.
Methods. Experimental simulations were performed in an ultra-high vacuum chamber. Ice samples were deposited onto an infrared transparent window at 8K and were subsequently irradiated with a microwave-discharged hydrogen flow lamp. After irradiation, ice samples were warmed up until complete sublimation was attained.
Results. Photolysis of CO2 molecules initiates a network of photon-induced chemical reactions leading to the formation of CO, CO3, O2, and O3. During irradiation, photon-induced desorption of CO and, to a lesser extent, O2 and CO2 took place through a process called indirect desorption induced by electronic transitions, with maximum photodesorption yields (Ypd) of ~1.2 × 10⁻² molecules incident photon-1, ~9.3 × 10⁻⁴ molecules incident photon-1, and ~1.1 × 10⁻⁴ molecules incident photon-1, respectively.
Conclusions. Calibration of mass spectrometers allows a direct quantification of photodesorption yields instead of the indirect values that were obtained from infrared spectra in most previous works. Supplementary information provided by infrared spectroscopy leads to a complete quantification, and therefore a better understanding, of the processes taking place in UV-irradiated ice mantles.
Key words: ISM: molecules / ISM: clouds / methods: laboratory: solid state / techniques: spectroscopic
Appendix A is available in electronic form at http://www.aanda.org
© ESO, 2015
1. Introduction
In the cold and dense regions of the interstellar medium (ISM), icy grain mantles are formed by accretion of gas-phase molecules or formation of molecules on the surface of dust grains. Water is the primary component of these ice mantles. The following most abundant species are CO and CO2, with an abundance of up to ~50% relative to water (Mumma & Charnley 2011, and references therein). Molecules in the ice mantles can be energetically processed. In the coldest regions, thermal processing is inhibited, and interaction with photons and cosmic rays plays the most important role. Photoprocessing of ices in molecular clouds is possible thanks to the secondary ultraviolet (UV) field that is generated by the interaction of cosmic rays with H2 molecules that are present in the gas phase (Cecchi-Pestellini & Aiello 1992; Shen et al. 2004). Ice mantles in circumstellar environments can be also irradiated by the central stellar object. UV photons can induce photochemistry and desorption of ice molecules. Photochemistry is initiated by photolysis of absorbing molecules and subsequent recombination of radicals. UV-induced chemistry in ice mantles has been proposed as a possible formation pathway for species of diverse complexity (e.g., Agarwal et al. 1985; Allamandola et al. 1988; Briggs et al. 1992; Bernstein et al. 1995, 2002; Gerakines et al. 2001, 2004; Moore et al. 2001; Muñoz Caro et al. 2002; Muñoz Caro & Schutte 2003; Muñoz Caro et al. 2004; Muñoz Caro & Dartois 2009; Loeffler et al. 2005; Meierhenrich et al. 2005; Nuevo et al. 2006; Öberg et al. 2009a, 2010; Herbst & van Dishoeck 2009; Arasa et al. 2013). UV-photon-induced desorption is one of the proposed nonthermal desorption mechanisms, along with grain heating by cosmic rays and exothermic surface reactions (chemical desorption), to explain the presence of molecules in the gas phase at temperatures well below their desorption temperature (e.g., Willacy & Langer 2000; Bergin et al. 2001).
A series of experimental studies have been carried out in the past decades to better understand the photoprocessing of cosmic ice mantles. These studies help understanding astronomical observations of both the solid and gaseous phases of the ISM, and their results are also incorporated into theoretical models of dense clouds and star-forming regions. Despite being the simplest case, experimental simulations on UV photoprocessing of pure ice analogs provide the most fundamental information about the processes triggered by UV photons on ice mantles. They are a necessary step before attempting the simulation of processes in ice mixtures made of various molecular components. Gerakines et al. (1996) presented a study of UV irradiation of nine pure ice analogs of astrophysical interest. Photoprocessing of pure CO ice has been widely studied, since it is one of the most abundant species found in ice mantles. The interface between the UV source and the chamber where the ice sample is located is, usually, a MgF2 window with a cutoff at ~114 nm (10.87 eV), that is, below the dissociation energy of CO molecules (11.09 eV, Cruz-Díaz et al. 2014a; Chen et al. 2014). Therefore, in these experiments UV irradiation mainly leads to photodesorption (see, e.g., Öberg et al. 2007; Muñoz Caro et al. 2010; Fayolle et al. 2011; Bertin et al. 2012; Chen et al. 2014). In the past years, photoprocessing of other pure ices made of CO2, H2O, CH3OH, O2, or N2 has been studied (see, e.g., Westley et al. 1995; Öberg et al. 2009a,b; Bahr & Baragiola 2012; Fayolle et al. 2013; Yuan & Yates 2013, 2014; Fillion et al. 2014; Zhen & Linnartz 2014; Cruz-Díaz et al. 2015).
Ultraviolet photons can induce desorption of ice molecules through two different main mechanisms. Recent works suggest that the so-called photodesorption mainly takes place through a process called indirect desorption induced by electronic transitions (DIET), where UV photons are first absorbed in the subsurface region of the ice, leading to electronic excitation of molecules. Then, the electronic excitation energy is redistributed to the neighboring molecules, providing sufficient energy to the surface molecules to break intermolecular bonds and be ejected into the gas phase (Rakhovskaia et al. 1995; Öberg et al. 2007; Muñoz Caro et al. 2010; Fayolle et al. 2011, 2013; Bertin et al. 2012, 2013; Fillion et al. 2014). Based on molecular dynamics simulations, van Hemert et al. (in prep.) proposed a direct photodesorption mechanism in which the excited molecule itself desorbs from the ice surface. This mechanism has not yet been confirmed experimentally and may be negligible compared to the indirect photodesorption described above, since the amount of UV photons absorbed in the ice surface is lower than the one absorbed in several subsurface monolayers. However, photodesorption is efficient when the dissociation energy of the absorbing molecules is higher than the photons energy and when these molecules present a high UV-absorption cross section. The other main mechanism for UV-photon-induced desorption is the desorption of photoproducts with enough excess energy immediately after their formation in the surface of the ice. This mechanism is introduced in this paper as photochemical desorption or photochemidesorption, and it includes desorption of photofragments formed with enough kinetic energy and photoproducts resulting from exothermic chemical recombination of radicals (in the surface of the ice in both cases), previously reported in Fayolle et al. (2013) and Fillion et al. (2014). Photochemidesorption is intrinsically different from photodesorption. Certain species do not photodesorb during pure ice irradiation experiments, but photochemidesorption of these species is observed after their formation during irradiation of ices containing parent molecules. Evidence for photochemidesorption is presented in Cruz-Díaz et al. (2015).
Andersson & van Dishoeck (2008) proposed a third photon-induced desorption mechanism that is also based on molecular dynamics simulations. It is an indirect “kick out” photon-induced desorption mechanism that takes place when an H atom, released from photodissociation of a hydrogen-bearing molecule in the ice, transfers enough momentum to a molecule in the surface of the ice to induce its desorption. However, this mechanism has not yet been confirmed experimentally.
Previous works failed in providing a complete quantitative study of the relative contribution of photodestruction, photoproduction, and photon-induced desorption taking place in irradiated ice analogs, since a quantification of the desorbing molecules in the gas phase is necessary. These molecules are often measured by a quadrupole mass spectrometer (QMS) in addition to the quantification of the solid phase molecules, which usually is performed by infrared spectroscopy. This is not strictly required for the irradiation experiments of pure CO ice, since photodesorption is the main effect (only ~5% of the absorbed UV photons lead to photoproducts, Muñoz Caro et al. 2010), and can be thus quantified using infrared spectroscopy alone.
In this work, we have used the outcome of our Fourier transform infrared (FTIR) spectrometer and the QMS in previous CO irradiation experiments as a reference for the calibration of the measured QMS ion current of other species. A similar approach has recently been used by Fayolle et al. (2013), Fillion et al. (2014), Zhen & Linnartz (2014) to quantify photon-induced desorption from UV-irradiated pure O2, N2, and CO2 ices, linking the QMS signal of desorbed molecules to the data recorded by reflection absorption infrared spectroscopy and quadrupole mass spectrometry of previous pure CO ice irradiation experiments. Using our calibrated QMS and a transmittance-FTIR spectrometer, we have performed a complete quantitative study of the UV-irradiation experiment of a pure CO2 ice analog. We describe this in Sect. 2. The QMS calibration method for ice irradiation experiments is explained in Appendix A. The experimental results are presented in Sect. 3, while the astrophysical implications are discussed in Sect. 4. The conclusions are summarized in Sect. 5.
2. Experimental setup
The UV-irradiation experiments presented in this work have been performed using the InterStellar Astrochemistry Chamber (ISAC) at the Centro de Astrobiología (Muñoz Caro et al. 2010). The ISAC setup is an ultra-high vacuum (UHV) chamber with a base pressure about 4 × 10-11 mbar, similar to that found in dense cloud interiors. Ice samples were grown by deposition of CO2 (gas, Praxair 99.996%), introduced in the chamber at a pressure of 1 × 10⁻⁶ mbar during 30 s onto a KBr window at 8 K, achieved by means of a closed-cycle helium cryostat. This led to an ice thickness of ~200 × 1015 CO2 molecules cm-2. Additional experiments with 13CO2 (gas, Cambridge Isotope Laboratories 99.0%) introduced into the chamber at a pressure of 8.6 × 10⁻⁶ mbar during 1−2 min (leading to an ice thickness of ~180−320 × 1015 CO2 molecules cm-2) were performed to rule out contamination effects.
Deposited ice analogs were subsequently UV irradiated using an F-type microwave-discharged hydrogen flow lamp (MDHL), from Opthos Instruments, with a MgF2 window used as interface between the lamp and the chamber. This source has a vacuum ultraviolet (VUV) flux of ≈2 × 10¹⁴ photons cm-2 s-1 at the sample position (measured by CO2→ CO actinometry, Muñoz Caro et al. 2010). The spot size of the region irradiated by the lamp coincides with the size of the window substrate. Characterization of the MDHL spectrum has been studied by Chen et al. (2010, 2014), and it is similar to the calculated secondary UV field by Gredel et al. (1989). More information can be found in Cruz-Díaz et al. (2014a), where a description of the VUV spectrophotometer used in our setup to monitor the VUV flux of the hydrogen lamp during ice irradiation is provided.
After irradiation, ice samples were warmed up to room temperature with a heating rate of 1 K min-1 using a LakeShore Model 331 temperature controller until complete sublimation was attained, simulating thermal processing of the ice in warm circumstellar regions. A silicon diode temperature sensor was used to measure the sample temperature at any time, reaching a sensitivity of about 0.1 K.
The evolution of the ice after successive irradiations and during the warm-up was monitored by in situ FTIR transmittance spectroscopy, using a Bruker Vertex 70 spectrometer equipped with a deuterated triglycine sulfate detector (DTGS). The IR spectra were collected after ice deposition at 8 K, after every period of UV irradiation, or every five minutes during warm-up, with a spectral resolution of 2 cm-1. Column densities of each species in the ice were calculated from the IR spectra using the formula  (1)where N is the column density of the species in molecules cm-2, τν the optical depth of the absorption band, and A the band strength in cm molecule-1, as derived from laboratory experiments (Table 1). The band strength of the 2044 cm-1 IR feature corresponding to CO3 was calculated in this work, assuming that all remaining C atoms not locked in CO2 or CO molecules after the first five minutes of irradiation were forming CO3, since no other carbon-bearing photoproducts were detected during the experiments. The other band strengths in Table 1 were measured for pure ices made of one molecular component. The same values are usually adopted in ice mixtures, which introduce an uncertainty of about 20−30% (d’Hendecourt & Allamandola 1986).
IR feature used to calculate the column density of each component (frequencies and band strengths for pure ices at 8 K).
Molecules desorbing to the gas phase during irradiation or during the warm-up were detected using a Pfeiffer Prisma quadrupole mass spectrometer (QMS) of mass spectral range from 1 to 200 amu equiped with a Channeltron detector. The QMS ionizes gas-phase molecules with ~70 eV electron bombardment. All the species were monitored through its main mass fragment: m/z = 44 (CO2), m/z = 45 (13CO2), m/z = 28 (CO, with a small contribution of CO2 fragmentation into CO+ of, approximately, 10% of the m/z = 44 signal), m/z = 29 (13CO), m/z = 60 (CO3), m/z = 61 (13CO3), m/z = 32 (O2), and m/z = 48 (O3).
To convert the signal measured by the QMS into a column density of desorbed molecules during irradiation, we performed additional experiments with the same setup to calibrate our QMS. These experiments are described in Appendix A.
3. Experimental results and discussion
3.1. IR spectra of CO2 ice during irradiation
As explained in Sect. 2, the solid sample was monitored by IR spectroscopy during the irradiation of the pure CO2 ice. The C=O stretching band of CO2 at 2344 cm-1 is the dominant IR feature, although its intensity decreases during UV irradiation of the ice (see left panel of Fig. 1) along with the bands corresponding to combination modes at 3708 cm-1 and 3600 cm-1 (not shown) and the bending mode at ~658 cm-1 (right panel of Fig. 1).
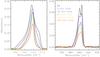 |
Fig. 1 Evolution of two IR bands of CO2 during UV irradiation of a pure CO2 ice analog. Left: C=O stretching mode at 2344 cm-1. Right: degenerate bending modes at ~658 cm-1. |
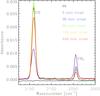 |
Fig. 2 Evolution of the IR bands corresponding to the photoproducts CO and CO3 during UV irradiation of a pure CO2 ice analog. |
Evolution of the ice and gas column densities of CO2 and its photoproducts during UV irradiation of a pure CO2 ice analog.
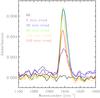 |
Fig. 3 Evolution of the IR feature corresponding to the O3 photoproduct during UV irradiation of pure CO2 ice. |
At the same time, three features appear due to the formation of new species upon photochemistry induced by the UV photons. The C=O stretching band of CO at 2141 cm-1 rapidly increases after irradiation is initiated, as was reported by Gerakines et al. (1996), reaching its maximum intensity after 60 min of irradiation (Fig. 2). A similar behavior is found for the band peaking at 1042 cm-1, which corresponds to O3 (Fig. 3). The band peaking at 2044 cm-1 is assigned to CO3 (Fig. 2; Gerakines et al. 1996; Öberg et al. 2009b). Unlike CO and O3, this species reaches its maximum abundance during the first five minutes of irradiation, which correspond to a fluence of 6 × 10¹⁶ photons/cm2, similar to the value found by Öberg et al. (2009b), and then it decreases gradually as the fluence increases. The presence of these photoproducts in the ice leads to the loss of the double-peak structure of the degenerate bending modes of CO2 (see right panel of Fig. 1), as has previously been reported for carbon dioxide in multicomponent ice analogs (Sandford & Allamandola 1990; Martín-Doménech et al. 2014). Similarly, the shoulder of the C=O stretching band of CO2 peaking at ~2328 cm-1 corresponding to pure and amorphous CO2 ice gradually decreases during irradiation (Escribano et al. 2013).
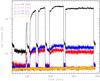 |
Fig. 4 Photodesorption of CO, O2, and CO2 during UV irradiation of pure CO2 ice. The m/z = 44 signal corresponding to CO2 molecules is affected by contamination (see text). Ion current in the y-axis corresponds, approximately, to the partial pressure (mbar) in the main chamber. Note that the y-axis is on a logarithmic scale. |
3.2. Photon-induced desorption during irradiation
The desorbing molecules were detected in the gas phase by the QMS during irradiation. Figure 4 shows the signal of the main mass fragments of all the species mentioned in Sect. 3.1, including m/z = 32, which corresponds to O2. This molecule was not detected in the IR spectra since it is infrared inactive due to the lack of an electric dipole moment. The integrated QMS ion currents have been converted into the column density values shown in Table 3 and Fig. 8 using Eq. (A.2), the values in Table 2, and the kCO value found in Sect. A.1.
As reported by Bahr & Baragiola (2012), Fillion et al. (2014), the CO product displays the highest desorption in CO2 ice irradiation experiments. The photon-induced desorption of O2 leads to a signal increase over the background level that is about four to five times lower than that of the CO in every irradiation period, which is only slightly lower than the relative increase of the O2 signal observed by Bahr & Baragiola (2012). The increase of the m/z = 44 signal during irradiation is affected by contamination, since a similar rise is detected even when no sample is irradiated in the main chamber (see Fig. 5). This is not the case for O2, which is not detected in Fig. 5. Contamination problems are also reported in Loeffler et al. (2005), with a higher impact since in that work a high vacuum chamber is used instead of a UHV chamber. Irradiation of a 13CO2 ice allowed us to rule out the contamination signal and detect the carbon dioxide desorbing from the ice. Figure 6 shows that the amount of 13CO2 molecules desorbing during irradiation is even lower than the one corresponding to O2 (see Sect. 3.4). Therefore, photon-induced desorption of CO2 is negligible, as reported in Bahr & Baragiola (2012), in contrast to what was previously claimed in Öberg et al. (2009b). No desorption of CO3 and O3 was detected during irradiation. Photon-induced desorption of these species was not observed in previous works irradiating pure ices (e.g., Bahr & Baragiola 2012; Zhen & Linnartz 2014).
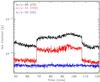 |
Fig. 5 Signals detected by the QMS during irradiation in the main chamber of ISAC without an ice sample. The ion current in the y-axis corresponds, approximately, to the partial pressure (mbar) in the main chamber. Note that the y-axis is on a logarithmic scale. |
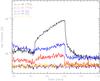 |
Fig. 6 Photodesorption of 13CO, O2 and 13CO2 during UV irradiation of pure 13CO2 ice. The ion current in the y-axis corresponds, approximately, to the partial pressure (mbar) in the main chamber. Note that the y-axis is on a logarithmic scale. |
The QMS ion current measured during the various CO2 ice irradiation intervals due to the photon-induced desorption of CO and O2 in Fig. 4 increases progressively with the fluence up to a constant value after approximately 60 min of irradiation, which coincides with the irradiation time in which the maximum abundance of CO in the ice is reached. This means that the molecules of both species that formed and accumulated in the bulk of the ice are taking part in the desorption process as the top ice layers are gradually removed by the UV photons. Photon-induced desorption is thus taking place through the DIET mechanism, and photochemidesorption, if taking place, has a negligible effect. If photon-induced desorption were taking place through the photochemical mechanism alone, only molecules newly formed in the surface of the ice would be desorbing. The number of desorbing molecules would then be either constant or, alternatively, it would decrease with continuing irradiation, since there would be fewer CO2 molecules available in the ice surface to lead to photoproducts (see Cruz-Díaz et al. 2015, submitted). Moreover, as explained in Sect. 1, photon-induced desorption of both species has already been observed in pure CO and O2 ice irradiation experiments, respectively. In the case of CO, photochemidesorption does not apply, and photon-induced desorption takes place through the DIET mechanism. Fillion et al. (2014, and references therein) have reported that the contribution of photochemical desorption relative to photodesorption is about ~10%. On the other hand, photodesorption of CO2 was expected to increase with the abundance of CO in the ice according to the experiments performed by Fillion et al. (2014) with a monochromatic UV source. However, evolution of the m/z = 44 and m/z = 45 signals in Figs. 4 and 6 shows that the increase is not significant in our experiments.
3.3. Temperature-programmed desorption of the irradiated CO2 ice
After photoprocessing, the ice sample was warmed up with a heating rate of 1 K/min, leading to thermal desorption of all the observed species. Figure 7 shows the temperature-programmed desorption curves of CO2 and the four photoproducts detected during irradiation.
 |
Fig. 7 Temperature-programmed desorption curves of CO2 and its photoproducts after UV irradiation of a pure CO2 ice. The ion current in the y-axis corresponds, approximately, to the partial pressure (mbar) in the main chamber. Note that the y-axis is on a logarithmic scale. |
CO and O2 present desorption peaks at 36 K and 30 K, respectively. While the desorption peak temperature of O2 is similar to that of a pure O2 ice (Acharyya et al. 2007), CO is desorbing at a slightly higher temperature than for pure ice (Muñoz Caro et al. 2010; Martín-Doménech et al. 2014). Both species show a broad peak at ~50 K, which was also detected in Bahr & Baragiola (2012). O3 presents a desorption peak at ~67 K, which is a temperature value similar to that reported in Bahr & Baragiola (2012). Finally, entrapped molecules of the three species co-desorb with CO2 at 87 K, which corresponds to the desorption peak temperature of a pure CO2 ice (see, e.g., Martín-Doménech et al. 2014). Thermal desorption of CO3 is not detected during warm up, probably because of its low abundance at the end of the experiment (see Table 3, leading to a QMS signal below our sensitivity limit, as was the case in Bahr & Baragiola (2012). An additional problem may be the fragmentation pattern of the CO3 ionized molecules, which could not be found in the literature. If m/z = 44 (shared with CO2) were the main mass fragment instead of m/z = 60 (which is plausible since it is an unstable molecule), detection of CO3 would be more difficult.
3.4. Photoprocessing of pure CO2 ice: reaction scheme and photodesorption yields
3.4.1. Evolution of the species
Table 3 and Fig. 8 show the evolution of all the species involved in the photoprocessing of a pure CO2 ice analog in both the solid and gaseous phases. Since photon-induced desorption of CO2 is negligible (see Sect. 3.2), we have assumed that Ngas(CO2) = 0.
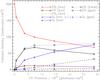 |
Fig. 8 Evolution of the ice and gas column densities of CO2 and its photoproducts during UV irradiation of a pure CO2 ice analog. O2 (ice) column density is an estimated upper limit assuming that all remaining O atoms are locked in O2 molecules. |
After the first five minutes of irradiation (corresponding to a fluence of 6 × 10¹⁶ photons/cm2), the total number of C and O atoms relative to the initial values in the deposited ice does not remain constant, with a discrepancy up to 25% once the irradiation is completed in the case of C. This is probably because of the uncertainties in the quantification of the column densities in the ice (see Sect. 2), which can be of about 20−30%. In a follow-up paper, the presence of C and O atoms in the ice or in the gas phase after desorption (not quantified here) is studied in more depth, giving an alternative explanation to this issue (Chen et al., in prep.). A fraction of O atoms is locked in the ice in the form of O2 molecules, which cannot be detected by IR spectroscopy. We have estimated an upper limit to the column density of O2 in the ice assuming that all remaining O atoms are contained in O2 molecules.
Initial destruction or formation cross sections of the species during UV irradiation of a pure CO2 ice analog.
An initial destruction or formation cross section σdes/form is calculated independently for every species in Table 3, fitting their column densities before equilibrium is reached to an equation of the form ![Mathematical equation: \begin{equation} \centering N = N_{\infty} \left[1 + \frac{N_{0}-N_{\infty}}{N_{\infty}} {\rm e}^{-\sigma_{\rm des} {\rm Fluence}}\right] \label{destruccion} , \end{equation}](/articles/aa/full_html/2015/12/aa26003-15/aa26003-15-eq65.png) (2)or, alternatively,
(2)or, alternatively, ![Mathematical equation: \begin{equation} \centering N = N_{\rm max} \left[1 - {\rm e}^{-\sigma_{\rm form} {\rm Fluence}}\right] \label{formacion} \end{equation}](/articles/aa/full_html/2015/12/aa26003-15/aa26003-15-eq66.png) (3)for the species that are either destroyed or formed during photoprocessing of the CO2 ice, respectively. These equations are adapted from Loeffler et al. (2005). While N0 and Nmax are fixed by the experimental data, N∞ was a free parameter of the fit. Since CO3 is readily formed during the first irradiation period and is then subsequently destroyed, Eq. (2) was used in that case. Calculated cross sections are shown in Table 4. These values should be regarded as apparent initial cross sections for the destruction or formation of every species. The values estimated for CO2 and CO are more than one order of magnitude higher than those reported in Gerakines et al. (1996) for the same experiment, but the ratio between the two is similar. This is probably due to an overestimation of their photon flux, as suggested in Loeffler et al. (2005). At the same time, the value found for the destruction cross section of CO2 is on the same order as the one reported in Loeffler et al. (2005) for the destruction of this molecule in a pure CO ice irradiation experiment, calculated with a more complex model that includes the simultaneous fit of the CO and CO2 column densities at high fluences. A deeper study of the reaction rates would require the assigment of a kinetic constant ki to every reaction in Sect. 3.4.2 and the simultaneous fit of the column densities of the five species, which is beyond the scope of this work.
(3)for the species that are either destroyed or formed during photoprocessing of the CO2 ice, respectively. These equations are adapted from Loeffler et al. (2005). While N0 and Nmax are fixed by the experimental data, N∞ was a free parameter of the fit. Since CO3 is readily formed during the first irradiation period and is then subsequently destroyed, Eq. (2) was used in that case. Calculated cross sections are shown in Table 4. These values should be regarded as apparent initial cross sections for the destruction or formation of every species. The values estimated for CO2 and CO are more than one order of magnitude higher than those reported in Gerakines et al. (1996) for the same experiment, but the ratio between the two is similar. This is probably due to an overestimation of their photon flux, as suggested in Loeffler et al. (2005). At the same time, the value found for the destruction cross section of CO2 is on the same order as the one reported in Loeffler et al. (2005) for the destruction of this molecule in a pure CO ice irradiation experiment, calculated with a more complex model that includes the simultaneous fit of the CO and CO2 column densities at high fluences. A deeper study of the reaction rates would require the assigment of a kinetic constant ki to every reaction in Sect. 3.4.2 and the simultaneous fit of the column densities of the five species, which is beyond the scope of this work.
3.4.2. Reaction scheme
Ultraviolet photons dissociate CO2 molecules through the reaction  (4)Carbon monoxide is thus the primary product of photoprocessing of pure CO2 ice. Its final total abundance after a UV fluence of 2.9 × 10¹⁸ photons/cm2 is ~40% of the initial CO2 column density. This value is four times higher than the one reported in Öberg et al. (2009b) for the photoprocessing of a thinner CO2 ice and a fluence about four times lower, and it is slightly higher than that found in Gerakines et al. (1996) with a similar fluence but a higher initial column density. In our case, with an initial CO2 column density of 200.3 ML, 12.6% of the incident photons are absorbed in the ice (for an average VUV-absorption cross section of 0.67 × 10⁻¹⁸ cm-2, Cruz-Díaz et al. 2014b), leading to ~0.000125 absorbed photons molecule-1 s-1.
O atoms formed by the reaction in Eq. (4) can easily react with nearby CO2 molecules to produce CO3 as a secondary product,  (5)However, these molecules can be photodissociated, thus reforming CO2 and O atoms:
  (6)As the fluence increases, photodissociation dominates formation, and the CO3 abundance drops to ~1% of the initial CO2. This value is lower than the one in Gerakines et al. (1996), but agrees well with the low abundances in more recent works performed in UHV conditions (Öberg et al. 2009b; Bahr & Baragiola 2012).
Alternatively, O atoms can react with the photodissociation products of other CO2 molecules,  (7)(Bahr & Baragiola 2012)
  (8)As irradiation proceeds, reactions 6 and 7 compete with reaction 4, decreasing the net CO2 photodissociation rate to ~10 ML/h.
In an analogous way, reaction 7 competes with CO formation in reaction 4. Equilibrium is reached after a UV fluence of 7.2 × 10¹⁷ photons/cm2, at this stage the total number of CO molecules remains almost constant. However, after equilibrium is reached, the column density of CO in the ice decreases due to the contribution of photodesorption, which proceeds at a constant rate of ~8 ML/h. Finally, ~40% of the produced CO has photodesorbed to the gas phase.
Evolution of the CO and O2 photodesorption yields during UV irradiation of a pure CO2 ice analog.
The O2 molecules formed in the ice by reaction 8 can either photodissociate,  (9)(Edis = 5.1 eV for gas phase molecules, Okabe 1978), or further react with free O atoms to form O3,
  (10)Ozone molecules can be destroyed by the photodissociation reaction,
  (11)leading to a drop in its column density after about one hour of irradiation. Its final abundance is ~4% of the initial CO2 column density, which is slightly lower than the value reported in Gerakines et al. (1996).
3.4.3. Photodesorption yields
Photodesorption yields (Ypd) of CO and O2 reach constant values after ~60 min of irradiation (see Table 5), with Ypd (CO) ~1.2 × 10⁻² molecules incident photon-1, and Ypd (O2) ~9.3 × 10⁻⁴ molecules incident photon-1. The value found in this work for Ypd(CO), measured directly from the quantification of the CO molecules detected by the QMS is about ten times higher than the one reported in Öberg et al. (2009b) for the sum of all the photodesorption products, which was measured indirectly from the loss of ice molecules using reflection absorption infrared spectroscopy (RAIRS). This photodesorption yield is about five times lower than the one reported in Muñoz Caro et al. (2010), Chen et al. (2014) for pure CO ice irradiation experiments. The photodesorption yield of O2 in this work is ~50% higher than the one reported in Zhen & Linnartz (2014) for VUV irradiation of a pure O2 ice with broad Lyα light. Photodesorption yield of CO2 has only been measured for the 13CO2 ice irradiation experiments and remains constant with fluence. We have found a value of Ypd (13CO2) ~ 1.1 × 10⁻⁴ molecules incident photon-1, on the same order of magnitude as the photodesorption yields reported in Fillion et al. (2014) for monochromatic UV irradiation with similar photon energy. Photodesorption yield of 13CO is virtually the same as in the case of 12CO, and we expect a similar behavior for carbon dioxide.
4. Astrophysical implications
As mentioned in Sect. 1, CO2 is, along with CO, one of the most abundant species found in the water-rich ice mantles covering dust grains. Solid CO2 is consistently detected in a variety of environments. Its average abundance relative to water is ~18% in quiescent molecular clouds where ice mantles are formed (Whittet et al. 2007), and ~17% in high-mass protostellar envelopes (Gerakines et al. 1999). However, this abundance is much higher in circumstellar ices around low-mass protostars (32%, Pontoppidan et al. 2008), suggesting that there is a new formation route to CO2 that is activated in these regions. Formation of solid CO2 is not fully understood yet, but a gas-phase pathway is ruled out since models predict CO2 abundances much lower than observed (Bergin et al. 1995). The two most likely formation pathways are UV photoprocessing of H2O:CO ices (d’Hendecourt et al. 1986) and cosmic-ray irradiation of pure CO ices (e.g., Jamieson et al. 2006). Approximately two thirds of the observed solid CO2 is found in a water-rich environment, while one third is detected in a CO environment. Pure and crystalline CO2 ice, such as the one used in our experimental simulations (Escribano et al. 2013), is also observed. It may be formed by segregation from the water-rich environment or through evaporation of the CO from the CO:CO2 component (Pontoppidan et al. 2008). CO2 ice in space can be energetically processed. In particular, UV photoprocessing in dense cloud interiors is possible thanks to the secondary UV field mentioned in Sect. 1. Assuming a flux value of 104 photons cm-2 s-1, ice mantles experience a fluence of 3.2 × 10¹⁷ photons cm-2 in the expected lifetime of a molecular cloud (Shen et al. 2004). This fluence is similar to that experienced for the pure CO2 ice after 30 min of irradiation in our experiments.
During our experimental simulations, the estimated photon-induced desorption rate of CO2 was ~1.1 × 10⁻⁴ molecules per incident VUV photon, which only accounts for the desorption of 3.5 × 10¹³ molecules cm-2 during the cloud lifetime. This agrees well with observations, since CO2 is completely frozen, except in very hot or shocked regions (Bergin et al. 1995; Boonman et al. 2003; Nomura & Millar 2004; Lahuis et al. 2007).
Only 4% of the CO formed from photolysis of CO2 molecules photodesorbed after a fluence of 3.6 × 10¹⁷ photons cm-2, although this value increased as irradiation took place in our experiments, up to 75% for a total fluence of 2.88 × 10¹⁸ photons cm-2. Therefore, we do not expect that CO formed from CO2 represents a significant contribution to the gas-phase CO observed in molecular clouds. Instead, photodesorption of pure CO ice has been found to be more efficient by a factor of 5 (Muñoz Caro et al. 2010; Chen et al. 2014).
The column density of CO3 after 30 min of irradiation represented only 3.6% of the initial CO2. Moreover, we did not observe photon-induced or thermal desorption of this species during our experiments. The abundance of CO3 in the ISM is thus expected to be very low; this species was indeed never observed. Finally, photodesorption of O2 was very low in our experimental simulations, a rate of 9.3 × 10⁻⁴ molecules per incident photon was estimated, while photon-induced desorption of O3 was not observed at all. Therefore, these two species would be more likely observed in warm regions where they can be thermally desorbed from the ice mantles. Molecular oxygen has recently been detected in a warm region of the Orion molecular cloud using Herschel observations (Goldsmith et al. 2011).
5. Conclusions
We have revisited the UV photoprocessing of a pure CO2 ice analog. IR spectroscopy in transmittance allowed us to monitor the solid sample during irradiation. Three photoproducts were detected: CO, CO3, and O3, with final column densities of approximately 40%, 1%, and 4% relative to the initial CO2 after a total UV fluence of 2.88 × 10¹⁸ photons cm-2. If we limit UV irradiation to a fluence similar to that experienced by the ice mantles in dense cloud interiors (~3 × 10¹⁷ photons cm-2 for a flux of 2 × 10¹⁴ photons cm-2 s-1 after a cloud lifetime of 106 yr, Shen et al. 2004, and references therein), the final column density of CO is slightly lower (32%), while those of CO3 and O3 are higher (4% and 6%, respectively). A fourth photoproduct, the homonuclear O2 with no permanent dipole moment, is IR inactive and could not be detected by the FTIR spectrometer. We have estimated an upper limit to its ice abundance of 38% relative to the initial CO2 for a fluence of 2.88 × 10¹⁸ photons cm-2, or 14% after a fluence similar to the above astrophysical scenario. A chemical network leading to these four photoproducts was presented in Sect. 3.4. We used a calibration method for quadrupole mass spectrometers that allowed us to quantify the photodesorbing molecules detected directly in the gas phase during ice irradiation, leading to an estimation of the fraction of photoproducts in the ice that were photodesorbed. Photodesorption of CO and, to a lesser extent, O2 and CO2 was observed in the CO2 ice irradiation experiment, with photodesorption yields of Ypd (CO) ~ 1.2 × 10⁻² molecules incident photon-1, Ypd (O2) ~ 9.3 × 10⁻⁴ molecules incident photon-1, and ~1.1 × 10⁻⁴ molecules incident photon-1, respectively. Photon-induced desorption took place mainly through the DIET mechanism, since the QMS signal produced by CO and O2 desorbed molecules gradually increases until the maximum column density of CO is reached as a result of the participation of accumulated molecules in the bulk of the ice. These findings have important implications for the release of ice molecules into the gas phase in cold regions where thermal desorption is inhibited. Certain molecules, like CO2 in this paper, are efficiently photodissociated and their photodesorption is negligible, while photon-induced desorption of their photoproducts is observed, driven either by the DIET mechanism (as in this work) or by photochemidesorption (see Cruz-Díaz et al. 2015). The photodesorption yields found in this work are not high enough to represent a significant contribution to the presence of these species in the gas phase of quiescent molecular clouds, since only 4% of the formed CO, and a negligible amount of CO2 and O2 have photodesorbed after a UV fluence similar to the one that ice mantles experience during the mean lifetime of these regions. Therefore, the observed gaseous CO in molecular clouds may come from a different origin than CO2 photolysis, while gaseous CO2, O2, and O3 are more likely present in warm regions of circumstellar environments where these species can be thermally desorbed. Finally, based on our experimental evidence, CO3 production may be too low to be observed in the gas phase.
Online material
Appendix A: Calibration of QMS
The integrated ion current measured by a QMS corresponding to a mass fragment m/z of the molecules of a given species desorbed during ice irradiation experiments is proportional to the total number of molecules desorbed, and it can be calculated as follows:  (A.1)where A(m/z) is the integrated area below the QMS signal of a given mass fragment m/z during photon-induced desorption, kQMS is the proportionality constant, σ+(mol) the ionization cross section for the first ionization of the species of interest and the incident electron energy of the mass spectrometer, N(mol) the total number of desorbed molecules in column density units, IF(z) the ionization factor, that is, the fraction of ionized molecules with charge z, FF(m) the fragmentation factor, that is, the fraction of molecules of the isotopolog of interest leading to a fragment of mass m in the mass spectrometer, and S(m/z) the sensitivity of the QMS to the mass fragment (m/z) (see Tanarro et al. 2007, and references therein).
The measured ion current depends on the ionization cross section of the species (σ+(mol)), since only ionized molecules produce a signal in the QMS. The product IF(z)·FF(m) represents the fraction of desorbed molecules that leads to the monitored mass fragment m/z once they are ionized in the QMS. The sensitivity S(m/z) must be calibrated for every mass spectrometer. On the other hand, kQMS depends not only on the mass spectrometer, but on the configuration of the experimental setup, and, in particular, on the fraction of desorbed molecules that reach the QMS. This fraction in turn depends on the pumping speed for the different molecules. A brief study of the pumping speed of the setup described in Sect. 2 is presented in Muñoz Caro et al. (2010). In the following discussion we have assumed as a first approximation that this speed is the same for all the molecules, so that kQMS does not depend on the species. The same assumption has been used in previous works (see Fayolle et al. 2013; Fillion et al. 2014, and references therein). Both kQMS and, to a lesser extent, S(m/z) are subject to variations in the behavior of the QMS with time. Calibration of these two factors for our QMS is described below.
Appendix A.1: Calibration of proportionality constant kQMS
As we explained in Sect. 1, CO ice irradiation experiments under UHV conditions can be used as a reference to calibrate the QMS signal. Equation (A.1) can be rewritten as follows:  (A.2)where kCO is
 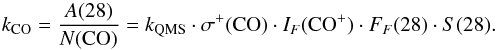 (A.3)Therefore, the problem of calibrating kQMS can be replaced by the problem of calculating kCO. To derive kCO for our experimental setup, we performed UV-irradiation experiments of a pure CO ice made by deposition of CO (gas, Praxair 99.998%), using the protocol described in Sect. 2. Since in the case of solid CO photon-induced chemistry accounts for only ~5% of the absorbed photons (Muñoz Caro et al. 2010), the area below the m/z = 28 signal detected with the QMS (A(28) in Eq. (A.3); left panel of Fig. A.1) practically corresponds to the loss of CO molecules in the ice (N(CO) in Eq. (A.3)), measured with the FTIR spectrometer (middle panel of Fig. A.1). The relation between A(28) and N(CO) (right panel of Fig. A.1) gives kCO = 1.32 × 10⁻¹⁰ A min ML-1, with 1 ML defined as 1015 molecules cm-2. This value is good for our setup by the time the experiments were performed.
Appendix A.2: Calibration of the QMS sensitivity S (m/z)
The experimental protocol used to obtain S(m/z) was slightly different from the one described in Sects. 2 and A.1. The QMS ion current (I(m/z)), corresponding to a mass fragment m/z of the molecules of a given species present in the chamber at a given time, is proportional to the pressure measured for that species (Pmol), and can be calculated with an equation similar to Eq. (A.1), but with a different constant of proportionality:  (A.4)In this case, the Bayard-Alpert ionization gauge (model IoniVac IM540) used as manometer in ISAC does not discriminate between different isotopologs of the same species, and P(mol) (once corrected for the gas correction factors provided by the gauge manufacturer) account for all of them. Therefore, an isotopic factor (IsF(m)) must be introduced to take into account only the isotopolog of mass m that is being measured by the QMS.
Since Eq. (A.2) uses the relative sensitivity of the QMS between any mass fragment and the mass fragment m/z = 28, it is not necessary to obtain the absolute sensitivity of the mass spectrometer. Instead we worked with 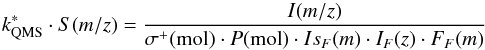 (A.5)for every mass fragment, since the ratio S(m/z)/S(28) is the same as the ratio
  /
/ .
.
To derive a relation between  and m/z that could be used for mass fragments of any species, we introduced three nobel gases into the ISAC chamber: He (gas, Air Liquide 99.999%), Ne (gas, Air Liquide 99.995%), and Ar (gas, Praxair 99.997%) at different pressures. For every gas, the ratio between the QMS signal (I(m/z)) and the pressure of the gas (P(mol)) was corrected for the factors in Eq. (A.5) (Table A.1, except for the fragmentation factor, since noble gas atoms do not produce any fragments in the mass spectrometer), leading to a value of for three different m/z values (m/z = 4 for He, m/z = 20 for Ne, and m/z = 40 for Ar). These values are plotted in Fig. A.2. An exponential fit leads to a sensitivity curve
  (A.6)in A mbar-1Å-2.
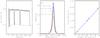 |
Fig. A.1 Left: evolution of the m/z = 28 QMS signal corresponding to the photodesorption of CO during UV irradiation of a pure CO ice. The ion current in the y-axis corresponds, approximately, to the partial pressure (mbar) in the main chamber. Dotted lines represent the baselines used to calculate A(28) in every irradiation period. Note that the y-axis is on a logarithmic scale. Middle: evolution of the C=O stretching mode of CO at 2139 cm-1 during UV irradiation of pure CO ice. Differences in the column densities after every period of irradiation correspond to N(CO) in Eq. (A.3). Right: relation between A(28) and N(CO). The solid line is a linear fit. |
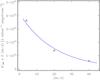 |
Fig. A.2 Relation between |
Acknowledgments
This research was financed by the Spanish MINECO under project AYA2011-29375. R.M.D. benefited from a FPI grant from Spanish MINECO. V.J.H. and I.T. acknowledge financial support from Spanish MINECO under project FIS2013-48087-C2-1-P.
References
- Acharyya, K., Fuchs, G. W., Fraser, H. J., van Dishoeck, E. F., & Linnartz, H. 2007, A&A, 466, 1005 [NASA ADS] [CrossRef] [EDP Sciences] [Google Scholar]
- Agarwal, V. K., Schutte, W. A., Greenberg, J. M., et al. 1985, Origins Life Evol. Biosphere, 16, 21 [Google Scholar]
- Allamandola, L. J., Sandford, S. A., & Valero, G. J. 1988, Icarus, 76, 225 [NASA ADS] [CrossRef] [Google Scholar]
- Andersson, S., & van Dishoeck, E. F. 2008, A&A, 491, 907 [NASA ADS] [CrossRef] [EDP Sciences] [Google Scholar]
- Arasa, C., van Hermet, M. C., van Dishoeck, E. F., & Kroes, G. J. 2013, J. Phys. Chem. A, 117, 7064 [CrossRef] [Google Scholar]
- Bahr, D. A., & Baragiola, R. A. 2012, ApJ, 761, 36 [NASA ADS] [CrossRef] [Google Scholar]
- Bergin, E. A., Langer, W. D., & Goldsmith, P. F. 1995, ApJ, 441, 222 [NASA ADS] [CrossRef] [Google Scholar]
- Bergin, E. A., Ciardi, D. R., Lada, C. J., et al. 2001, ApJ, 557, 209 [NASA ADS] [CrossRef] [Google Scholar]
- Bernstein, M. P., Sandford, S. A., Allamandola, L. J., Chang, S., & Scharberg, M. A. 1995, ApJ, 454, 327 [NASA ADS] [CrossRef] [Google Scholar]
- Bernstein, M. P., Dworkin, J. P., Sandford, S. A., Cooper, G. W., & Allamandola, L. J. 2002, Nature, 416, 401 [NASA ADS] [CrossRef] [PubMed] [Google Scholar]
- Bertin, M., Fayolle, E. C., Romanzin, C., et al. 2012, Phys. Chem. Chem. Phys., 14, 9929 [NASA ADS] [CrossRef] [Google Scholar]
- Bertin, M., Fayolle, E. C., Romanzin, C., et al. 2013, ApJ, 779, 120 [NASA ADS] [CrossRef] [Google Scholar]
- Boonman, A. M. S., van Dishoeck, E. F., Lahuis, F., & Doty, S. D. 2003, A&A, 399, 1063 [NASA ADS] [CrossRef] [EDP Sciences] [Google Scholar]
- Briggs, R., Ertem, G., Ferris, J. P., et al. 1992, Origins Life Evol. Biosphere, 22, 287 [Google Scholar]
- Cecchi-Pestellini, C., & Aiello, S. 1992, MNRAS, 258, 125 [NASA ADS] [CrossRef] [Google Scholar]
- Chen, Y.-J., Chu, C.-C., Lin, Y.-C., et al. 2010, Adv. Geosc., 25, 259 [Google Scholar]
- Chen, Y.-J., Chuang, K.-J., Muñoz Caro, G. M., et al. 2014, ApJ, 781, 15 [Google Scholar]
- Cruz-Díaz, G. A., Muñoz Caro, G. M., Chen, Y.-J., & Yih, T.-S. 2014a, A&A, 562, A119 [NASA ADS] [CrossRef] [EDP Sciences] [Google Scholar]
- Cruz-Díaz, G. A., Muñoz Caro, G. M., Chen, Y.-J., & Yih, T.-S. 2014b, A&A, 562, A120 [NASA ADS] [CrossRef] [EDP Sciences] [Google Scholar]
- Cruz-Díaz, G. A., Muñoz Caro, G. M., et al. 2015, A&A, submitted [Google Scholar]
- d’Hendecourt, L. B., & Allamandola, L. J. 1986, A&AS, 64, 453 [NASA ADS] [Google Scholar]
- d’Hendecourt, L. B., Allamandola, L. J., Grim, R. J. A., & Greenberg, J. M. 1986, A&A, 158, 119 [NASA ADS] [Google Scholar]
- Escribano, R. M., Muñoz Caro, G. M., Cruz-Díaz, G. A., Rodríguez-Lazcano, Y., & Maté, B. 2013, PNAS, 110, A32 [Google Scholar]
- Fayolle, E. C., Bertin, M., Romanzin, C., et al. 2011, ApJ, 739, L36 [NASA ADS] [CrossRef] [Google Scholar]
- Fayolle, E. C., Bertin, M., Romanzin, C., et al. 2013, A&A, 556, A122 [NASA ADS] [CrossRef] [EDP Sciences] [Google Scholar]
- Fillion, J.-H., Fayolle, E., Michaut, X., et al. 2014, Faraday Discuss., 168, 533 [Google Scholar]
- Gerakines, P. A., Schutte, W. A., Greenberg, J. M., & van Dishoeck, E. F. 1995, A&A, 296, 810 [NASA ADS] [Google Scholar]
- Gerakines, P. A., Schutte, W. A., & Ehrenfreund, P. 1996, A&A, 312, 289 [NASA ADS] [Google Scholar]
- Gerakines, P. A., Whittet, D. C. B., Ehrenfreund, P. A., et al. 1999, ApJ, 522, 357 [NASA ADS] [CrossRef] [Google Scholar]
- Gerakines, P. A., Moore, M. H., & Hudson, R. L. 2001, J. Geophys. Res. Planets, 106, 33381 [CrossRef] [Google Scholar]
- Gerakines, P. A., Moore, M. H., & Hudson, R. L. 2004, Icarus, 170, 202 [NASA ADS] [CrossRef] [Google Scholar]
- Goldsmith, P. F., Liseau, R., Bell, T. A., et al. 2011, ApJ, 737, A96 [NASA ADS] [CrossRef] [Google Scholar]
- Gredel, R., Lepp, S., Dalgarno, A., & Herbst, E. 1989, ApJ, 347, 289 [NASA ADS] [CrossRef] [Google Scholar]
- Herbst, E., & van Dishoeck, E. F. 2009, ARA&A, 47, 427 [NASA ADS] [CrossRef] [Google Scholar]
- Jamieson, C. S., Mebel, A. M., & Kaiser, R. I. 2006, ApJS, 163, 184 [NASA ADS] [CrossRef] [Google Scholar]
- Jiang, G. J., Person, W. B., & Brown, K. G. 1975, J. Chem. Phys., 62, 1201 [NASA ADS] [CrossRef] [Google Scholar]
- de Laeter, J. R., Böhlke, J. R., De Bievre, P., et al. 2003, Pure Appl. Chem., 75, 685 [Google Scholar]
- Lahuis, F., van Dishoeck, E. F., Blake, G. A., et al. 2007, ApJ, 665, 492 [NASA ADS] [CrossRef] [Google Scholar]
- Loeffler, M. J., Baratta, G. A., Palumbo, M. E., Strazzulla, G., & Baragiola, R. A. 2005, A&A, 435, 587 [NASA ADS] [CrossRef] [EDP Sciences] [MathSciNet] [Google Scholar]
- Majeed, T., & Strickland, D. J. 1997, J. Phys. Chem. Ref. Data, 26, 335 [NASA ADS] [CrossRef] [Google Scholar]
- Martín-Doménech, R., Muñoz Caro, G. M., Bueno, J., & Goesmann, F. 2014, A&A, 564, A8 [NASA ADS] [CrossRef] [EDP Sciences] [Google Scholar]
- Meierhenrich, U. J., Muñoz Caro, G. M., Schutte, W. A., et al. 2005, Chem. Eur. J., 11, 4895 [CrossRef] [Google Scholar]
- Moore, M. H., Hudson, R. L., & Gerakines, P. A. 2001, Spectrochimica Acta Part A, 57, 843 [Google Scholar]
- Mumma, M. J., & Charnley, S.B. 2011, ARA&A, 49, 471 [NASA ADS] [CrossRef] [Google Scholar]
- Muñoz Caro, G. M., & Dartois, E. 2009, A&A, 494, 109 [NASA ADS] [CrossRef] [EDP Sciences] [Google Scholar]
- Muñoz Caro, G. M., & Schutte, W. A. 2003, A&A, 412, 121 [NASA ADS] [CrossRef] [EDP Sciences] [Google Scholar]
- Muñoz Caro, G. M., Ruiterkamp, R., Schutte, W. A., Greenberg, J. M., & Mennella, V. 2001, A&A, 367, 347 [NASA ADS] [CrossRef] [EDP Sciences] [Google Scholar]
- Muñoz Caro, G. M., Meierhenrich, U. J., Schutte, W. A., et al. 2002, Nature, 416, 403 [NASA ADS] [CrossRef] [PubMed] [Google Scholar]
- Muñoz Caro, G. M., Meierhenrich, U. J., Schutte, W. A., Thiemann, W. H. P., & Greenberg, J. M. 2004, A&A, 413, 209 [NASA ADS] [CrossRef] [EDP Sciences] [Google Scholar]
- Muñoz Caro, G. M., Jiménez-Escobar, A., Martín-Gago, J. Á., et al. 2010, A&A, 522, A108 [NASA ADS] [CrossRef] [EDP Sciences] [Google Scholar]
- Nomura, H., & Millar, T. J. 2004, A&A, 414, 909 [Google Scholar]
- Nuevo, M., Meierhenrich, U. J., Muñoz Caro, G. M., et al. 2006, A&A, 457, 741 [NASA ADS] [CrossRef] [EDP Sciences] [Google Scholar]
- Öberg, K. I., Fuchs, G. W., Awad, Z., et al. 2007, ApJ, 662, L23 [NASA ADS] [CrossRef] [Google Scholar]
- Öberg, K. I., Garrod, R. T., van Dishoeck, E. F., & Linnartz, H. 2009a, A&A, 504, 891 [NASA ADS] [CrossRef] [EDP Sciences] [Google Scholar]
- Öberg, K. I., van Dishoeck, E. F., & Linnartz, H. 2009b, A&A, 496, 281 [NASA ADS] [CrossRef] [EDP Sciences] [Google Scholar]
- Öberg, K. I., van Dishoeck, E. F., Linnartz, H., & Andersson, S. 2010, ApJ, 718, 832 [NASA ADS] [CrossRef] [Google Scholar]
- Okabe, H. 1978, Photochemistry of small molecules (New York: John Wiley & Sons) [Google Scholar]
- Pontoppidan, K. M., Boogert, A. C. A., Fraser, H. J., et al. 2008, ApJ, 678, 1005 [NASA ADS] [CrossRef] [Google Scholar]
- Rakhovskaia, O., Wiethoff, P., & Feulner, P. 1995, Nucl. Instr. Meth. Phys. Res. B, 101, 169 [Google Scholar]
- Rejoub, R., Lindsay, B. G., & Stebbings, R. F. 2002, Phys. Rev. A, 65, 042713 [NASA ADS] [CrossRef] [Google Scholar]
- Sandford, S. A., & Allamandola, L. J. 1990, ApJ, 355, 357 [NASA ADS] [CrossRef] [Google Scholar]
- Shen, C. J., Greenberg, J. M., Schutte, W. A., & van Dishoeck, E. F. 2004, A&A, 415, 203 [NASA ADS] [CrossRef] [EDP Sciences] [Google Scholar]
- Smith, M. A. H., Rinsland, C. P., Fridovich, B., & Rao, K. N. 1985, in Molecular Spectroscopy-Modern research, Vol. III, ed. K. N. Rao (London: Academic Press), 111 [Google Scholar]
- Tanarro, I., Herrero, V. J., Islyaikin, A. M., et al. 2007, J. Phys. Chem. A, 111, 9003 [CrossRef] [Google Scholar]
- Westley, M. S., Baragiola, R. A., Johnson, R. E., & Baratta, G. A. 1995, Nature, 373, 405 [NASA ADS] [CrossRef] [PubMed] [Google Scholar]
- Willacy, K., & Langer, W. D. 2000, ApJ, 544, 903 [NASA ADS] [CrossRef] [Google Scholar]
- Whittet, D. C. B., Shenoy, S. S., Bergin, E. A., et al. 2007, ApJ, 655, 332 [NASA ADS] [CrossRef] [Google Scholar]
- Yamada, H., & Person, W. B. 1964, J. Chem. Phys., 41, 2478 [NASA ADS] [CrossRef] [Google Scholar]
- Yuan, C., & Yates, Jr., J. T. 2013, J. Chem. Phys., 138, 154303 [NASA ADS] [CrossRef] [Google Scholar]
- Yuan, C., & Yates, Jr., J. T. 2014, ApJ, 780, 8 [NASA ADS] [CrossRef] [Google Scholar]
- Zhen, J., & Linnartz, H. 2014, MNRAS, 437, 3190 [NASA ADS] [CrossRef] [Google Scholar]
All Tables
IR feature used to calculate the column density of each component (frequencies and band strengths for pure ices at 8 K).
Evolution of the ice and gas column densities of CO2 and its photoproducts during UV irradiation of a pure CO2 ice analog.
Initial destruction or formation cross sections of the species during UV irradiation of a pure CO2 ice analog.
Evolution of the CO and O2 photodesorption yields during UV irradiation of a pure CO2 ice analog.
All Figures
|
Fig. 1 Evolution of two IR bands of CO2 during UV irradiation of a pure CO2 ice analog. Left: C=O stretching mode at 2344 cm-1. Right: degenerate bending modes at ~658 cm-1. |
| In the text | |
|
Fig. 2 Evolution of the IR bands corresponding to the photoproducts CO and CO3 during UV irradiation of a pure CO2 ice analog. |
| In the text | |
|
Fig. 3 Evolution of the IR feature corresponding to the O3 photoproduct during UV irradiation of pure CO2 ice. |
| In the text | |
|
Fig. 4 Photodesorption of CO, O2, and CO2 during UV irradiation of pure CO2 ice. The m/z = 44 signal corresponding to CO2 molecules is affected by contamination (see text). Ion current in the y-axis corresponds, approximately, to the partial pressure (mbar) in the main chamber. Note that the y-axis is on a logarithmic scale. |
| In the text | |
|
Fig. 5 Signals detected by the QMS during irradiation in the main chamber of ISAC without an ice sample. The ion current in the y-axis corresponds, approximately, to the partial pressure (mbar) in the main chamber. Note that the y-axis is on a logarithmic scale. |
| In the text | |
|
Fig. 6 Photodesorption of 13CO, O2 and 13CO2 during UV irradiation of pure 13CO2 ice. The ion current in the y-axis corresponds, approximately, to the partial pressure (mbar) in the main chamber. Note that the y-axis is on a logarithmic scale. |
| In the text | |
|
Fig. 7 Temperature-programmed desorption curves of CO2 and its photoproducts after UV irradiation of a pure CO2 ice. The ion current in the y-axis corresponds, approximately, to the partial pressure (mbar) in the main chamber. Note that the y-axis is on a logarithmic scale. |
| In the text | |
|
Fig. 8 Evolution of the ice and gas column densities of CO2 and its photoproducts during UV irradiation of a pure CO2 ice analog. O2 (ice) column density is an estimated upper limit assuming that all remaining O atoms are locked in O2 molecules. |
| In the text | |
|
Fig. A.1 Left: evolution of the m/z = 28 QMS signal corresponding to the photodesorption of CO during UV irradiation of a pure CO ice. The ion current in the y-axis corresponds, approximately, to the partial pressure (mbar) in the main chamber. Dotted lines represent the baselines used to calculate A(28) in every irradiation period. Note that the y-axis is on a logarithmic scale. Middle: evolution of the C=O stretching mode of CO at 2139 cm-1 during UV irradiation of pure CO ice. Differences in the column densities after every period of irradiation correspond to N(CO) in Eq. (A.3). Right: relation between A(28) and N(CO). The solid line is a linear fit. |
| In the text | |
|
Fig. A.2 Relation between |
| In the text | |
Current usage metrics show cumulative count of Article Views (full-text article views including HTML views, PDF and ePub downloads, according to the available data) and Abstracts Views on Vision4Press platform.
Data correspond to usage on the plateform after 2015. The current usage metrics is available 48-96 hours after online publication and is updated daily on week days.
Initial download of the metrics may take a while.