Fig. A.1
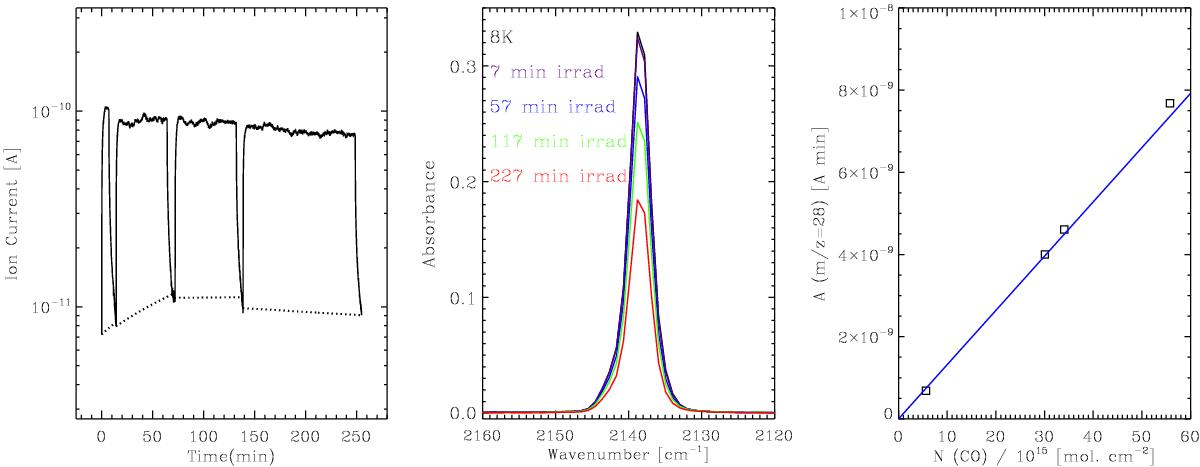
Left: evolution of the m/z = 28 QMS signal corresponding to the photodesorption of CO during UV irradiation of a pure CO ice. The ion current in the y-axis corresponds, approximately, to the partial pressure (mbar) in the main chamber. Dotted lines represent the baselines used to calculate A(28) in every irradiation period. Note that the y-axis is on a logarithmic scale. Middle: evolution of the C=O stretching mode of CO at 2139 cm-1 during UV irradiation of pure CO ice. Differences in the column densities after every period of irradiation correspond to N(CO) in Eq. (A.3). Right: relation between A(28) and N(CO). The solid line is a linear fit.
Current usage metrics show cumulative count of Article Views (full-text article views including HTML views, PDF and ePub downloads, according to the available data) and Abstracts Views on Vision4Press platform.
Data correspond to usage on the plateform after 2015. The current usage metrics is available 48-96 hours after online publication and is updated daily on week days.
Initial download of the metrics may take a while.