| Issue |
A&A
Volume 583, November 2015
|
|
|---|---|---|
| Article Number | A72 | |
| Number of page(s) | 12 | |
| Section | Extragalactic astronomy | |
| DOI | https://doi.org/10.1051/0004-6361/201526907 | |
| Published online | 29 October 2015 | |
SINFONI spectra of heavily obscured AGNs in COSMOS: Evidence of outflows in a MIR/O target at z ~ 2.5⋆
1
Dipartimento di Fisica e AstronomiaUniversità di Bologna,
viale Berti Pichat 6/2,
40127
Bologna, Italy
e-mail: michele.perna4@unibo.it
2
INAF–Osservatorio Astronomico di Bologna,
via Ranzani 1, 40127
Bologna,
Italy
3
Max-Planck Institut fur Extraterrestrische Physik,
Giessenbachstrasse 1,
85748
Garching bei München,
Germany
4
Excellence Cluster Universe, Boltzmannstrasse 2, 85748
Garching bei München,
Germany
5
INAF–Osservatorio Astrofisico di Arcetri,
Largo Enrico Fermi 5,
50125
Firenze,
Italy
6
Department of Physics, University of Zagreb,
Bijenička cesta 32,
10000
Zagreb,
Croatia
7
INAF–Osservatorio Astronomico di Roma,
via Frascati 33, 00044
Monte Porzio Catone ( RM), Italy
8
AIM, Unité Mixte de Recherche CEA CNRS, Université Paris VII, UMR
n158, 75014
Paris,
France
9
European Southern Observatory, Karl-Schwarzschild-str. 2, 85748
Garching bei München,
Germany
10
Observatório do Valongo, Universidade Federal do Rio de
Janeiro, Ladeira do Pedro Antônio
43, Saúde, Rio de
Janeiro, RJ
20080-090,
Brazil
Received:
6
July
2015
Accepted:
18
August
2015
Aims. We present new data for four candidate obscured Compton-Thick (CT) quasars at z ~ 1–2.5 observed with the SINFONI VLT spectrograph in adaptive optics (AO) mode. These sources were selected from a 24 μm Spitzer MIPS survey of the COSMOS field, on the basis of red mid-infrared to optical and optical to near-infrared colours, with the intention of identifying active galactic nuclei (AGNs) in dust enshrouded environments, where most of the black hole mass is assembled.
Methods. Near-infrared spectra were analysed to check for emission line features and to search for broad components in the [OIII]-Hβ and Hα-[NII] regions. We also employed X-ray spectral analysis, radio and MIR diagnostics, and SED fitting to study the nature of the sources.
Results. We successfully identified three objects for which we had only a photometric redshift estimate. Based on their emission line diagnostics and on ancillary multi-wavelength constraints, we find that all four targets harbour obscured AGNs. Broad profiles, which could be attributed to the effects of outflows, are revealed in only one target, MIRO20581. In particular, we clearly resolved a fast (~1600 km s-1) and extended (~5 kpc) outflow in the [OIII]5007 emission line. This feature, the commonly used indicator for ionised outflowing gas, was only sampled and detected for this target; hence, we cannot exclude the presence of outflows in the other sources. Overall, the constraints we obtain from our targets and from other comparative samples from the literature suggest that these optically faint luminous infrared galaxies, hosting obscured AGNs, may represent a brief evolutionary phase between the post-merger starburst and the unobscured quasar phases.
Key words: Galaxy: evolution / ISM: jets and outflows / quasars: emission lines
© ESO, 2015
1. Introduction
Outflow winds are predicted to be ubiquitous in active galactic nuclei (AGN) systems and are invoked in many co-evolutionary models to link the growth of supermassive black holes (BH) and galaxies through feedback phenomena. These models predict an obscured phase for young recently ignited quasars (QSOs), triggered by the funnelling of a large amount of gas into the nuclear region during major galaxy mergers (e.g. Menci et al. 2008; Hopkins et al. 2008). Roughly at the same time, this amount of gas is also responsible for vigorous star formation activity. This initial phase is followed by a transitional phase, the so-called feedback or blow-out phase (Hopkins et al. 2008), in which the gas is cleared out through outflowing winds released by the BH before becoming a normal unobscured QSO.
In the framework described above, during the obscured phase, the BH is expected to accrete mass very rapidly, implying a vigorous, although obscured, X-ray emission. In the AGN census, X-ray surveys have been extensively used to probe the assembly and growth of BH at high redshift. In particular, since the X-ray flux is less attenuated than the optical flux, selection criteria based on high X-ray to optical flux ratio (fx/fO) have been used to select obscured sources at z ~ 1–2. Several studies (e.g. Fiore et al. 2003; Mignoli et al. 2004; Alexander et al. 2002; Del Moro et al. 2009; Della Ceca et al. 2015) have found that sources with high fx/fO are characterised, on average, by red optical to near-infrared colours (R − KVega> 5) and column densities in the X-ray of the order of 1021−23 cm-2. Moreover, VLT X-Shooter (Brusa et al. 2015; Perna et al. 2015) and SINFONI (Cresci et al. 2015) observations of a small subsample of obscured QSOs at z ~ 1.5, selected on the basis of their observed red colours and high fx/fO ratio, have confirmed the presence of ionised outflowing material in 75% of objects and a dust-reddened type 1 nature. These objects appear similar to infrared bright (KVega ≤ 16) dust-reddened Type 1 QSOs selected by combining radio with near-infrared (NIR) and optical catalogues at lower redshift (z ≲ 1; Glikman et al. 2004, 2007). Studying a subsample of 13 objects, with strongly disturbed morphology, Urrutia et al. (2012) found that ~60% of these radio-detected sources show evidence for outflow in the [OIII]5007 line profile (see also Brusa et al. 2015).
However, each selection technique biases the samples towards particular properties and, chiefly, may bias the characterisation of the outflows (see Brusa et al. 2015, for details); to test co-evolutionary models, we need to select and isolate different populations of quasars in the different phases of the AGN to galaxy co-evolution, including the initial Compton-thick (CT1) phase.
Since most of the absorbed AGN energy is re-emitted in the mid-infrared (MIR), surveys at these wavelengths can potentially recover the elusive obscured accretion missed by X-ray surveys (e.g. Brandt & Alexander 2015). Several criteria based on the MIR emission of high-z sources have been introduced in recent years to search for heavily obscured AGNs at z ~ 1–3, and have been applied on Spitzer MIPS observations in multi-wavelength survey fields. Typically, the criteria involve the selection of objects with MIR luminosities typical of AGN, but with faint optical or near-infrared emission (e.g. Martínez-Sansigre et al. 2005; Fiore et al. 2008, 2009; Dey et al. 2008; Riguccini et al. 2015).
For example, Fiore et al. (2009) used the MIPS 24 μm COSMOS catalogue (Sanders et al. 2007) to select a sample of ~60 candidate obscured AGN/CT QSOs characterised by extreme mid-infrared to optical flux ratio (f24 μm/fR> 1000) in the area covered by the C-COSMOS Chandra survey (Elvis et al. 2009; Civano et al. 2012). They coupled this selection with a red colour (R − K)Vega> 4.5 cut, which is able to efficiently pick up objects at the redshift of interest (z ~ 1–3). To test the efficiency of the selection, they stacked the Chandra images at the position of the MIPS sources without a direct X-ray detection and recovered a hardness ratio (HR) in the stacking signal larger than that measured for less extreme sources (f24 μm/fR< 1000 and/or (R − K) < 4.5). Still, these sources, with f24 μm/fR> 1000, exhibit evidence of both star formation and AGN activity, and there are contradicting conclusions about how many of the sources selected in this way are actually obscured AGN at z ~ 1–3, rather than dusty star-forming objects (e.g. Donley et al. 2008; Fiore et al. 2009; Dey et al. 2008).
In this paper we present new SINFONI observations, assisted with adaptive optics (AO), for a sample of four luminous, highly obscured QSOs in the COSMOS field, selected on the basis of their high mid-infrared to optical flux ratios (MIR/O) and red R − K colours. Given the tight positive correlation between the f24 μm/fR and the fx/fO ratios found for sources with column density of the order of 1022−23 cm-2 (see Fiore et al. 2008, Fig. 2), Fiore et al. (2008) suggested that luminous highly obscured AGNs, which are faint in the X-ray because of high column densities, i.e. NH ≳ 1023 − 24 cm-2, and cannot be selected using their X/O ratio, can be recovered using their MIR/O ratio. Therefore, potentially, in the framework previously described, we may be able to select sources in the prelude, or at the beginning, of the blow-out phase.
In the following, we refer to these sources as MIRO targets, as per their high MIR/O flux ratio, and using their MIPS catalogue ID from the COSMOS Spitzer catalogue (Le Floc’h et al. 2009). The main aim of the SINFONI observations, besides the spectroscopic determination of the redshifts of the targets, is to compare the physical properties of the sources selected in different ways (MIR/O vs. X/O) and assess the presence of ionised outflows and broad features. Targets selected with a simple MIR/O ratio cut are usually known in the literature as dust-obscured galaxies (DOGs, Dey et al. 2008; see also Riguccini et al. 2011, 2015, for a complete discussion on the DOGs population in COSMOS). In the last section, we compare our results with a compilation of a few DOGs sharing similar properties, e.g. redshift and 24 μm flux.
The paper is organised as follows: Sect. 2 presents the sample selection and the ancillary data collected for our MIRO targets; Sect. 3 outlines the VLT observations and data reduction; Sect. 4 exposes the spectroscopic analysis. Section 5 presents proof of ionised outflowing material in the X-ray source MIRO20581 and discusses the energetic output associated with the outflow and, finally, we summarise our results and the implications in Sect. 6. Throughout the paper, we adopt the cosmological parameters H0 = 70 km s-1, ΩM = 0.3 and Ωλ = 0.7 (Sperger et al. 2003). We adopt a Chabrier initial mass function to derive stellar masses and star formation rates (SFRs).
2. Sample selection
Figure 1 shows the mid-infrared to optical flux ratio f24 μm/fR versus the (R − K) colour diagnostics diagram proposed in Fiore et al. (2008), applied to the MIPS-selected sources in the COSMOS field (Fiore et al. 2009). The green isodensity contours show the distribution of the full sample of MIPS-selected sources in the COSMOS GO3 data (Le Floc’h et al. 2009) and with associated optical and K-band counterparts (~15 000 sources), while the black crosses are the sources detected at fluxes larger than 1 mJy at 24 μm (~550). The box in the top right corner in the colour-colour space, delimited by vertical solid line and horizontal dashed line, marks the region where CT AGN are expected in more than 60% of the MIPS-selected sources (cell A in Fiore et al. 2009). All the sources above the horizontal dashed line are instead usually referred to as DOGs in the literature.
From the Le Floc’h et al. (2009) MIPS selected sample, using SINFONI-NGS mode, we observed five targets marked as yellow stars in Fig. 1 and listed in Table 1, with the fluxes in the R − ,K −, and MIPS 24 μm band used for the selection. Three out of five are classified as DOGs (MIRO10561, MIRO28704, MIRO20581) and two out of five are also in Cell A of Fiore et al. (2009; MIRO10561, MIRO28704)2. The main selection criteria, in addition to the high MIPS/O fluxes and red R − K colour, were the proximity to a bright AO star and a photometric redshift broadly in the range z ~ 1–3 so that rest-frame optical lines are redshifted in the SINFONI J,H, or K filters (four targets). In addition, for only one source (MIRO18744) a spectroscopic redshift was available from the IMACS/Magellan follow-up of X-ray sources in the COSMOS field (Trump et al. 2007), and we proposed to observe its Hα + [NII] region with SINFONI (J-band).
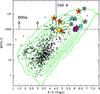 |
Fig. 1 f24 μm/fR as a function of R − K colour for all the COSMOS 24 μm sources associated with the optical and K-band counterparts (green isodensity contours). Black crosses represent the 1 mJy flux-limited sample. Yellow stars denote the five objects observed with SINFONI; cyan stars and squares denote Melbourne et al. (2011) and Brand et al. (2007) targets, respectively (two targets present in both samples are indicated with stars); blue symbols denote the Perna et al. (2015) targets. Star and square symbols indicate IFU and long-slit observations, respectively. Sources marked with red circles are also detected in the 1 mJy flux limited sample and are those considered for the analysis. The box delimited by a vertical solid line and horizontal dashed line marks the region proposed in Fiore et al. (2009) to select CT AGN (Cell A). The horizontal dashed line sets the criterion for the selection of DOGS. |
In Fig. 1 we also show the z ~ 2 DOGs presented in Melbourne et al. (2011; cyan stars) and in Brand et al. (2007; cyan squares) for which K-band magnitude is available, and the z ~ 1.5 dust-reddened type 1 sources presented in Perna et al. (2015; blue symbols). The properties of these targets are discussed in Sect. 6, in order to compare our results with those previously reported in literature.
The ACS (3″ × 3″), R-band, K-band, IRAC3.6 μm, and MIPS (15″ × 15″) cutouts3 of the five targets are shown in Fig. 2. We also included the IRAC 3.6 μm cutout to verify blending problems in the MIPS emission: for all but MIRO18433, we can safely say that the majority of the emission at 24 micron is correctly associated with the K-band and optical counterpart (e.g. our SINFONI targets), and that the observed colours do not suffer from bad photometry. MIRO18744 may show evidence for an ongoing merger: tidal tails and double nuclei are distinguishable in the ACS cutout. MIRO18433, instead, presents two components in the ACS cutout (last row of Fig. 2), which are strongly blended at optical and infrared wavelengths and preclude an accurate SED fitting decomposition and a correct photometric redshift derivation. Indeed, MIRO18433 is the only source for which no spectral features have been detected in the SINFONI HK-band in two hour observations (see Table 1). Moreover, MIRO18433 is the only source below the 1mJy flux limited sample (red circles in Fig. 1). For all the above reasons, MIRO18433 was excluded from the subsequent analysis.
MIRO/SINFONI sample: selection properties and log file of observations.
2.1. Identikit via ancillary data
Previous works (e.g. Alexander et al. 2002; Donley et al. 2008) have demonstrated that red optical to near-infrared colours and high MIR-optical ratios can identify both AGN and star-forming galaxies. In the following, we briefly discuss the multi-wavelength properties of the SINFONI targets to assess which one among SF or AGN activity is the dominating process. We note however that all four of our targets have f24 μm> 1 mJy, and that the 24 μm emission is, on average, increasingly dominated by AGN contribution at higher f24 μm (e.g. Brand et al. 2006; Dey et al. 2008). In the subsequent analysis (e.g. X-ray and SED fits), we made use of the spectroscopic redshift obtained from our SINFONI observations.
-
1.
MIR-X-ray diagnostics. The AGN intrinsic hardX-ray luminosity and the infrared luminosity re-emitted by the torus follow a tight correlation (Lutzet al. 2004; Gandhiet al. 2009).Figure 3 shows the distribu-tion of rest-frame observed X-ray luminosity(
 ) vs.
L5.8
μm for several samples of CT candidate
AGN4 collected by Lanzuisi et al. 2015a (with the addition of XMM ID 5371; Civano et al. 2015) and for our MIRO targets (red
diamonds). For all of the sources, the rest-frame 5.8 μm luminosities were
obtained using a simple power-law interpolation between the 24 and 8 μm observed-frame
luminosities. We computed the X-ray luminosities on the basis of the available XMM
and Chandra data in the COSMOS field. More specifically, MIRO20581
and MIRO18744 are both detected in the X-rays, in the XMM-COSMOS (XID70135 and
XID60205: Cappelluti et al. 2007; Brusa et al. 2010) and C-COSMOS (CID451 and
CID401; Civano et al. 2012) surveys, while MIRO10561 is detected in the deeper
COSMOS-Legacy survey (CID 3587 in the Civano et al. 2015 catalogue and Marchesi et
al., in prep.). The remaining source, MIRO28704, is instead undetected down to a
luminosity of log (LX) ~ 42.8 in the
2–10 keV band.
) vs.
L5.8
μm for several samples of CT candidate
AGN4 collected by Lanzuisi et al. 2015a (with the addition of XMM ID 5371; Civano et al. 2015) and for our MIRO targets (red
diamonds). For all of the sources, the rest-frame 5.8 μm luminosities were
obtained using a simple power-law interpolation between the 24 and 8 μm observed-frame
luminosities. We computed the X-ray luminosities on the basis of the available XMM
and Chandra data in the COSMOS field. More specifically, MIRO20581
and MIRO18744 are both detected in the X-rays, in the XMM-COSMOS (XID70135 and
XID60205: Cappelluti et al. 2007; Brusa et al. 2010) and C-COSMOS (CID451 and
CID401; Civano et al. 2012) surveys, while MIRO10561 is detected in the deeper
COSMOS-Legacy survey (CID 3587 in the Civano et al. 2015 catalogue and Marchesi et
al., in prep.). The remaining source, MIRO28704, is instead undetected down to a
luminosity of log (LX) ~ 42.8 in the
2–10 keV band. 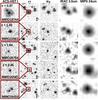
Fig. 2 From left to right: ACS-HST I, r+ Subaru, Ks COSMOS, IRAC 3.6 μm, MIPS 24 μm band cutouts of the five MIRO targets. The target name, position, cutouts scale, and redshift derived from the SINFONI data are also labelled. For display purposes, 3′′× 3′′ ACS-HST cutouts show the regions in the red boxes superimposed on the r+ cutouts.
The Lutz et al. (2004; green shaded area) and Fiore et al. (2009; orange solid line) relations represent the tight X-ray to mid-IR correlations found for the low- and high-redshift (z> 1) unobscured AGN, respectively. The Lutz et al. (2004) relation has also been confirmed recently at higher redshift by Mateos et al. (2015). These relations, however, have been calibrated at low luminosities, and require extrapolations to high luminosities (i.e. log (λLλ(5.8 μm)) > 46). A flattening of the MIR-Xray relation at the highest luminosities has been found by the recent work of Stern (2015). Assuming that both the hard X-ray and the infrared luminosities are related to the AGN activity (see below; Fig. 5), and given that the mid-IR is largely independent of obscuration, a lower LX to L5.8 ratio with respect to that observed for unobscured AGN suggests that the observed LX are affected by obscuration (e.g. Stern et al. 2014). All the MIRO sources lie below these relations at values consistent with a heavily obscured absorber: the long- (short-) dashed line in Fig. 3 marks the NH = 1024 (1023) cm-2 locus, computed from the Fiore et al. relation. Therefore, the NH loci in the figure are computed with the most conservative approach: using the Lutz et al. relation, the dashed lines would be steeper than those obtained from the Fiore et al. Therefore, the intrinsic X-ray luminosity would be larger and, as a consequence, the NH needed to explain the observed luminosities of the MIRO targets would also be larger.
-
2.
X-ray spectra. The X-ray spectra of the three X-ray detected MIR/O are shown in Fig. 4. Given the low photon statistics available for all the detected sources (in the range 20–150 net counts) we applied the Cstat statistic (Cash 1979) to the unbinned data and assumed a very simple model to recover a rough estimate of the nuclear obscuration and instrinsic luminosity: a power-law with photon index fixed to Γ = 1.9 plus obscuration at the source redshift (plus galactic NH). In the XMM-detected sources, a second component is required by the data to model the soft emission. Indeed, as demonstrated in Lanzuisi et al. (2015a), given the complexity of the X-ray emission and the concurrent presence of other processes, such as scattering components or emission from star formation, heavily obscured AGN can be missed when fitting low-counting statistics data compatible with a single power-law model (see also Lanzuisi et al. 2015b). For all these sources we derived column density of NH ≈ 2.5–7 × 1023 cm-2 with high uncertainties (see Table 2). Although they are characterised by a high obscuration, the X-ray detected sources are not in the Compton Thick regime, as expected given current X-ray surveys limits and sensitivities, which is consistent with previous works (e.g. Lanzuisi et al. 2009; Georgakakis et al. 2010). The rest-frame intrinsic X-ray luminosities are also listed in Table 2. The most luminous of the three sources is MIRO20581 with an X-ray luminosity ~1045 erg s-1, while the other two sources have inferred intrinsic luminosities slightly below 1044 erg s-1. These luminosities exceed of about 2 dex those expected from stellar processes given the observed SFR (see below).
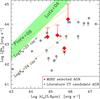
Fig. 3 Log(
 )
vs. Log (L5.8
μm) for several CT candidates.
Grey circles represent literature CT candidate AGN (see Lanzuisi et al. 2015a, for more details). Red diamonds
represent our MIRO targets; intrinsic X-ray luminosities of the X-ray detected
objects are also indicated with upper bars. The green shaded area is the
relation of Lutz et al. (2004) for a sample of low-redshift, unobscured AGN.
The orange solid line is the relation for high-redshift unobscured AGN (Fiore
et al. 2009), while the dashed and long dashed lines are the expected relation
for a 1023 cm-2 and 1024 cm-2 absorber.
)
vs. Log (L5.8
μm) for several CT candidates.
Grey circles represent literature CT candidate AGN (see Lanzuisi et al. 2015a, for more details). Red diamonds
represent our MIRO targets; intrinsic X-ray luminosities of the X-ray detected
objects are also indicated with upper bars. The green shaded area is the
relation of Lutz et al. (2004) for a sample of low-redshift, unobscured AGN.
The orange solid line is the relation for high-redshift unobscured AGN (Fiore
et al. 2009), while the dashed and long dashed lines are the expected relation
for a 1023 cm-2 and 1024 cm-2 absorber.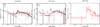
Fig. 4 X-ray spectra of MIRO20581 (left), MIRO18744 (centre) from XMM and Chandra, and MIRO10561 (right) from Chandra. The XMM (black) and Chandra (red) data of MIRO20581 and MIRO18744 are fitted with a double power law (as shown in the model components). The MIRO10561 Chandra data are instead fit with a single absorbed power law.
Table 2MIRO/SINFONI sample: main properties.
-
3.
SED fitting: Fig. 5 shows the SED fitting decomposition of the four targets considered in the paper, which were obtained making use of a modified version of the magphys code (da Cunha et al. 2008) designed to take into account a possible AGN emission component (Berta et al. 2013) and a modestly absorbed galaxy component. These targets have stellar mass M∗ in the range 0.6–2 × 10¹¹M⊙ and SFR of 10–100 M⊙/yr, and are in (or below) the main sequence (MS) of star-forming galaxies (see Whitaker et al. 2012), as suggested by their starbustiness, RSB = sSFR/sSRFMS,z (see Table 2). For two sources, MIRO20581 and MIRO28704, the far-infrared emission is not well constrained (see Fig. 5), hence, in the table SFR and RSB upper limits are also reported (in parentheses); these values were computed treating the FIR upper limits as real detections.
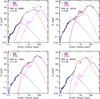
Fig. 5 SED fitting of MIRO targets. The black dots represent the observed data points (in each panel, from left to right: Subaru U,B,g,V,r,i,z; VISTA Y,J,H, and Ks; the four Spitzer IRAC bands, Spitzer MIPS24; Hershel PACS, and SPIRE). The blue line shows the integrated extincted emission originating from the host galaxy. The magenta line represents the star formation contribution for dust absorption, partially redistributed across the MIR/FIR range in a self-consistent way (da Cunha et al. 2008; Berta et al. 2013; Delvecchio et al. 2014). The red line reproduces the AGN contribution and incorporates both the accretion disc and torus emission. The black solid line represents the sum of all components.
In all cases the (observer frame) NIR emission is dominated by the host galaxy light and the AGN disk component suffers considerably extinction (E(B − V) = 2–4). According to the SED fitting decomposition, the 5.8 μm luminosity is dominated by the torus emission (
 ), in agreement with the
results from the bright DOG sample presented in Riguccini et al. (2015). This also confirm that the X-ray to mid-IR
diagnostic discussed above is a reliable instrument to test the X-ray obscuration of
the MIRO targets. According to the criteria in Dey
et al. (2008), who classified dust-obscured galaxies in AGN-dominated
(“power-law” DOGs) and SF-dominated (“bump DOGs”) on the basis of the rest-frame
optical to mid-infrared SED shape (see their Sect. 3.1.2, and their Fig. 5), all four MIRO targets would be classified as
power-law DOGs, although MIRO18744 appears to show intermediate characteristics
between the two classes.
), in agreement with the
results from the bright DOG sample presented in Riguccini et al. (2015). This also confirm that the X-ray to mid-IR
diagnostic discussed above is a reliable instrument to test the X-ray obscuration of
the MIRO targets. According to the criteria in Dey
et al. (2008), who classified dust-obscured galaxies in AGN-dominated
(“power-law” DOGs) and SF-dominated (“bump DOGs”) on the basis of the rest-frame
optical to mid-infrared SED shape (see their Sect. 3.1.2, and their Fig. 5), all four MIRO targets would be classified as
power-law DOGs, although MIRO18744 appears to show intermediate characteristics
between the two classes. -
4.
Radio: all the targets are also detected in the Very Large Array (VLA) observations of the COSMOS field (Schinnerer et al. 2010). Fiore et al. (2009) reported that QSOs selected on the basis of the MIR/O excess at z ~ 1.5 are more radio luminous than unobscured type 1 QSOs of similar luminosity and redshift, when the intrinsic 5.8 μm luminosities are compared (see also Martínez-Sansigre et al. 2005). MIRO20581 is the only radio loud target (q24obs = − 0.6, being q24obs = log (f24 μm/f1.4 GHz); see Bonzini et al. 2013, Fig. 2) in our SINFONI sample, with L1.4 GHz = 4.5 × 1025 W Hz-1. MIRO20581 is also detected in the 3 GHz survey of the COSMOS field (Smolcic et al., in prep.) and is one of the most luminous sources in the Very Long Baseline Array (VLBA) COSMOS catalogue (Herrera-Ruiz et al., in prep.). The Jansky Very Large Array (JVLA) measurements for MIRO20581, at 3 and 1.4 GHz, imply an inverted radio spectral index, which is consistent with a compact radio source rather than with a diffuse star-forming region. Indeed, we derive a SFR a factor of 10–40 larger than the SED fitting estimate for MIRO20581 using the relation between the 1.4 GHz luminosity and the SFR introduced by Condon (1992). Therefore, the radio luminosity is interpreted as due to AGN activity. MIRO18744 and MIRO28704 are also detected in the VLBA catalogue and even in these cases, possible signatures of compact radio cores are present.
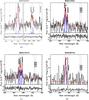
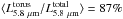
Fig. 6 a) MIRO20581 HK-band spectrum around the [OIII] (left) and the Hα +[NII] complex (right). Superimposed on the spectrum are the best-fit components (solid and dashed blue curves, with arbitrary normalisation to ease the visualisation). The red solid curves represent the sum of all components, including the power law. Dotted lines mark the wavelengths of the Hβ, [OII] doublet, Hα, [NII], and [SII] doublet. b) MIRO10561 H-band integrated spectrum around the Hα +[NII] complex. c) MIRO18744 J-band integrated spectrum around the Hα +[NII] complex. d) MIRO28704 HK-band integrated spectrum around the Hα +[NII] complex. See a) for the description of superimposed curves in b), c), and d) panels. In the bottom panel of each fit, the residuals with respect to the best fit are shown.
-
5.
High ionisation diagnostics: for MIRO18744 a IMACS Magellan spectrum is available (Trump et al. 2007), sampling the rest-frame range 2850–4600 Å. The spectrum shows a prominent [NeV]3425 emission line, an unambiguous sign of obscured nuclear activity (Mignoli et al. 2013; Lanzuisi et al. 2015b).
The main properties of our SINFONI sample discussed above are reported in Table 2, with the targets sorted by decreasing MIPS flux and increasing redshift. Overall, the multi-wavelength constraints we have in our 24 μm bright SINFONI targets suggest unambiguously the presence of obscured AGN activity. These characteristics correspond to those expected for objects caught in the post-merger, dust-enshrouded phase of rapid black hole growth (see e.g. Hopkins et al. 2008; Fiore et al. 2008, 2009).
3. SINFONI observations and data reduction
The observations were obtained in service mode using the near-infrared spectrometer SINFONI of the VLT in AO-assisted mode, during period 92A (from 2013-12-28 to 2014-03-30). All the targets in the sample were observed in one or two of the SINFONI filters (J,H,K, or HK), depending on the initial redshift guess. We note that the program has only been partially executed (~45%) and, therefore, our targets have not been observed with all the requested filters and/or for the entire requested time. We used a field of view (FoV) of 8 × 8′′ in a 2D 64 × 64 spaxel frame. The spectral resolutions are R ~ 1800 for J,R ~ 2900 for H and R ~ 1400 for HK.
We achieved a spatial resolution of 0.2′′ (FWHM) based on the point spread functions (PSF) obtained in natural guide star (NGS) AO-mode, which roughly corresponds to 0.9 kpc at the average redshifts of z = 1.5. This spatial resolution is in agreement with those obtained in other SINFONI AO-assisted observations (e.g. Bouché et al. 2013; Cresci et al. 2009). Our targets do not extend more than ~1–2′′ in diameter, and were therefore observed with on-source dithering in order to use the object exposure with the closest MJD as an approximation of a sky exposure. The information about the observations for each object are shown in Table 1.
Besides the objects of the sample, a set of standard stars and their respective sky frames were also observed to flux calibrate the data. Guide star names are also reported Table 1. The stars have R magnitudes in the range 15 <R< 16.
The data reduction process was performed using ESOREX (version 2.0.5). We used the IDL routine “skysub.pro” (Davies 2007) to remove background sky emission. Then, we used our own IDL routines to perform the flux calibration and to reconstruct a final datacube for each object, adding the different pointings. The flux calibration was performed following the prescription indicated by Piqueras López et al. (2012).
4. Data analysis and spectral fits
Here, we briefly discuss the general data analysis and results of the spectral fits. In the following sections, we describe the more detailed spatially resolved analysis for our best case, MIRO20581.
Emission line properties in the integrated spectra.
Figure 6 shows the one-dimensional integrated spectra, extracted in a 1–2′′ diameter aperture, according to the compactness of the source. All the targets show the Hα + [NII] complex, with the exception of MIRO28704, which has a lower quality spectrum and in which only the Hα5 emission is detected. The only target for which we also detected the [OIII]5007 emission line is MIRO20581. MIRO10561 was observed in the J-band as well, but both [OIII] line and continuum emission were not detected. Instead, [OIII] emission line for the other two targets was not covered because of the incompleteness of the observations (MIRO28704; see Sect. 3) and the wavelength coverage of SINFONI instrument (MIRO18744; [OIII]5007 expected at λobs−frame ≈ 0.986 μm).
We simultaneously fitted each of the emission lines (from only one, Hα in MIRO28704 to a total of six, Hβ, [OIII] doublet, [NII] doublet and Hα, for MIRO20581) with Gaussian line profiles. When more than one emission line is fitted, we constrained the centroids and the line flux ratios according to atomic physics, while the widths were fixed to be the same as each emission line (see Perna et al. 2015).
From the fit described above, we computed spectroscopic redshifts for our targets. We chose as redshift solution the one which produces the best fit of the narrow components of the emission lines. We detected Hα and [NII] emission for MIRO18744 at z = 0.97, consistent with the spectroscopic redshift already available from the Magellan spectrum. For the remaining three sources, we were able to assign, for the first time, a spectroscopic redshift from our line fit (see Col. 13 in Table 1). The spectroscopic redshifts are in general agreement with the photometric estimates available within the COSMOS survey (Salvato et al. 2011; Ilbert et al. 2009), with an accuracy of | zphot − zspec | /(1 + zspec) ≲ 0.1.
The results of the emission line fits are reported in Table 3. To investigate the nature of the ionising source, we investigate the emission line ratios diagnostics [NII]/Hα and [OIII]/Hβ. The only source for which we have both [NII]/Hα and [OIII]/Hβ (MIRO20581) to calculate the BPT diagram (Baldwin et al. 1981) lies in their AGN photoionisation region. For the remaining sources, although with large uncertainties due to low-quality spectra, two out of three also show [NII]/Hα ratios consistent with an AGN origin (Veilleux & Osterbrock 1987), which is consistent with the AGN classification discussed in Sect. 2.1. The diagnostic line ratios are reported in Table 3; lower limit in the [OIII]/Hβ ratios are due to the non-detected Hβ emission line.
Although there is a clear presence of two objects in the ACS-HST image of MIRO18744 (Fig. 2), given the low signal-to-noise (S/N), the SINFONI spectrum is relative to both objects.
5. The ionised outflow in MIRO20581
We now concentrate on MIRO20581. To reproduce the line profiles in the [OIII] and Hα region we had to introduce an extra blueshifted and broad (FWHM ≈ 1600 km s-1) component (see Fig. 6, panel a). Emission from ionised gas in forbidden lines like [OIII] cannot be associated with motion in the broad line region (BLR) because it would be suppressed by collisional de-excitation when produced in high-density regions (see Devereux 2011, for an alternative explanation). For this reason, any broad (>550 km s-1) profile in these forbidden lines is generally interpreted to be ascribed to outflowing ionised gas. Broad Hα profiles may be also ascribed to the presence of an ionised outflowing gas (e.g. Genzel et al. 2014); however, the Hα emission may suffer from severe contamination by the presence of the BLR motion and therefore may be considered less reliable tracer of outflows and the associated energetics. This is especially the case when the high-velocity BLR wings are not detected, as instead, it is the case of Mrk 231, for instance (Rupke & Veilleux 2011).
To investigate the ionised gas emission in MIRO20581 at best, and taking the considerations above into account, we simultaneously fitted the Hβ+[OIII] and Hα+[NII] regions (see Sect. 4 for details) using two approaches. To reproduce the line profiles of all the emission lines, we fitted the two regions
-
1.
with two sets of Gaussian profiles: one to account for thepresence of NLR components (in the following narrowcomponent, NC), withFWHM ≲ 550 km s-1, and one for the presence of outflow components (OC), with FWHM> 550 km s-1;
-
2.
using the same components as above, namely the NC and OC components, and adding a broader profile (FWHM> 1900 km s-1) to account for the presence of the Hα emission originated in the BLR.
The two fits have acceptable low residuals and adequately represent the shape of the line profiles, hence, it is not possible to confirm or exclude the presence of the BLR emission in this source, at least with this S/N. The results of these two approaches are reported in Table 3. If present, the Hα BLR emission would have a FWHM of about 2500–3000 km s-1. The lower value has been obtained fitting the entire Hα+[NII] profile with only one Gaussian. The NII/Hα ratio depends on the detailed modelling but, in both cases, the emission lines remain in the AGN photoionisation region (see previous section).
We performed a tentative fit with two sets of Gaussian profiles, taking only NLR and BLR components into account. This has shown high residuals especially in the [OIII]5007 profile. Figure 7 shows these residuals.
5.1. Spatial analysis
Figure 8, panel a shows the contour plot of the median SINFONI datacube in steps of 1σ starting from 3σ over the entire HK wavelength range (green scale). The standard deviation σ was computed in a 1.25–1.75′′ annulus centred on the target. The astrometry in the SINFONI datacube was performed using the Ks COSMOS cutout, obtaining a match between the coordinates of the peak of intensity in the Ks COSMOS cutout and in the median SINFONI datacube. In Fig. 8a, the Ks COSMOS contours are over-imposed on the SINFONI datacube (cyan solid curves). We also show the HST/ACS F814W contours at higher resolution (magenta curves; see also Fig. 1).
 |
Fig. 7 MIRO20581 residuals in the [OIII] and Hα range obtained by fitting the observed lines with only NLR and BLR components. (See Sect. 5; to be compared to Panel a of Fig. 6.) |
Figure 8, panel b shows the [OIII]5007 map integrated on the continuum-subtracted total line profile (grey scale) with over-imposed contour levels (starting from 3σ) of the emission of the line core (5000–5014 Å; width ~800 km s-1) and of the blueward part (4973–5000 Å; width ~1600 km s-1) of the line profile. Blueshifted emission is found out to a distance of R = 0.6″ (associated with region B), i.e. 4.8 kpc from the nucleus. Instead, the core emission is less extended and could be associated with the narrow component of the [OIII] profile.
5.2. Kinematic analysis
To map the line emission distributions and corresponding velocities, a nuclear and an off-nuclear spectra are extracted from two 3 × 2 spaxel regions (3 × 2 kpc) close to the central and off-nuclear peaks in the [OIII] channel map (Fig. 8, panel b, regions A and B labelled with black boxes; see also Perna et al. 2015; Cresci et al. 2015). In Fig. 8, panel c we show the integrated spectra over the two regions: red and orange solid lines represent the nuclear and off-nuclear line profiles, respectively.
In both cases, the [OIII] profiles are broad, with widths of FWHM = 1400–1200 km s-1, and maximum velocities of 1600–1650 km s-1 (nuclear and off-nuclear spectrum). In the off-nuclear region, the centroid of the emission lines is blueshifted ~700 km s-1.
5.3. Outflow properties
Assuming that the broad and shifted [OIII] component can be associated with an outflowing
wind, the kinetic power ( ) and
mass-outflow rate (
) and
mass-outflow rate ( )
of the outflow can be computed under reasonable assumptions in the case of a biconical
geometry. First of all, given that the electron density of the outflowing gas cannot be
estimated directly from the data because of the low quality of spectra in the [SII] region
(see Fig. 6), and the metallicity indicators (Pettini & Pagel 2004; Yin et al. 2007) are not useful because of the AGN ionising radiation,
we assumed standard values of ne (100 cm-3) and metallicity (solar).
Generally, the Hβ luminosity is used to calculate the total amount of
gas and mass outflow rate (e.g. Liu et al. 2013;
Cresci et al. 2015). However, in our case this
line is not detected, and we have adopted the Cano-Díaz et
al. (2012) formulae, which instead employ the [OIII] line luminosity:
)
of the outflow can be computed under reasonable assumptions in the case of a biconical
geometry. First of all, given that the electron density of the outflowing gas cannot be
estimated directly from the data because of the low quality of spectra in the [SII] region
(see Fig. 6), and the metallicity indicators (Pettini & Pagel 2004; Yin et al. 2007) are not useful because of the AGN ionising radiation,
we assumed standard values of ne (100 cm-3) and metallicity (solar).
Generally, the Hβ luminosity is used to calculate the total amount of
gas and mass outflow rate (e.g. Liu et al. 2013;
Cresci et al. 2015). However, in our case this
line is not detected, and we have adopted the Cano-Díaz et
al. (2012) formulae, which instead employ the [OIII] line luminosity:
![\begin{eqnarray} \label{canodiaz} P_{\rm K}^{\rm ion}&=&5.17\times 10^{43} \frac{{\rm CL}_{44}({\rm [OIII]})v_{{\rm out},3}^3}{n_{\rm e3}~R_{\rm kpc} 10^{\left [ {\rm O/H} \right ]}}~{\rm erg\,s}^{-1}, \\\label{Mcanodiaz} \dot M_{\rm out}^{\rm ion}&=&164\times 10^{43} \frac{{\rm CL}_{44}({\rm [OIII]})v_{{\rm out},3}}{n_{\rm e3}~R_{\rm kpc} 10^{\left [ {\rm O/H} \right ]}}~M_\odot\,{\rm s}^{-1}, \end{eqnarray}](/articles/aa/full_html/2015/11/aa26907-15/aa26907-15-eq138.png) where
L44([OIII]) is the [OIII] luminosity associated with the outflow component in
units of 1044
erg s-1,
ne3 is the electron density in units of
1000 cm-3,
vout,3 is the outflow velocity
vout in unit of 1000 km s-1, C is the condensation factor
(≈1), 10[O/H] is the metallicity in solar
units, and Rkpc is the radius of the outflowing
region in units of kpc. We therefore used the [OIII]5007 flux associated with the outflow
component in the 1′′
integrated spectrum (Fig. 6, panel a). We further
adopted a spatial extension of 4.8 kpc for the outflowing gas given that we observe the
blueward emission out to this distance (see Fig. 8,
panel b; Sect. 5.1). Finally, we considered as outflow velocity the maximum velocity
observed vmax in the nuclear region
(vout =
1600 km s-1; see Sect. 5.2),
and we assumed that lower velocities are due to projection effects (Cano-Díaz et al. 2012; Cresci et al.
2015).
where
L44([OIII]) is the [OIII] luminosity associated with the outflow component in
units of 1044
erg s-1,
ne3 is the electron density in units of
1000 cm-3,
vout,3 is the outflow velocity
vout in unit of 1000 km s-1, C is the condensation factor
(≈1), 10[O/H] is the metallicity in solar
units, and Rkpc is the radius of the outflowing
region in units of kpc. We therefore used the [OIII]5007 flux associated with the outflow
component in the 1′′
integrated spectrum (Fig. 6, panel a). We further
adopted a spatial extension of 4.8 kpc for the outflowing gas given that we observe the
blueward emission out to this distance (see Fig. 8,
panel b; Sect. 5.1). Finally, we considered as outflow velocity the maximum velocity
observed vmax in the nuclear region
(vout =
1600 km s-1; see Sect. 5.2),
and we assumed that lower velocities are due to projection effects (Cano-Díaz et al. 2012; Cresci et al.
2015).
Following the Cano-Díaz et al. formalism, the kinetic power is
 erg s-1, while the outflow mass rate
is
erg s-1, while the outflow mass rate
is  yr-1, consistent with the values
observed for targets at similar bolometric luminosities (Carniani et al. 2015). These equations assume a simplified model in which the
wind occurs in a conical region uniformly filled with outflowing ionised clouds. The
values, not corrected for extinction and only regarding the ionised component of the
outflow (see also the other conservative conditions in Cano-Díaz et al. 2012; and the discussion in Perna et al. 2015, Sect. 6.1), represent lower limits to the total outflow
power.
yr-1, consistent with the values
observed for targets at similar bolometric luminosities (Carniani et al. 2015). These equations assume a simplified model in which the
wind occurs in a conical region uniformly filled with outflowing ionised clouds. The
values, not corrected for extinction and only regarding the ionised component of the
outflow (see also the other conservative conditions in Cano-Díaz et al. 2012; and the discussion in Perna et al. 2015, Sect. 6.1), represent lower limits to the total outflow
power.
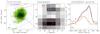 |
Fig. 8 a) MIRO20581 contour plot of the median SINFONI datacube over the entire HK wavelength range (green scale, in steps of 1σ starting from 3σ), with over-imposed the Ks COSMOS (cyan; starting from 3σ, in steps of 3σ) and ACS HST contours (magenta; starting from 3σ, in steps of 3σ). b) [OIII]5007 channel map obtained integrating the continuum-subtracted SINFONI datacube on the total line profile (4973–5024 Å) of the region selected in panel a). The contours levels are in steps of 1σ (starting from 3σ) and show the [OIII] emission coming from the core (5000–5014 Å) and from the bluer (4973–5000 Å) part of the line profile. c) [OIII] line profiles obtained from integrated spectra over the spaxels selected in the two regions A and B in panel b). Vertical dashed lines represent the systemic velocity obtained from the 1″ integrated spectrum. |
The kinetic power is ≈0.4% of
the AGN bolometric luminosity also inferred from the SED fitting decomposition, in rough
agreement with the predictions of AGN feedback models (few % of Lbol, King 20056). The
momentum flux,  is 2 × 1036 dyne, ≈2 times the radiative momentum flux from
the central black hole, Lbol/c. Its momentum
boost, i.e. the ratio between
is 2 × 1036 dyne, ≈2 times the radiative momentum flux from
the central black hole, Lbol/c. Its momentum
boost, i.e. the ratio between  and Lbol/c is in agreement
with those observed in X-ray winds (e.g. Tombesi et al.
2015), rather than with the ratios associated with ionised and/or molecular
outflows (e.g. Cicone et al. 2014; Perna et al. 2015). This discrepancy however, could be
totally attributed to the fact that our estimate of the momentum flux represents a lower
limit. In fact, correcting the [OIII] luminosity for an E(B − V) =
1.3 calculated from the SED fitting decomposition7, we obtain a mass outflow rate a factor of ~10 larger (~2000 M⊙/yr).
Consequently, we obtain a momentum flux and momentum boost in more reasonable agreement
with the results reported in the literature (namely: a momentum boost 20 times
Lbol/c, a kinetic power
≈4% Lbol/c) and favouring an
“energy-conserving” nature of the observed large-scale ionised outflow (see e.g. Carniani et al. 2015, and references therein).
and Lbol/c is in agreement
with those observed in X-ray winds (e.g. Tombesi et al.
2015), rather than with the ratios associated with ionised and/or molecular
outflows (e.g. Cicone et al. 2014; Perna et al. 2015). This discrepancy however, could be
totally attributed to the fact that our estimate of the momentum flux represents a lower
limit. In fact, correcting the [OIII] luminosity for an E(B − V) =
1.3 calculated from the SED fitting decomposition7, we obtain a mass outflow rate a factor of ~10 larger (~2000 M⊙/yr).
Consequently, we obtain a momentum flux and momentum boost in more reasonable agreement
with the results reported in the literature (namely: a momentum boost 20 times
Lbol/c, a kinetic power
≈4% Lbol/c) and favouring an
“energy-conserving” nature of the observed large-scale ionised outflow (see e.g. Carniani et al. 2015, and references therein).
However, these results are based on few assumptions whose contributions are worth noting. Estimates of the electron density of outflowing region have been obtained in few low-z AGN and ultra-luminous infrared galaxies (e.g. Villar-Martín et al. 2014; Rodríguez-Zaurín et al. 2013) and high-z QSOs (e.g. Perna et al. 2015; Brusa et al., in prep.) with values between 102 and 103 cm-3. Although the value we used in Eqs. (1) and (2) is routinely used in the literature (e.g. Liu et al. 2013; Harrison et al. 2014; Cresci et al. 2015), outflow energetics may be a factor of 10 lower if ne = 103 cm-3 is adopted. A further factor of 1/2 should be considered, taking the assumption on the metallicity into account, if metal-rich regions are present (see Perna et al. 2015). Finally, we considered a reddening value in between the E(B − V) estimated for the AGN and galaxy components (see Table 2). Considering the AGN (galaxy) reddening E(B − V) estimate instead of the average, the [OIII]5007 flux and therefore all the energetics should be corrected by a factor of 100 (5). However, all of the basic assumptions previously outlined are in agreement with those adopted in similar studies in the literature and, in the case of the reddening value, reasonable. For completeness, we report in Table 4 all the energetic values with ranges obtained minimising and maximising the Eqs. (1) and (2), using all the possible alternative assumptions above described.
MIRO20581 outflow energetics.
6. Discussion
We analysed the NIR SINFONI spectra of four candidate obscured QSOs, selected from the COSMOS survey on the basis of red mid-infrared to optical and optical to near-infrared colours.
Broad profiles in the [OIII] and Hα lines with FHWM> 550 km s-1 (OC component), which are commonly used as signposts of outflows, have only been detected in one source, MIRO20581. We cannot exclude the presence of faint OC components in the other sources, given the low quality of the spectra and lack of the [OIII]5007 emission, which is a better optical tracer for outflows. Overall, the integrated spectra of the other three sources have low S/N (with emission lines detected at ~3σ) and faint outflow components in the Hα+[NII] could still be present. Alternatively, the high obscuration of the sample, as established via the SED decomposition, the X-ray spectra, and the X-ray to mid-IR ratios (see Sect. 2.1), might suggest that these sources are in the rapid black hole growth phase, an epoch at which the scaling relations between host galaxies and black hole properties are not yet established and winds have not yet been launched (King 2005). If it is the case, MIRO20581 is different from these other three sources. We investigate this scenario in the following section.
6.1. Comparison with literature
In this section, we compare the properties of our MIRO targets with those of a sample of AGN-dominated DOGs reported in the literature and discuss their main similarities and differences. Several studies have shown that DOGs with large f24 μm flux (≳1 mJy) exhibit higher AGN activity, higher concentration, and smaller physical size. Vice versa, DOGs with lower f24 μm exhibit higher SF activity and larger physical size (Melbourne et al. 2011; Riguccini et al. 2015). Although it is shown that the rest-frame optical morphologies of the most luminous DOGs have little sign of ongoing mergers (Melbourne et al. 2008, 2009; Bussmann et al. 2009), there are also indications of non-regular gas kinematics in their host galaxies (Melbourne et al. 2011) and, moreover, several arguments suggest that they could be post-merger products of gas-rich mergers (see e.g. Melbourne et al. 2009). Merger simulations were able to reproduce their colours and luminosities and indicate an infrared to optical drop as gas consumption and AGN-driven wind terminate both SF and BH growth (Narayanan et al. 2010).
Brand et al. (2007) studied NIR Keck spectra of a sample of ten AGN-dominated DOGs selected in the 9 deg2 NOAO Deep Wide-Field Survey Boötes field (Jannuzi & Dey 1999). Most of their spectra have low S/N and it is not possible to rule out the presence of outflows in the observed emission lines, but a prominent broad (FWHM ~ 1600 km s-1) [OIII]5007 profile was detected in one target, SST24 J1428+34. Hα or Hβ BLR have been found in 70% of them. Melbourne et al. (2011) instead presented a sample of four AGN-dominated DOGs with high spatial resolution Keck OSIRIS integral field spectroscopy. The sources were also selected in the Boötes field and the main selection criteria was the strong Hα BLR detection in available NIR spectroscopic observations (e.g. from the same Brand et al. 2007, sample). They found that the BH masses of their sample are small for their host galaxy luminosities when compared with z ~ 2 and local unobscured AGNs (see their Sect. 5.1). Indeed, they did not find any evidence of outflows in the hosts, which corresponds with the above-cited predictions of King (2005). They also reported SFRs < 100 M⊙ yr-1 for all targets. Finally, the Brusa et al. (2015) sample has been selected on the basis of red R − K colours (with a cut at KAB< 19), and high X/O ratio. The latter selection criterion is roughly equivalent to the high MIR/O ratio (see Fiore et al. 2008). To confirm this, we added the two brightest sources (XID2028 and XID5321; Perna et al. 2015) in the Brusa et al. (2015) sample in Fig. 1 (with blue star and square), as representative of the entire sample. Evidence of outflows have been found in 75% of objects and a similar percentage of BLR emissions have been found.
Overall, all these sources have similar colours and MIR/O ratios to those of our MIRO targets (see Fig. 1; cyan stars and squares represent the sources in Melbourne et al. (2011) and Brand et al. (2007) samples with K-band measurement). While BLR emission may be present only in one out four of our targets (MIRO20581; see Sect. 5), a large number of Brusa et al. (2015), Melbourne et al. (2011), and Brand et al. (2007) obscured QSOs exhibit BLR emission. However, as already mentioned, the Melbourne et al. (2011) targets were preselected to have a strong Hα detection and, in general, all the targets in these three comparative samples have strong K-band emission (KAB ≲ 20): the Brusa et al. (2015) sample has been selected requiring a KAB< 19; the Boötes field from which the Melbourne et al. (2011) and Brand et al. (2007) DOGs were selected, has considerably shallower NIR observations than the COSMOS field (KAB< 23, McCracken et al. 2010; KAB< 20.8, Dey et al. 2008, respectively). On the contrary, for the observations proposed in this work, we did not impose any flux threshold. Hence, it seems that the presence of BLR emission is related to the K-band flux. This offers a possible interpretation. All these targets are AGN-dominated DOGs at z ~ 2; therefore, an higher K-band flux may correspond to a higher rest-frame optical AGN continuum emission, which is proper of AGN showing BLR emission. Vice versa, our sample, with KAB ≳ 20, is dominated by rest-frame optical host-galaxy continuum emission (see Fig. 5). The X-ray absorption is fully consistent with type 2 (1.9 in the case of MIRO20581) classification obtained by the SINFONI spectra.
The only object in which we detected the outflow, MIRO201581, stands out with respect to the other targets. Although sharing the same X-ray luminosities of the Brusa et al. (2015) targets, the X-ray spectrum of MIRO20581 shows a high column density (NH ≈ 7 × 1023 cm-2) that is larger than those observed for the X/O targets (NH ≈ 1021.6 cm-2, Perna et al. 2015). This difference may be attributed mainly to line of sight effects, which intersect a larger portion of the torus in MIRO20581 with respect to the Perna et al. (2015) targets, and would also explain the fact that we do not detect a dominant BLR component in the Hα in MIRO20581. Alternatively, the high extinction seen in the SED in both the AGN and host-galaxy components may be related to large scales obscurations.
Assuming that the Hα+[NII] complex of MIRO20581 is composed of NC, OC, and a BLR component, its black hole mass can be estimated using the Bongiorno et al. (2014) formula, assuming a FWHM of the Hα BLR emission of 3000 km s-1 (see Sect. 5), log (MBH/M⊙) = 8.4. Considering the stellar mass estimated by SED fitting decomposition (log (M∗/M⊙) = 11), we measure a central black hole to stellar mass ratio of the host of ~0.002, comparable with the ratios of unobscured QSO at the same redshift (Bongiorno et al. 2014; Merloni et al. 2010). Hence, it seems that outflows are present only in sources for which the MBH − M∗ relation has been fixed, in agreement with the predictions of King (2005).
From the comparison between Lbol (Table 2) and the Eddington luminosity associated with the MBH, we also infer a high Eddington ratio (Lbol/LEdd ~ 1). All these properties (high Eddington ratio, high extinction, MBH/M∗ ~ 0.002) point towards the interpretation that MIRO20581 could be associated with the beginning of the blow-out phase. On the other hand, its SFR and starbustiness are low (but still within ±0.6 dex of the MS; see Table 2), indicating perhaps an advanced state of the ongoing process of negative feedback (see also Balmaverde et al. 2015). We underline that its FIR emission is not well constrained (see Fig. 5); hence we calculated as upper limit a SFR = 132 M⊙/yr, treating the FIR upper limits as real detections. A higher SFR, and consequently a higher sSFR, may be more consistent with the beginning of a blow-out phase in which the effects of feedback are still marginal and the SF is still occurring.
In the Narayanan et al. (2010) simulations, AGN-dominated DOGs appear after the peak of the star formation, and therefore not necessarily associated with Starburst phase, given that the time scales of the two processes are not the same. Indeed, results recently presented in Riguccini et al. (2015) showed that 50% of AGN-dominated DOGs detected by Herschel display sSFRs that place them in or above the MS, while the remaining 50% are below the MS, indicating perhaps an ongoing quenching of the star formation due to the AGN activity. In this scenario, small SFRs observed in dust-obscured, massive main-sequence galaxies hosting AGNs, such those of MIRO10561, MIRO28704, MIRO18744, and those presented in Melbourne et al. (2011), may be associated with systems that are still actively growing their black holes.
7. Summary
The main results from the multi-wavelength analysis and the SINFONI data on the small sample of mid-infrared bright, red quasars we present here are as follows. All the sources but MIRO28704, selected from the 24 μmSpitzer MIPS survey as candidate obscured QSO, are confirmed highly (NH ≈ 2.5–7 × 1023 cm-2) obscured AGN from our detailed analysis. For MIRO28704, we only found indications of a CT nature (see Sect. 2.1). We successfully provided a spectroscopic redshift for three objects for which we had only a photometric estimate (see Sect. 4). We revealed the presence of a powerful ionised outflow extended out to ~4.8 kpc in only one source, MIRO20581 at z = 2.45. The large velocity (1600 km s-1) and outflow mass rate (2000 M⊙/yr) for MIRO20581 are not sustainable by star formation. The energetics of the outflow are consistent with an energy-conserving mechanism (Sect. 5); the inferred Eddington ratio (λEdd ~ 1), together with its highly obscured nature, point towards the interpretation that this source may be caught in the blow-out phase. We collected several arguments that point towards the fact that luminous (f24 μm> 1 mJy) AGN-dominated DOGs may be objects in the transition phase between the post-merger starburst and unobscured QSO phases. The occurrence of outflows seems to be associated with the end of the rapid BH growth, when the MBH − M∗ relation has been already established (see Sect. 6.1). The efficiency of this mid-infrared to optical and optical to near-infrared colours selection criteria in detecting objects in the blow-out phase may be lower when compared to other selection criteria (e.g. Brusa et al. 2015; Glikman et al. 2007). This may be because higher obscuration could be associated with a still ongoing process of BH growth, preceding the blow-out phase (see Sect. 6). To confirm this statement, however, higher S/N spectra are required. Since MIRO20581 is the only target with outflow and an X-ray luminosity of 1045 erg s-1 (see Sect. 2), we suggest that sources in the blow-out phase can be most efficiently isolated from shallow X-ray surveys rather than solely on their high MIR/O colours (see also Brusa et al. 2015).
In recent years, several detections of AGN-driven outflows on kpc scale, probed by ionised gas kinematics, have been reported in the literature (see Carniani et al. 2015 for an updated compilation), and MIRO20581 is the last addition to this sparse and inhomogeneously assembled sample. Moreover, definitive evidences of the impact of the detected outflows on the host galaxies are still missing. To quantify how common AGN driven outflows are and the impact of the wind in the hosts, NIR IFU AO-assisted observations of large (e.g. several tens) and homogeneously selected (e.g. from X-rays) samples of AGN are needed. We will address these issues in the near future through a SINFONI Large Program, “SUPER” (SINFONI Survey for Unveiling the Physics and the Effect of Radiative feedbacK, PI: V. Mainieri), which will target the first statistically sound sample (~40 AGN and QSOs drawn from the COSMOS, CDFS and SDSS surveys) over four order of magnitudes in bolometric luminosities, and spanning all possible AGN (e.g. NH, Eddington ratio) and hosts (e.g. starburstiness) properties.
At the time of observations, all the targets were selected within the cell A. Differences from the current situation shown in Fig. 1 are due to the fact that we now use an improved version of the COSMOS photometric catalogue (Laigle et al., in prep.) in which the photometry is slightly changed. The colours in the figure are all related to the “total flux” measurements.
The cutouts are extracted from the public COSMOS cutouts page: http://irsa.ipac.caltech.edu/data/COSMOS/index_cutouts.html
The narrow feature at λ ≈ 6584Å is associated with a wrong skyline subtraction. We discard the possibility that the observed line is HeI10830 at z = 0.6. We fitted the SED imposing this redshift. This fit produced a significantly larger Chi square, four times the value obtained imposing z = 1.64. Indeed, at z = 0.6 the source would be undetected down to a luminosity of log (LX) ~ 42.2 in the 2–10 keV band; with a bolometric luminosity estimated by this SED fitting decomposition of log (Lbol) = 45.3, MIRO28704 would have a very unusual bolometric correction of the order of kbol = Lbol/LX> 1000.
This value has been obtained as rough estimate assuming for the outflowing material a reddening value in between the E(B − V) estimated for the AGN and galaxy components (see Table 2). In fact, possible differential obscuration between nuclear and off-nuclear regions may be present.
Acknowledgments
M.P., M.B., and G.L. acknowledge support from the FP7 Career Integration Grant “eEASy” (“SMBH evolution through cosmic time: from current surveys to eROSITA-Euclid AGN Synergies”, CIG 321913). M.B. gratefully acknowledges fundings from the DFG cluster of excellence “Origin and Structure of the Universe” (http://www.universe-cluster.de). We acknowledge financial support from INAF under the contracts PRIN-INAF- 2011 “Black Hole growth and AGN feedback through cosmic time”), from PRIN MIUR 2010-2011 (“The dark Universe and the cosmic evolution of baryons”), and from PRIN-INAF-2014 (“Windy Black Holes combing galaxy evolution”). We gratefully acknowledge the unique contribution of the entire COSMOS collaboration for making their excellent data products publicly available; more information on the COSMOS survey is available at http://www.astro.caltech.edu/~cosmos. We thank Francesca Civano for sharing COSMOS legacy data before publication and for useful comments. We thank the anonymous referee for his/her interest in the results of our work, and useful suggestions that improved the presentation of the results.
References
- Alexander, D. M., Vignali, C., Bauer, F. E., et al. 2002, AJ, 123, A1149 [NASA ADS] [CrossRef] [Google Scholar]
- Baldwin, J. A., Phillips, M. M., & Terlevich, R. 1981, PASP, 93, 5 [NASA ADS] [CrossRef] [EDP Sciences] [Google Scholar]
- Balmaverde, B., Marconi, A., Brusa, M., et al. 2015, A&A, in press, DOI: 10.1051/0004-6361/201526694 [Google Scholar]
- Berta, S., Lutz, D., Santini, P., et al. 2013, A&A, 551, A100 [NASA ADS] [CrossRef] [EDP Sciences] [Google Scholar]
- Bonzini, M., Padovani, P., Mainieri, V., et al. 2013, MNRAS, 436, 3759 [NASA ADS] [CrossRef] [Google Scholar]
- Bongiorno, A., Maiolino, R., Brusa, M., et al. 2014, MNRAS, 443, 2077 [NASA ADS] [CrossRef] [Google Scholar]
- Bouché, N., Murphy, M. T., Kacprzak, G. G., et al. 2013, Science, 341, 50 [NASA ADS] [CrossRef] [Google Scholar]
- Brand, K., Dey, A., Weedman, D., et al. 2006, ApJ, 644, 143 [NASA ADS] [CrossRef] [Google Scholar]
- Brand, K., Dey, A., Desai, V., et al. 2007, ApJ, 663, 204 [NASA ADS] [CrossRef] [Google Scholar]
- Brandt, W. N., & Alexander, D. M. 2015, A&ARv, 23, 1 [Google Scholar]
- Brusa, M., Civano, F., Comastri, A., et al. 2010, ApJ, 716, 348 [NASA ADS] [CrossRef] [Google Scholar]
- Brusa, M., Bongiorno, A., Cresci, G., et al. 2015, MNRAS, 446, 2394 [NASA ADS] [CrossRef] [Google Scholar]
- Bussmann, R. S., Dey, A., Lotz, J., et al. 2009, ApJ, 693, 750 [NASA ADS] [CrossRef] [Google Scholar]
- Cano-Díaz, M. R., Marconi, A., Netzer, H., et al. 2012, A&A, 537, L8 [NASA ADS] [CrossRef] [EDP Sciences] [Google Scholar]
- Cappelluti, N., Hasinger, G., Brusa, M., et al. 2007, ApJS, 172, 341 [NASA ADS] [CrossRef] [Google Scholar]
- Carniani, S., Marconi, A., Maiolino, R., et al. 2015, A&A, 580, A102 [NASA ADS] [CrossRef] [EDP Sciences] [Google Scholar]
- Cash, W. 1979, ApJ, 228, 939 [NASA ADS] [CrossRef] [Google Scholar]
- Cicone, C., Maiolino, R., Sturm, E., et al. 2014, A&A, 562, A21 [NASA ADS] [CrossRef] [EDP Sciences] [Google Scholar]
- Civano, F. 2015, A&AS, 225, 222.06 [Google Scholar]
- Civano, F., Elvis, M., Brusa, M., et al. 2012, ApJS, 201, 30 [NASA ADS] [CrossRef] [Google Scholar]
- Condon, J. J. 1992, ARA&A, 30, 575 [NASA ADS] [CrossRef] [MathSciNet] [Google Scholar]
- Cresci, G., Hicks, E. K. S., Genzel, R., et al. 2009, ApJ, 697, 115 [NASA ADS] [CrossRef] [Google Scholar]
- Cresci, G., Mainieri, V., Brusa, M., et al. 2015, ApJ, 799, 81 [Google Scholar]
- da Cunha, E., Charlot, S., Elbaz, D., et al. 2008, MNRAS, 388, 1595 [NASA ADS] [CrossRef] [Google Scholar]
- Davies, R. I. 2007, MNRAS, 375, 1099 [NASA ADS] [CrossRef] [Google Scholar]
- Della Ceca, R., Carrera, F. J., Caccianiga, A., et al. 2015, MNRAS, 447, 3227 [NASA ADS] [CrossRef] [Google Scholar]
- Del Moro, A., Watson, M. G., Mateos, S., et al. 2009, A&A, 493, 445 [NASA ADS] [CrossRef] [EDP Sciences] [Google Scholar]
- Delvecchio, I., Gruppioni, C., Pozzi, F., et al. 2014, MNRAS, 439, 2736 [NASA ADS] [CrossRef] [Google Scholar]
- Devereux, N. 2011, ApJ, 727, 93 [NASA ADS] [CrossRef] [Google Scholar]
- Dey, A., Soifer, B. T., & Desai, V. 2008, ApJ, 677, 943 [NASA ADS] [CrossRef] [Google Scholar]
- Donley, J. L., Rieke, G. H., Pé rez-Gonzá lez, P. G., & Barro, G. 2008, ApJ, 687, 111 [NASA ADS] [CrossRef] [Google Scholar]
- Elvis, M., Civano, F., Vignali, C., et al. 2009, ApJS, 184, 158 [NASA ADS] [CrossRef] [Google Scholar]
- Fiore, F., Brusa, M., Cocchia, F., et al. 2003, A&A, 409, 79 [NASA ADS] [CrossRef] [EDP Sciences] [Google Scholar]
- Fiore, F., Grazian, A., Santini, P., et al. 2008, ApJ, 672, 94 [NASA ADS] [CrossRef] [Google Scholar]
- Fiore, F., Puccetti, S., Brusa, M., et al. 2009, ApJ, 693, 447 [NASA ADS] [CrossRef] [Google Scholar]
- Gandhi, P., Host, H., Smette, A., et al. 2009, A&A, 502, 457 [NASA ADS] [CrossRef] [EDP Sciences] [Google Scholar]
- Genzel, R., Föerster-Schreiber, N., Rosario, D., et al. 2014, ApJ, 796, 7 [Google Scholar]
- Georgakakis, A., Rowan-Robinson, M., Nandra, K., et al. 2010, MNRAS, 406, 420 [NASA ADS] [CrossRef] [Google Scholar]
- Glikman, E., Gregg, M. D., Lacy, M., et al. 2004, ApJ, 607, 60 [NASA ADS] [CrossRef] [Google Scholar]
- Glikman, E., Helfand, D. J., White, R. L., et al. 2007, ApJ, 667, 673 [NASA ADS] [CrossRef] [Google Scholar]
- Harrison, C. M., Alexander, D. M., Mullaney, J. R., & Swin-bank, A. M. 2014, MNRAS, 441, 3306 [Google Scholar]
- Hopkins, P. F., Hernquist, L., Cox, T. J., & Keres, D. 2008, ApJS, 175, 356 [NASA ADS] [CrossRef] [Google Scholar]
- Ilbert, O., Capak, P., Salvato, M., et al. 2009, ApJ, 690, 1236 [NASA ADS] [CrossRef] [Google Scholar]
- Ivison, R. J., Magnelli, B., Ibar, E., et al. 2010, A&A, 518, A31 [NASA ADS] [CrossRef] [EDP Sciences] [Google Scholar]
- Jannuzi, B. T., & Dey, A. 1999, in ASP Conf. Ser., 191, Photometric Redshifts and the Detection of High Redshift Galaxies (San Francisco: ASP), 111 [Google Scholar]
- King, A. 2005, ApJ, 635, L121 [NASA ADS] [CrossRef] [Google Scholar]
- Lanzuisi, G., Piconcelli, E., Fiore, F., et al. 2009, A&A, 498, 67 [NASA ADS] [CrossRef] [EDP Sciences] [Google Scholar]
- Lanzuisi, G., Ponti, G., Salvato, M., et al. 2014, ApJ, 781, 105 [NASA ADS] [CrossRef] [Google Scholar]
- Lanzuisi, G., Perna, M., Delvecchio, I., et al. 2015a, A&A, 578, A120 [NASA ADS] [CrossRef] [EDP Sciences] [Google Scholar]
- Lanzuisi, G., Ranalli, P., Georgantopoulos, I., et al. 2015b, A&A, 573, A137 [NASA ADS] [CrossRef] [EDP Sciences] [Google Scholar]
- Le Floc’h, E.,Aussel, H., Ilbert, O., et al. 2009, ApJ, 703, 222 [NASA ADS] [CrossRef] [Google Scholar]
- Liu, G., Zakamska, N. L., Greene, J. E., Nesvadba, N., & Liu, X. 2013b, MNRAS, 436, 2576 [NASA ADS] [CrossRef] [Google Scholar]
- Lutz, D., Maiolino, R., Spoon, H. W. W., & Moorwood, A. F. M. 2004, A&A, 418, L465 [NASA ADS] [CrossRef] [EDP Sciences] [Google Scholar]
- Martínez-Sansigre, A., Rawlings, S., & Lacy, M. 2005, Nature, 436, 666 [NASA ADS] [CrossRef] [Google Scholar]
- Mateos, S., Carrera, F. J., Alonso-Herrero, A., et al. 2015, MNRAS, 449, 1422 [NASA ADS] [CrossRef] [Google Scholar]
- McCracken, H. J., Capak, P., Salvato, M., et al. 2010, ApJ, 708, 202 [NASA ADS] [CrossRef] [Google Scholar]
- Melbourne, J., Desai, V., Armus, L., et al. 2008, AJ, 136, 1110 [NASA ADS] [CrossRef] [Google Scholar]
- Melbourne, J., Bussmann, R. S., Brand, K., et al. 2009, AJ, 137, 4854 [NASA ADS] [CrossRef] [Google Scholar]
- Melbourne, J., Peng, C. Y., Soifer, B. T., et al. 2011, AJ, 141, 141 [NASA ADS] [CrossRef] [Google Scholar]
- Menci, N., Fiore, F., Puccetti, S., & Cavaliere, A. 2008, ApJ, 686, 219 [NASA ADS] [CrossRef] [Google Scholar]
- Merloni, A., Bongiorno, A., Bolzonella, M., et al. 2010, ApJ, 708, 137 [NASA ADS] [CrossRef] [Google Scholar]
- Mignoli, M., Pozzetti, L., Comastri, A., et al. 2004, A&A, 418, 827 [NASA ADS] [CrossRef] [EDP Sciences] [Google Scholar]
- Mignoli, M., Vignali, C., Gilli, R., et al. 2013, A&A, 556, A29 [NASA ADS] [CrossRef] [EDP Sciences] [Google Scholar]
- Narayanan, D., Dey, A., Hayward, C. C., et al. 2010, MNRAS, 407, 1701 [NASA ADS] [CrossRef] [Google Scholar]
- Perna, M., Brusa, M., Cresci, G., et al. 2015, A&A, 574, A82 [NASA ADS] [CrossRef] [EDP Sciences] [Google Scholar]
- Pettini, M., & Pagel, B. E. J. 2004, MNRAS, 348, L59 [NASA ADS] [CrossRef] [Google Scholar]
- Piqueras Lopez, J., Colina, L., Arribas, S., et al. 2012, A&A, 546, A64 [NASA ADS] [CrossRef] [EDP Sciences] [Google Scholar]
- Riguccini, L., Le Floc’h, E., Ilbert, O., et al. 2011, A&A, 534, A81 [NASA ADS] [CrossRef] [EDP Sciences] [Google Scholar]
- Riguccini, L., Le Floc’h, E.,Mullaney, J. R., et al. 2015, MNRAS, 452, 470 [NASA ADS] [CrossRef] [Google Scholar]
- Rodríguez-Zaurín, J., Tadhunter, C. N., Rose, M., & Holt, J. 2013, MNRAS, 432, 138 [NASA ADS] [CrossRef] [Google Scholar]
- Rupke, D. S. N., & Veilleux, S. 2011, ApJ, 729, L27 [NASA ADS] [CrossRef] [Google Scholar]
- Salvato, M., Ilbert, O., Hasinger, G., et al. 2011, ApJ, 742, 61 [NASA ADS] [CrossRef] [Google Scholar]
- Sanders, D. B., Salvato, M., Aussel, H., et al. 2007, ApJS, 172, 8 [Google Scholar]
- Schinnerer, E., Sargent, M. T., Bondi, M., et al. 2010, ApJS, 188, 384 [NASA ADS] [CrossRef] [Google Scholar]
- Scoville, N., Aussel, H., Bruso, M., et al. 2007, ApJS, 172, 1 [NASA ADS] [CrossRef] [Google Scholar]
- Spergel, D. N., Verde, L., Peiris, H. V., et al. 2003, ApJS, 148, 175 [NASA ADS] [CrossRef] [Google Scholar]
- Stern, D. 2015, ApJ, 807, 129 [NASA ADS] [CrossRef] [Google Scholar]
- Stern, D., Lansbury, B., & Assef, R. J. 2014, ApJ, 794, 102 [NASA ADS] [CrossRef] [Google Scholar]
- Sturm, E., González-Alfonso, E., Veilleux, S., et al. 2011, ApJ, 733, L16 [NASA ADS] [CrossRef] [Google Scholar]
- Tombesi, F., Meléndez, M., Veilleux, S., et al. 2015, Nature, 519, 436 [Google Scholar]
- Trump, J. R., Impey, C. D., McCarthy, P. J., et al. 2007, ApJS, 172, 383 [NASA ADS] [CrossRef] [Google Scholar]
- Urrutia, T., Lacy, M., Spoon, H., et al. 2012, ApJ, 757, 125 [NASA ADS] [CrossRef] [Google Scholar]
- Veilleux, S., & Osterbrock, D. E. 1987, ApJS, 63, 295 [NASA ADS] [CrossRef] [Google Scholar]
- Villar-Martín, M., Emonts, B., Humphrey, A., et al. 2014, MNRAS, 440, 3202 [NASA ADS] [CrossRef] [Google Scholar]
- Whitaker, K. E., van Dokkum, P. G., Brammer, G., & Franx, M. 2012, ApJ, 754, 29 [Google Scholar]
- Yin, S. Y., Liang, Y. C., & Zhang, B. 2007, ASP Conf. Ser., 373, 686 [NASA ADS] [Google Scholar]
All Tables
All Figures
|
Fig. 1 f24 μm/fR as a function of R − K colour for all the COSMOS 24 μm sources associated with the optical and K-band counterparts (green isodensity contours). Black crosses represent the 1 mJy flux-limited sample. Yellow stars denote the five objects observed with SINFONI; cyan stars and squares denote Melbourne et al. (2011) and Brand et al. (2007) targets, respectively (two targets present in both samples are indicated with stars); blue symbols denote the Perna et al. (2015) targets. Star and square symbols indicate IFU and long-slit observations, respectively. Sources marked with red circles are also detected in the 1 mJy flux limited sample and are those considered for the analysis. The box delimited by a vertical solid line and horizontal dashed line marks the region proposed in Fiore et al. (2009) to select CT AGN (Cell A). The horizontal dashed line sets the criterion for the selection of DOGS. |
| In the text | |
|
Fig. 2 From left to right: ACS-HST I, r+ Subaru, Ks COSMOS, IRAC 3.6 μm, MIPS 24 μm band cutouts of the five MIRO targets. The target name, position, cutouts scale, and redshift derived from the SINFONI data are also labelled. For display purposes, 3′′× 3′′ ACS-HST cutouts show the regions in the red boxes superimposed on the r+ cutouts. |
| In the text | |
|
Fig. 3 Log( |
| In the text | |
|
Fig. 4 X-ray spectra of MIRO20581 (left), MIRO18744 (centre) from XMM and Chandra, and MIRO10561 (right) from Chandra. The XMM (black) and Chandra (red) data of MIRO20581 and MIRO18744 are fitted with a double power law (as shown in the model components). The MIRO10561 Chandra data are instead fit with a single absorbed power law. |
| In the text | |
|
Fig. 5 SED fitting of MIRO targets. The black dots represent the observed data points (in each panel, from left to right: Subaru U,B,g,V,r,i,z; VISTA Y,J,H, and Ks; the four Spitzer IRAC bands, Spitzer MIPS24; Hershel PACS, and SPIRE). The blue line shows the integrated extincted emission originating from the host galaxy. The magenta line represents the star formation contribution for dust absorption, partially redistributed across the MIR/FIR range in a self-consistent way (da Cunha et al. 2008; Berta et al. 2013; Delvecchio et al. 2014). The red line reproduces the AGN contribution and incorporates both the accretion disc and torus emission. The black solid line represents the sum of all components. |
| In the text | |
|
Fig. 6 a) MIRO20581 HK-band spectrum around the [OIII] (left) and the Hα +[NII] complex (right). Superimposed on the spectrum are the best-fit components (solid and dashed blue curves, with arbitrary normalisation to ease the visualisation). The red solid curves represent the sum of all components, including the power law. Dotted lines mark the wavelengths of the Hβ, [OII] doublet, Hα, [NII], and [SII] doublet. b) MIRO10561 H-band integrated spectrum around the Hα +[NII] complex. c) MIRO18744 J-band integrated spectrum around the Hα +[NII] complex. d) MIRO28704 HK-band integrated spectrum around the Hα +[NII] complex. See a) for the description of superimposed curves in b), c), and d) panels. In the bottom panel of each fit, the residuals with respect to the best fit are shown. |
| In the text | |
|
Fig. 7 MIRO20581 residuals in the [OIII] and Hα range obtained by fitting the observed lines with only NLR and BLR components. (See Sect. 5; to be compared to Panel a of Fig. 6.) |
| In the text | |
|
Fig. 8 a) MIRO20581 contour plot of the median SINFONI datacube over the entire HK wavelength range (green scale, in steps of 1σ starting from 3σ), with over-imposed the Ks COSMOS (cyan; starting from 3σ, in steps of 3σ) and ACS HST contours (magenta; starting from 3σ, in steps of 3σ). b) [OIII]5007 channel map obtained integrating the continuum-subtracted SINFONI datacube on the total line profile (4973–5024 Å) of the region selected in panel a). The contours levels are in steps of 1σ (starting from 3σ) and show the [OIII] emission coming from the core (5000–5014 Å) and from the bluer (4973–5000 Å) part of the line profile. c) [OIII] line profiles obtained from integrated spectra over the spaxels selected in the two regions A and B in panel b). Vertical dashed lines represent the systemic velocity obtained from the 1″ integrated spectrum. |
| In the text | |
Current usage metrics show cumulative count of Article Views (full-text article views including HTML views, PDF and ePub downloads, according to the available data) and Abstracts Views on Vision4Press platform.
Data correspond to usage on the plateform after 2015. The current usage metrics is available 48-96 hours after online publication and is updated daily on week days.
Initial download of the metrics may take a while.