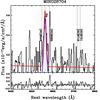
Fig. 6
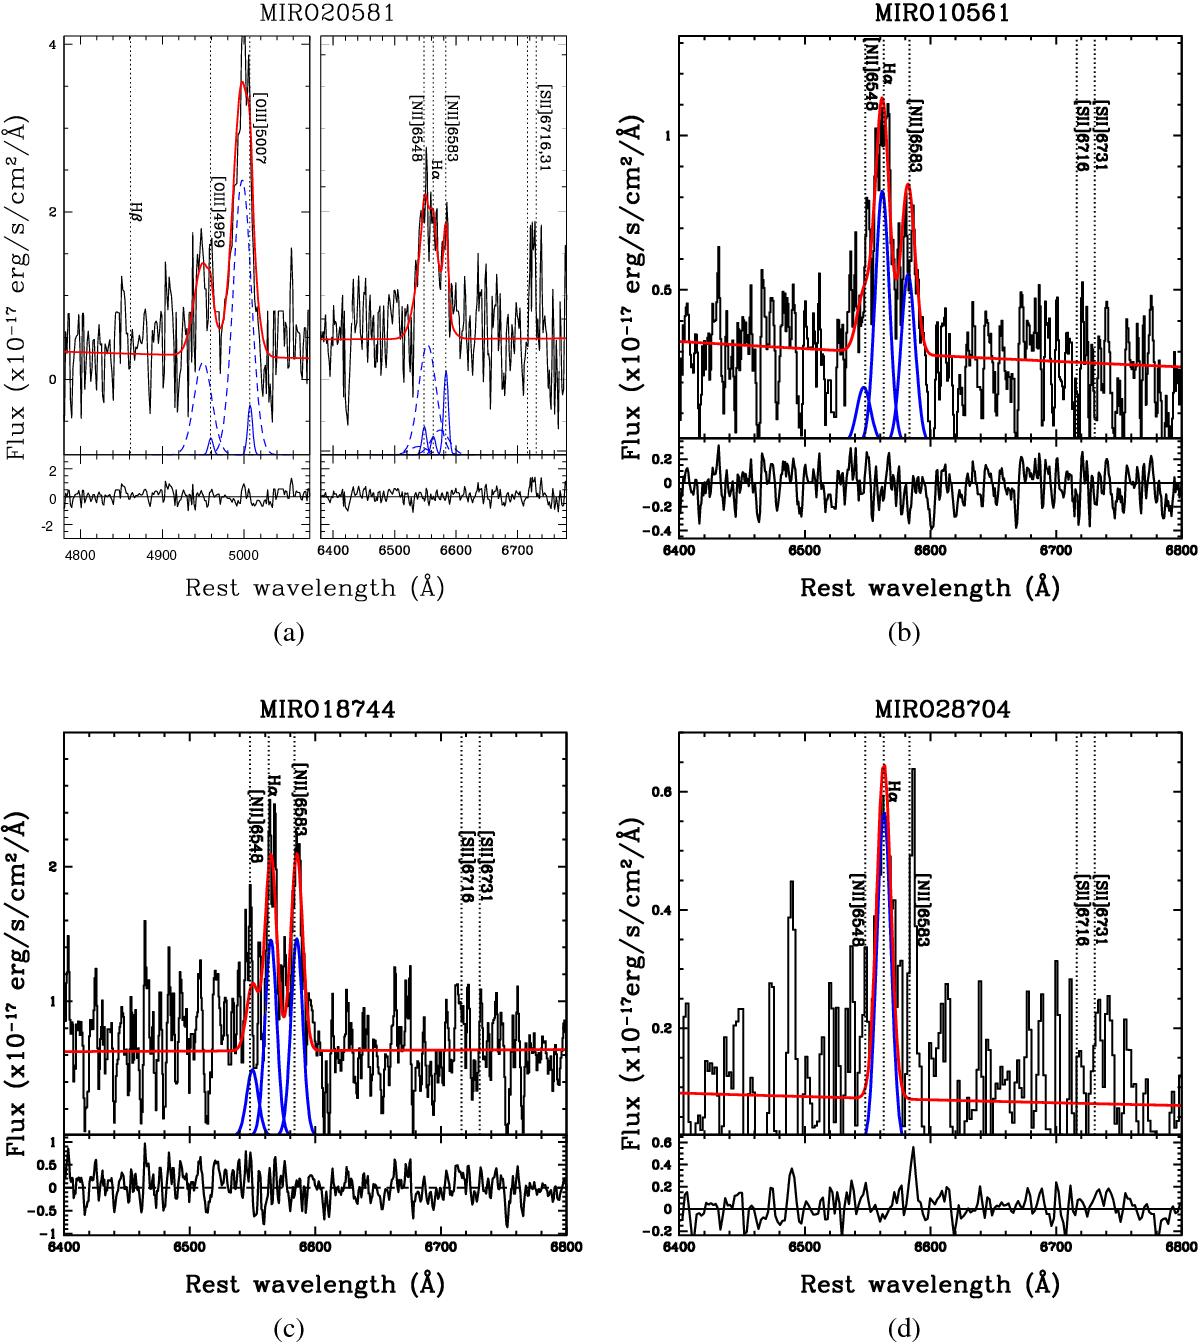
a) MIRO20581 HK-band spectrum around the [OIII] (left) and the Hα +[NII] complex (right). Superimposed on the spectrum are the best-fit components (solid and dashed blue curves, with arbitrary normalisation to ease the visualisation). The red solid curves represent the sum of all components, including the power law. Dotted lines mark the wavelengths of the Hβ, [OII] doublet, Hα, [NII], and [SII] doublet. b) MIRO10561 H-band integrated spectrum around the Hα +[NII] complex. c) MIRO18744 J-band integrated spectrum around the Hα +[NII] complex. d) MIRO28704 HK-band integrated spectrum around the Hα +[NII] complex. See a) for the description of superimposed curves in b), c), and d) panels. In the bottom panel of each fit, the residuals with respect to the best fit are shown.
Current usage metrics show cumulative count of Article Views (full-text article views including HTML views, PDF and ePub downloads, according to the available data) and Abstracts Views on Vision4Press platform.
Data correspond to usage on the plateform after 2015. The current usage metrics is available 48-96 hours after online publication and is updated daily on week days.
Initial download of the metrics may take a while.