Fig. 8
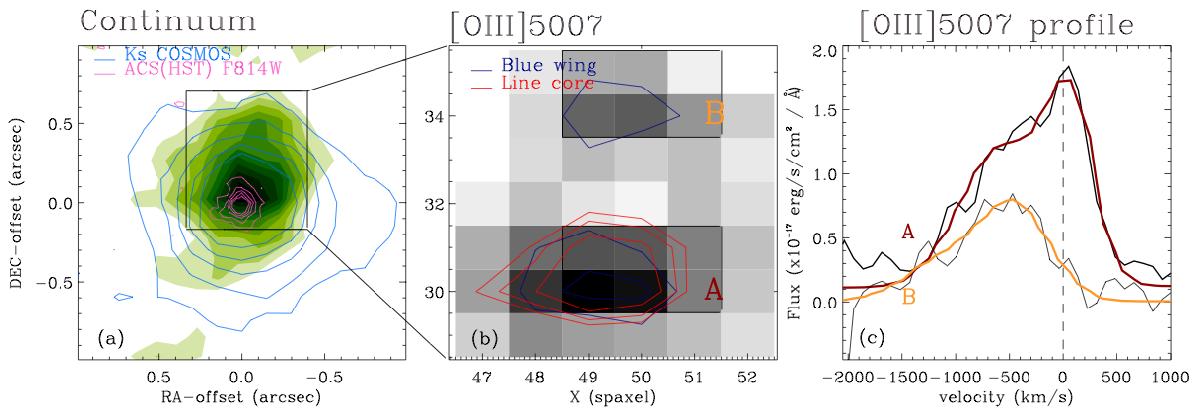
a) MIRO20581 contour plot of the median SINFONI datacube over the entire HK wavelength range (green scale, in steps of 1σ starting from 3σ), with over-imposed the Ks COSMOS (cyan; starting from 3σ, in steps of 3σ) and ACS HST contours (magenta; starting from 3σ, in steps of 3σ). b) [OIII]5007 channel map obtained integrating the continuum-subtracted SINFONI datacube on the total line profile (4973–5024 Å) of the region selected in panel a). The contours levels are in steps of 1σ (starting from 3σ) and show the [OIII] emission coming from the core (5000–5014 Å) and from the bluer (4973–5000 Å) part of the line profile. c) [OIII] line profiles obtained from integrated spectra over the spaxels selected in the two regions A and B in panel b). Vertical dashed lines represent the systemic velocity obtained from the 1″ integrated spectrum.
Current usage metrics show cumulative count of Article Views (full-text article views including HTML views, PDF and ePub downloads, according to the available data) and Abstracts Views on Vision4Press platform.
Data correspond to usage on the plateform after 2015. The current usage metrics is available 48-96 hours after online publication and is updated daily on week days.
Initial download of the metrics may take a while.