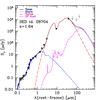
Fig. 5
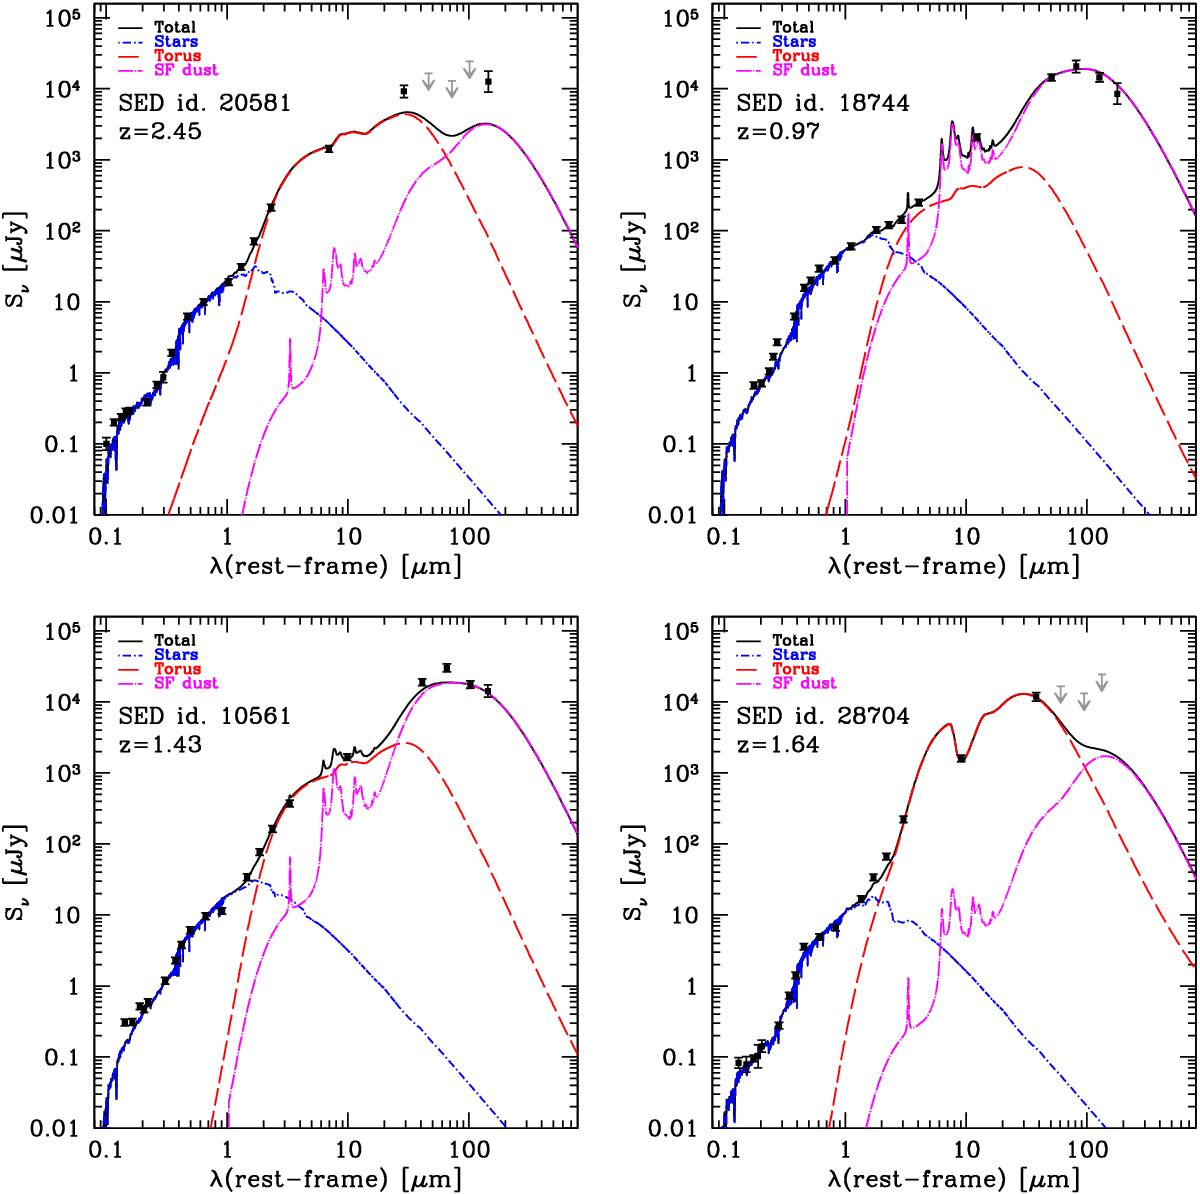
SED fitting of MIRO targets. The black dots represent the observed data points (in each panel, from left to right: Subaru U,B,g,V,r,i,z; VISTA Y,J,H, and Ks; the four Spitzer IRAC bands, Spitzer MIPS24; Hershel PACS, and SPIRE). The blue line shows the integrated extincted emission originating from the host galaxy. The magenta line represents the star formation contribution for dust absorption, partially redistributed across the MIR/FIR range in a self-consistent way (da Cunha et al. 2008; Berta et al. 2013; Delvecchio et al. 2014). The red line reproduces the AGN contribution and incorporates both the accretion disc and torus emission. The black solid line represents the sum of all components.
Current usage metrics show cumulative count of Article Views (full-text article views including HTML views, PDF and ePub downloads, according to the available data) and Abstracts Views on Vision4Press platform.
Data correspond to usage on the plateform after 2015. The current usage metrics is available 48-96 hours after online publication and is updated daily on week days.
Initial download of the metrics may take a while.