| Issue |
A&A
Volume 581, September 2015
|
|
|---|---|---|
| Article Number | A85 | |
| Number of page(s) | 13 | |
| Section | Interstellar and circumstellar matter | |
| DOI | https://doi.org/10.1051/0004-6361/201525778 | |
| Published online | 09 September 2015 | |
The jet and the disk of the HH 212 low-mass protostar imaged by ALMA: SO and SO2 emission
1
INAF − Osservatorio
Astrofisico di Arcetri, Largo E. Fermi 5,
50125
Firenze,
Italy
e-mail:
This email address is being protected from spambots. You need JavaScript enabled to view it.
2
IRAM, 300 rue
de la Piscine, 38406 Saint-Martin d’Hères, France
3
LERMA, Observatoire de Paris, UPMC Univ. Paris 06, PSL Research
University, Sorbonne Universités, CNRS, 75014
Paris,
France
4
UJF-Grenoble1/CNRS-INSU, Institut de Planétologie et
d’Astrophysique de Grenoble (IPAG) UMR 5274, Grenoble
38041,
France
5
IGN, Observatorio Astronómico Nacional,
Alfonso XIII 3, 28014
Madrid,
Spain
6
Academia Sinica Institute of Astronomy and
Astrophysics, PO Box
23-141, Taipei
106,
Taiwan
7
Max-Planck-Institut für Radioastronomie,
Auf dem Hügel 69, 53121
Bonn,
Germany
8
INAF, Osservatorio Astronomico di Roma, via di Frascati
33, 00040
Monte Porzio Catone,
Italy
Received: 1 February 2015
Accepted: 15 May 2015
Abstract
Context. The investigation of the disk formation and jet launching mechanism in protostars is crucial to understanding the earliest stages of star and planet formation.
Aims. We aim to constrain the physical and dynamical properties of the molecular jet and disk of the HH 212 protostellar system at unprecedented angular scales, exploiting the capabilities of the Atacama Large Millimeter Array (ALMA).
Methods. The ALMA observations of HH 212 in emission lines from sulfur-bearing molecules, SO 98−87, SO 1011−1010, SO282,6−71,7, are compared with simultaneous CO 3−2, SiO 8−7 data. The molecules column density and abundance are estimated using simple radiative transfer models.
Results. SO 98−87 and SO282,6−71,7 show broad velocity profiles. At systemic velocity, they probe the circumstellar gas and the cavity walls. Going from low to high blue- and red-shifted velocities the emission traces the wide-angle outflow and the fast (~100−200 km s-1), collimated (~90 AU) molecular jet revealing the inner knots with timescales ≤50 yr. The jet transports a mass-loss rate ≥ 0.2−2 × 10⁻⁶ M⊙ yr-1, implying high ejection efficiency (≥ 0.03−0.3). The SO and SO2 abundances in the jet are ~ 10-7−10-6. SO 1011−1010 emission is compact and shows small-scale velocity gradients, indicating that it originates partly from the rotating disk previously seen in HCO+ and C17O, and partly from the base of the jet. The disk mass is ≥ 0.002−0.013 M⊙ and the SO abundance in the disk is ~ 10-8−10-7.
Conclusions. SO and SO2 are effective tracers of the molecular jet in the inner few hundreds AU from the protostar. Their abundances indicate that 1−40% of sulfur is in SO and SO2 due to shocks in the jet/outflow and/or to ambipolar diffusion at the wind base. The SO abundance in the disk is 3−4 orders of magnitude larger than in evolved protoplanetary disks. This may be due to an SO enhancement in the accretion shock at the envelope-disk interface or in spiral shocks if the disk is partly gravitationally unstable.
Key words: stars: formation / ISM: jets and outflows / ISM: molecules / ISM: individual objects: HH 212
© ESO, 2015
1. Introduction
The first steps of the formation of a low-mass star are regulated by the simultaneous effects of the mass accretion onto the star and the ejection of matter from the stellar-disk system. As a result, protostars (the so-called Class 0 objects) are characterised by the occurrence of fast bipolar jets flowing perpendicular to the plane of accretion disks. In practice, although the precise launch region (star, inner disk edge at ~0.1 AU, outer disk at ~0.1−10 AU) remains unknown (e.g. Ferreira et al. 2006), jets are thought to remove excess angular momentum from the star-disk system, thus allowing disk accretion onto the central object. Unfortunately, the observations of the jet-disk pristine systems in deeply embedded protostars are very difficult to perform given the small scales involved as well as the occurrence of numerous other kinematical components involved in the star formation recipe (cavities of swept-up material, infalling envelope, static ambient cloud).
The HH 212 region in Orion (at 450 pc) can be considered an ideal laboratory to investigate the interplay of infall, outflow, and rotation in the earliest evolutionary phases of the star forming process. HH 212 is a low-mass Class 0 source driving a symmetric and bipolar jet extensively observed in typical molecular tracers such as H2, SiO, and CO (e.g. Zinnecker et al. 1998). High-spatial resolution observations (down to  ) performed with the SubMillimeter Array (SMA; Lee et al. 2006, 2007a, 2008), the IRAM Plateau de Bure (PdB) interferometer (Codella et al. 2007; Cabrit et al. 2007, 2012), and the Atacama Large Millimeter Array (ALMA; see Lee et al. 2014; Codella et al. 2014a) reveal the inner ± 1″−2″ = 450−900 AU collimated jet (width ≃100 AU) close to the protostar. HH 212 is also associated with a flattened rotating envelope in the equator perpendicular to the jet axis observed firstly with the NRAO Very Large Array (VLA) in NH3 emission by Wiseman et al. (2001) on 6000 AU scales. More recent SMA and ALMA observations in the CO isotopologues and HCO+ on ~2000, 800 AU scales indicates that the flattened envelope is rotating and infalling onto the central source, and can therefore be identified as a pseudo-disk according to magnetised core collapse models (Lee et al. 2006, 2014). In addition, a compact (≤120 AU), optically thick dust peak is observed by Codella et al. (2007), Lee et al. (2006, 2014) and attributed to an edge-on disk rather than the inner envelope. This seems to be confirmed by HCO+ and C17O emission showing signatures of a compact disk of radius ~90 AU Keplerian rotating around a source of ≃0.2−0.3 M⊙ (Lee et al. 2014; Codella et al. 2014a). Keplerian rotating disks had previously only been observed towards other three Class 0 objects: IRAS 4A2 (Choi et al. 2010), L1527 (Tobin et al. 2012; Sakai et al. 2014), and VLA1623A (Murillo et al. 2013), but HH 212 can be considered as the only object clearly revealing both a disk and a fast collimated jet, calling for further observations aimed to characterise its inner regions.
Recent observations show that SO can be used to image high-velocity protostellar jets, similar to a standard tracer such as SiO (Lee et al. 2010; Tafalla et al. 2010; Codella et al. 2014b). However, only two protostellar jets have so far been clearly mapped in SO lines: HH 211 and NGC 1333-IRAS 2A, and estimates of the SO abundance have only been derived for HH 211. On the other hand, sulfur bearing species have long been searched in protoplanetary disks associated with evolved young stellar objects (i.e. Class I-II) but only CS has been routinely observed while SO is hard to detect: Dutrey et al. (2011) reported no detection of SO (and H2S) from three prototypical protoplanetary disks; Fuente et al. (2010) reported a detection in the disk of the T Tauri star AB Aur; and Guilloteau et al. (2013) showed that SO is exceptionally observed in disks with only one definite detection on a sample of 42 T Tauri and Herbig Ae stars towards 04302 + 2247. The statistics regarding disks around Class 0 protostars is even poorer. The only case is represented by L1527, where Sakai et al. (2014) found that SO, as observed by ALMA, originates from the outer disk near the centrifugal barrier, and its emission is argued to be enhanced by an accretion shock. Observations of HH 212 in the SO 98−87 line obtained with the SMA by Lee et al. (2007a) suggest that SO may have two components: a low-velocity one originating in the inner rotating envelope/pesudo-disk and an high-velocity one from the jet. However, a detailed analysis of these two components was prevented by the lack of angular resolution and sensitivity.
In this paper, we exploit the unprecedented combination of high spatial resolution and high sensitivity of ALMA to image and characterise both the molecular jet and the disk around the HH 212 protostar through SO and SO2 lines. To evaluate the reliability of SO and SO2 lines as tracers of shock chemistry and/or high-density gas in the disk, the SO and SO2 spatio-kinematical properties are compared with a well-known shock chemistry tracer (SiO), with a universal outflow tracer not sensitive to density or chemistry (CO), and with a disk tracer (C17O). The ALMA observations of SO and SO2 emission presented in Sect. 2 are at higher angular resolution than previous SMA observations by Lee et al. (2007a;  , i.e. around a factor 4 better than at SMA,
  ) and ~100 times more sensitive (σ ~ 3−4 mJy/beam/0.43 km s-1 with ALMA and σ ~ 450 mJy/beam/km s-1 with SMA). This allows us to disentangle for the first time the origin of the different velocity components in SO and SO2 and to probe the different structures in the compact circumstellar region, i.e. the cavity walls, the outflow, the molecular jet, the envelope, and the disk (see Sect. 3). The simultaneous observation of the SiO 8−7 and CO/C17O 3−2 lines presented in Codella et al. (2014a) allows the determination of the molecule abundances and the physical and dynamical properties of the jet and disk (see Sect. 4). Finally, our conclusions are summarised in Sect. 5.
 |
Fig. 1 Channel maps of SO 98−87 (top) and SO282,6−71,7 (bottom) at systemic, low (LV), intermediate (IV), and high (HV) velocities (panels from left to right). The green, blue, and red contours trace the emission at systemic velocity and over the labelled blue- and red-shifted velocity intervals (| V − Vsys |). The lowest contour of the emission at systemic velocity is shown in all panels. The first contour is at 5σ for SO and 3σ for SO2 with steps of 5σ (Vsys) and 20σ (LV, IV, HV) for SO and 3σ for SO2 (1σ ~ 3−4 mJy/beam/0.43 km s-1). The tilted black cross is centred at the source position and indicates the jet and the disk PA (PAjet = 22°, PAdisk = 112°). The ellipse in the bottom-left corner shows the beam HPBW of the line emission maps ( |
Properties of the observed transitions.
 |
Fig. 2 From left to right: position-velocity (PV) diagram of CO 3−2, SiO 8−7, SO 98−87, and SO282,6−71,7 lines obtained along the jet (PAjet = 22°, top) and the disk (PAdisk = 112°, bottom). Horizontal and vertical dashed lines mark Vsys = + 1.3 km s-1 and the continuum peak MM1. The red arrows on the SO282,6−71,7 PV indicate emission from complex organic molecules, which is blended with the SO2 emission at the source position. For CO 3−2, SiO 8−7, SO 98−87, SO282,6−71,7 the first contour is at 5σ (σ = 10 mJy for SiO, 4 mJy for SO, and 3 mJy for SO2) with steps of 10σ (CO, SiO, and SO), and 5σ (SO2). |
2. Observations and data reduction
We observed HH 212 in Band 7 in the extended configuration of the ALMA Early Science Cycle 0 operations on December 1 2012 using 24 antennas of 12-m. The shortest baseline was about 20 m and the longest 360 m, hence the maximum unfiltered scale is of 3″ at 850 μm. The properties of the observed SO 98−87, SO 1011−1010, and SO282,6−71,7 transitions are summarised in Table 1 (frequency ν0 in MHz, upper level energy Eup in K, Sijμ2 in D2, coefficient for radiative decay Aij in s-1). We also report the properties of the SiO 8−7, CO 3−2, and C17O 3−2 transitions observed during the same run and presented by Codella et al. (2014a), which are also analysed to compare with the SO and SO2 emission. The obtained data cubes have a spectral resolution of 488 kHz (0.42−0.43 km s-1), a typical beam FWHM of  at PA ~ 49°, and an rms noise of ~3−4 mJy/beam in the 0.43 km s-1 channel. The calibration was carried out following standard procedures and using quasars J0538−440, J0607−085, as well as Callisto and Ganymede. Spectral line imaging and data analysis were performed using the CASA1 and the GILDAS2 packages. Offsets are given with respect to the MM1 protostar position as determined from the dust continuum peak by Codella et al. (2014a), i.e. α (J2000) = 05h 43m 51s.41,
  17. These values are in excellent agreement with those determined through previous SMA and PdBI observations. Velocities are given with respect to the systemic velocity, Vsys, which is estimated following the same method as in Codella et al. (2014a). They show that the emission in the C17O 3−2 and C34S 7−6 lines is most extended and most symmetric in the 0.43 km s-1 wide velocity bin centred at + 1.13 ± 0.22 km s-1 and + 1.42 ± 0.22 km s-1, respectively, and assume that Vsys is the average of these values. For SO 98−87 and SO282,6−71,7, the largest extension is observed at + 1.27 ± 0.21 km s-1 and + 1.53 ± 0.22 km s-1. The average of the central velocity of C17O, C34S, SO, and SO2 gives Vsys = + 1.3 ± 0.2 km s-1, in agreement with the value adopted by Codella et al. (2014a). Despite the coarse velocity binning, all the lines indicate a systemic velocity significantly smaller than the value determined by Wiseman et al. (2001, + 1.6 ± 0.1 km s-1, and the value adopted by Lee et al. (2006, 2007a, 2014, + 1.7 ± 0.1 km s-1. As argued by Codella et al. (2014a), this discrepancy might be because the C17O, C34S, SO, and SO2 emission seen by ALMA probes the gas motion on much smaller spatial scales (≤1350 AU) than the ammonia observed by Wiseman et al. (2001, ~. Moreover, SO and SO2 line peaks towards the MM1 protostar are red-shifted by ~+1 km s-1 with respect to the velocity where they show the maximum spatial extent (see Sect. 3.4). This may be because of the optical depth effects, and suggests that adopting the velocity where the ambient gas show the maximum extent may be more accurate than using the line peak velocity to define Vsys. The results we present, however, are not dependent on the 0.3 km s-1 velocity difference between the different Vsys estimates.
3. Results
To constrain the origin of the detected SO 98−87 and SO282,6−71,7 lines, we define the following four velocity intervals over which the emission show different morphologies and kinematic properties3:
-
systemic velocity: 0 < | V − Vsys | < 0.6 km s-1;
-
low velocity (LV hereafter): 0.6 < | V − Vsys | < 5.2 km s-1;
-
intermediate velocity (IV hereafter): 5.2 < | V − Vsys | < 10.2 km s-1;
-
high velocity (HV hereafter): 10.2 < | V − Vsys | < 15.2 km s-1.
Figure 1 shows channel maps of the SO 98−87 and SO282,6−71,7 emission in the four velocity intervals defined above. In the following sections we discuss the origin and the properties of the different SO and SO2 velocity components.
3.1. The cavity walls
At systemic velocity, SO 98−87 and SO282,6−71,7 peak at the source position (see left panels of Fig. 1). This may be because of a density enhancement in the circumstellar region, as suggested by the modelling of HCO+4−3 emission (Lee et al. 2014), and/or to an enhancement of the SO and SO2 abundances due to dust grain mantles sublimation and release of sulphur-bearing species in the gas phase. The SO 98−87 emission also extends in a wide-angle biconical structure around the direction of the H2/SiO jet, which extends up to 2″−3″ distance from source and up to ±0.6 km s-1 with respect to systemic velocity. Also the SO2 emission shows a similar morphology but only southern to the source. Given the high critical density of the observed SO and SO2 transitions (ncr ~ 2 × 106 cm-3 for gas temperatures of 50−100 K) and the similarity with the C34S emission detected by Codella et al. (2014a), this emission is believed to originate in the compressed, swept-up gas in the outflow cavity walls.
3.2. The outflow
At low velocities, the SO 98−87 and SO282,6−71,7 emission is bipolar and collimated along the jet direction. Blue- and red-shifted LV emission largely overlap in the two lobes similar to SiO 5−4 and 8−7 (Codella et al. 2007, 2014a; Lee et al. 2007a). The emission has a transverse FWHM of  , which implies an intrinsic width of
  AU after correction for the ALMA HPBW (
 in the transverse direction), i.e. larger than the SiO jet width measured by Cabrit et al. (2007, ~. This indicates that the LV component, with large blue/red overlap, is probing a slower wider-angle outflow surrounding the narrow HV jet (see the following section).
3.3. The fast and collimated molecular jet
Figure 1 shows that as we move to intermediate and high velocities, SO 98−87 and SO282,6−71,7 blue- and red-shifted emission only slightly overlap and become more and more collimated. The FWHM is  , which translates into an intrinsic width of
  , i.e. ~90 AU, after correction for the beam HPBW across the jet (). Assuming an inclination angle i ~ 4° (Claussen et al. 1998) the de-projected gas velocity is V ~ 70−210 km s-1. The inferred velocity and width are in perfect agreement with those estimated from SiO 5−4 emission (see Codella et al. 2007; Cabrit et al. 2007) and indicate that, for radial velocities larger than 5 km s-1, SO and SO2 trace the molecular jet.
 |
Fig. 3 Left panels: PV of SO 98−87 emission along the jet PA (in red) is overplotted on SiO 8−7 and CO 3−2 PVs (in black, top, and bottom panels, respectively). Right panels: ratio of the SO 98−87 PV to the SiO 8−7 and CO 3−2 PV (top and bottom panels, respectively). The colour scale is logarithmic. |
To further investigate the effectiveness of SO and SO2 as tracers of the molecular jet, position-velocity diagrams (PVs) of SO and SO2 emission along and perpendicular to the jet direction (PAjet = 22°, PAdisk = 112°) are extracted and compared with the PVs of CO 3−2 and SiO 8−7. Figure 2 shows that the considered tracers have different spatio-kinematical properties. While SiO traces only jet emission with no contamination from ambient gas, SO and SO2 are dominated by cloud and outflow emission at systemic and low velocities. Moreover, the LV and IV SO emission shows accelerating “arms”, from systemic velocity at the source position to ~ ± 8 km s-1 at  distance from source, which are not seen in SiO. These arms suggest that some SO/SO2-rich gas from the circumstellar envelope or disk may be continuously accelerated to high velocities away from the source, either by interaction with the fast jet or by magneto-centrifugal forces operating on envelope/disk scales (e.g. Ciardi & Hennebelle 2010; Panoglou et al. 2012). Similar to SO and SO2, CO 3−2 traces multiple components depending on velocity (the envelope, the outflow, the jet). Moreover, the CO PVs show a strong absorption feature at sligthly red-shifted velocity (~ + 1 km s-1). Despite the different behaviours of the considered tracers, Fig. 3 shows that for velocities larger than ~ ± 8 km s-1 the PV diagram of SO along the jet is very similar to that of CO 3−2 and SiO 8−7, suggesting that at high velocities all tracers probe the same jet component. This in turn allows us to compare the emission from SO and CO at high velocities and to estimate the abundances of SO and SO2 in the jet by comparing their column densities with that of CO 3−2 (see Sect. 4.2).
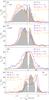 |
Fig. 4 Intensity profiles of SiO 8−7 (blue), SO 98−87 (red), and SO282,6−71,7 (orange) over CO 3−2 (grey) at the knots (B2, B3, R2) and source (MM1) positions. The name and distance of the knots and the normalisation factor to the CO 3−2 peak intensity are indicated at the top of the panels. The orange vertical arrows at the MM1 position indicate emission lines from complex organic molecules, which are blended to the SO2 line. |
Figure 1 shows that the SO 98−87 and SO282,6−71,7 IV and HV emission has three emission peaks, or knots, marked by black triangles on the SO and SO2 channel maps, two along the blue lobe (B3 and B2) and one along the red lobe (R2). The knots are located at  ,
,  , and
, and  , respectively, i.e. at a de-projected distance from the MM1 protostar of around 300, 700, and 650 AU. The B2 and R2 SO/SO2 knots are roughly coincident with the B2, R2 knots observed in SiO 5−4 emission by Codella et al. (2007) and the SN, SS knots in SiO 8−7 and CO 3−2 emission observed by Lee et al. (2007a). One-dimensional spectra of SO 98−87 and SO282,6−71,7 are extracted at the position of the knots using the same synthetised beam, and the obtained intensity profiles (Tmb in K versus (V−Vsys) in km s-1) are shown in Fig. 4. From the spectra, we estimate the emission line properties in the knots i.e.: rms noise in K, maximum blue- and red-shifted velocity (Vmax,b and Vmax,r in km s-1), full width at zero intensity (FWZI in km s-1), velocity at the emission peak (Vpeak in km s-1), main-beam temperature peak (Tmb,peak in K), and integrated intensity (
 in K km s-1) (see Table 2).
Properties of the observed emission lines on-source (MM1) and at the position of the knots along the jet.
From the velocity at the SO emission peak reported in Table 2, we estimate the knot de-projected velocity, V = Vpeak/ sin(i), and the knots dynamical timescale, τdyn = d/V, where d is the knot de-projected distance from the protostar. We find τdyn ~ 15 yr for B3, and ~30 yr for the symmetrically located blue- and red-shifted knots B2 and R2. The position, distance, velocity, and dynamical timescale of the detected SO knots are summarised in Table 4. The inferred dynamical timescales are very low, suggesting that the observed SO emission probes very recent ejection events. These estimates, however, are affected by a large uncertainty because of the assumed inclination angle, the choice of the tracer (Vpeak varies up to a factor 3 depending on the tracer, either SO, SO2, or SiO), and the broad line profiles (up to ~27 km s-1). The line broadening may be caused by the jet geometry and/or by internal jet shocks. In the first case, if the jet is conical and propagates with constant velocity V at an angle i to the plane of the sky, the observed maximum blue- and red-shifted velocities (see Table 2) imply a jet half-opening angle θmax ~ 10° 4. This in turn implies a knot de-projected velocity V = Vmax/ sin(i + θmax) that is about a factor 2 smaller than the de-projected Vpeak, implying a factor 2 larger timescales than those reported in Table 4. Note, however, that the observed line profiles are strongly asymmetric and show broad line wings, unlike the synthetic profile computed by Kwan & Tademaru (1988) for a conical jet of constant speed seen close to edge-on (see their Fig. 1, dashed curve for i = 82.8° and 2θmax = 20°). Alternatively, the observed line broadening may be due to an “internal jet shock” in which fast jet material catches up and shocks slower previous ejecta. In this scenario, over-pressured shocked material is squeezed sideways out of the jet beam, producing an expanding bowshock structure in its wake, which causes the observed line broadening. The bowshock scenario is favoured by Codella et al. (2007) and further supported by the SiO maps and transverse PVs of Lee et al. (2008). In that case, Vpeak traces the bow wings while the knot velocity along the jet axis is V = Vmax/ sin(i), i.e. around a factor 2 larger than the de-projected Vpeak. This would imply a factor two smaller timescales than those reported in Table 4. We conclude that the estimated knot timescales are affected by an uncertainty of a factor 2−3 depending on the origin of the line broadening and the selected knot tracer.
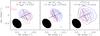 |
Fig. 5 Blue- and red- shifted emission of SO 1011−1010 at low velocities (| V − Vsys | < 1.9 km s-1, left panel) and in the higher velocity range where the emission is consistent with a rotating disk (HVdisk : 1.9 < | V − Vsys | < 3.5 km s-1, middle panel) is compared with C17O 3−2 emission in the HVdisk range (right panel, Codella et al. 2014a). The tilted black cross indicates the jet (PA = 22°) and the disk (PA = 112°) direction. The ellipse in the bottom left corner shows the beam HPBW of the line emission maps ( |
In Fig. 4 the obtained SO 98−87 and SO282,6−71,7 intensity profiles are also compared with the profiles of a typical jet tracer, i.e. SiO 8−7 (Codella et al. 2007; Lee et al. 2007a), and a jet/outflow (at high/low velocities, respectively) tracer, i.e. CO 3−2. The intensity profiles are extracted at the same positions and with very similar synthetised beam for all the lines (differences between the beams are  ). The comparison shows that even though the SiO and SO knots are roughly co-spatial, SO and SO2 peak at higher velocities than SiO in the blue lobe and at lower velocities in the red lobe. This stratification in velocity is a typical signature of shock-excited emission as both the abundances of the observed molecular species and the gas physical conditions (density and temperature) undergo strong gradients in the post-shock cooling region, giving rise to chemical segregation. The different profiles and molecular stratification shown by the symmetrically located knots B2 and R2 suggest different shock conditions in the blue and red lobes within 2′′ from source. This asymmetry is in contrast with the symmetry observed on larger scales in H2 (Zinnecker et al. 1998), and suggests that asymmetries may wash out on large timescales. A detailed comparison of the observed intensity profiles with shock models predictions is out of the scope of this paper and will be presented in Gusdorf et al. (in prep.).
Finally, it should be noted that, even though SO, SO2, SiO, and CO show different behaviours at low velocity (i.e. different spatio-kinematical distribution in the PVs and different line profiles and peak velocities), the maximum blue and red velocities are remarkably similar. This indicates that, as also suggested by the comparison of the line PVs in Fig. 3, all the considered lines probe the same jet component at high velocities.
3.4. The flattened rotating envelope
As suggested by Lee et al. (2007a), while the high-velocity SO 98−87 emission is clearly associated with the molecular jet, the low velocity emission could arise in the inner rotating envelope and/or in a pesudo-disk. The bottom panels of Fig. 2 shows the PVs of the observed emission lines obtained cutting the data cube perpendicular to the jet PA, i.e. along the disk direction (PAdisk = 112°). With the exception of SiO, which shows poor emission along the disk, the other lines show a velocity gradient perpendicular to the jet PA of a few km s-1 over a scale ≤1″ (i.e. ≤450 AU), which suggests rotation in a flattened envelope and/or a disk with the same rotation sense as observed in HCO+ by Lee et al. (2014) and in C17O 3−2 by Codella et al. (2014a).
The SO 98−87 and SO282,6−71,7 intensity profiles at the position of the MM1 protostar (Fig. 4), peak at slightly red-shifted velocity, i.e. ~+1 km s-1, where CO 3−2 shows a deep absorption feature. This could be a signature of infalling gas. The SO282,6−71,7 line profile shows two spectral “bumps” at blue- and red-shifted velocities, which are not detected in the other tracers. The PV diagram in Fig. 2 shows that these spectral features are only seen in a spatially unresolved region towards the MM1 position, and not along the outflow. This suggests that SO2 is blended with two unidentified lines emitted in the inner few 100 AU of the protostellar envelope. These lines are likely produced by complex organic molecules (COMs) evaporated from the icy mantles of dust grains in the warm circumstellar region (Tdust> 100 K), as observed towards many other low-luminosity protostars (e.g. Maury et al. 2014). The identification and analysis of these lines is out of the scope of this paper.
3.5. SO 1011–1010: the compact rotating disk?
Channel maps and position-velocity diagrams along and perpendicular to the jet direction are also obtained for the fainter SO 1011−1010 line as shown in Figs. 5 and 6. In contrast to SO 98−87 and SO282,6−71,7, the emission in the SO 1011−1010 line is compact (~90 AU scales) and narrow in velocity extending only up to ±5 km s-1 with respect to systemic. As shown in Fig. 5 the red- and blue-shifted emission peaks are displaced roughly along the jet direction for velocities <1.9 km s-1 (see left panel). However, in the velocity range where C17O 3−2 probes a compact (~90 AU) disk rotating around a 0.3 ± 0.1 M⊙ star (1.9 < | V − Vsys | < 3.5 km s-1, Codella et al. 2014a), the SO 1011−1010 emission peaks are consistently displaced along the disk axis (see middle and right panels). This suggests that the SO emission at those velocities may also originate in the compact disk.
The PV diagram perpendicular to the jet axis in Fig. 6 supports this scenario as it shows a blue and a red lobe, which are consistent with emission from a rotating structure. However, when cutting the data cube along the jet PA the blue- and red-shifted lobes are consistent with jet emission. This indicates that SO 1011−1010 partly traces rotating gas in a flattened envelope and/or in a disk, and partly traces the jet.
In Fig. 7, the SO 1011−1010 line intensity profile extracted at the source position is compared with C17O 3−2 analysed by Codella et al. (2014a). In the 1.9 < | V − Vsys | < 3.5 velocity range the SO 1011−1010 and C17O 3−2 line profiles are very similar suggesting that at those velocities they are tracing the same disk component. However, at low velocities the SO 1011−1010 line intensity profile shows a red-shifted absorption feature at ~0.5 km s-1. This may be because of the SO 1011−1010 higher excitation energy, which makes it less affected by the emission from the circumstellar gas and more sensitive to absorption by the infalling gas. As the observed SO 1011−1010 is compact, the detected absorption feature could probe the infall of the outer disk regions, on much smaller scales than the infalling gas traced by CO 3−2.
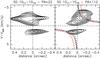 |
Fig. 6 From left to right: position-velocity diagram of SO 1011−1010 obtained along the jet (PAjet = 22°, left) and the disk (PAdisk = 112°, right). Horizontal and vertical dashed lines mark Vsys = + 1.3 km s-1 and the continuum peak MM1. The first contour is at 6σ (1σ = 2 mJy) with steps of 0.5σ. On the PV along the disk the Keplerian curves for M∗ = 0.3 ± 0.1 M⊙ (solid and dashed black curves) and the r-1 curve for infalling gas with angular momentum conservation (red curve) are overplotted. |
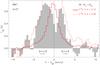 |
Fig. 7 Intensity profiles of SO 1011−1010 (grey) and C17O 3−2 (red) extracted at the source position. The horizontal bars in the bottom of the panel indicate the high-velocity range (HVdisk = 1.9−3.5 km s-1) where the lines are consistent with a disk origin (Codella et al. 2014a). The normalisation factor to the SO 1011−1010 intensity at peak (solid line) and in the blue-shifted HVdisk range (dotted line) are labelled on the top of the panel. |
4. Discussion
4.1. Searching for jet rotation
Magneto hydro-dynamical (MHD) models predict that the jet is launched by magneto-centrifugal forces that lift the gas from the disk along the open magnetic field lines, accelerating and collimating it. According to these models, the jet rotates around its axis carrying away the excess angular momentum from the disk, thus allowing accretion onto the central star. Many recent studies have been devoted to searching for systematic velocity asymmetries across the jet axis as a signature of jet rotation, first at optical wavelengths (e.g. Bacciotti et al. 2002; Coffey et al. 2004) and more recently in the sub-mm and mm range (e.g. Codella et al. 2007; Lee et al. 2007a,b, 2008, 2009; Launhardt et al. 2009).
Tentative rotation measurements have been obtained for HH 212 by Davis et al. (2000), Codella et al. (2007), and Lee et al. (2008). Davis et al. (2000) reported a rotation speed of ~1.5 km s-1 at a distance of ~230 AU from the jet axis in the southern H2 knot SK1 located at 2300 AU distance from the source. However, the velocity asymmetry in the northern lobe would indicate rotation in the opposite sense. Moreover, at these large distances from the driving source and from the jet axis the velocity pattern is likely dominated by effects other than rotation i.e. by interaction with the surrounding cloud in the bowshock wings, and/or jet wiggling and precession (e.g. Correia et al. 2009). More recent high angular resolution measurements in the inner B2 and R2 knots (~ 1″−2″ from source) gives contradictory results: Codella et al. (2007) do not observe transverse velocity shifts above 1 km s-1 in the SiO 5−4 emission with  HPBW resolution, while higher angular resolution SMA observations of SiO 8−7 (
 ) indicate a velocity shift at the tip of the two bow shocks (Lee et al. 2008).
To test the validity of these tentative rotation measurements, we search for velocity asymmetries across the collimated jet by extracting PV diagrams of SO 98−87 and SO282,6−71,7 emission perpendicular to the jet axis at the positions of knots B2, B3, and R2 (see Fig. 8). The PV diagrams for SiO are not shown as these are at lower resolution with respect to those by Lee et al. (2008). The figure shows no evidence of a velocity gradient across the jet axis, consistent with the high-velocity SO/SO2 jet being practically unresolved transversally. Higher angular resolution ( ), which will be available with the full ALMA array, is needed to properly sample the velocity pattern across the jet width and to provide a reliable test of rotation in the HH 212 jet.
In the PV across the B3 knot, there is a hint of rotation for the gas close to systemic velocity, which could indicate rotation of the outflow cavity as seen in C34S (see Codella et al. 2014a).
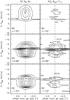 |
Fig. 8 From left to right: position-velocity diagrams of SO 98−87, and SO282,6−71,7 lines obtained perpendicular to the jet axis (PA = 112°) at the position of knots B2, B3, and R2. The distance of the knots from the driving MM1 protostar is indicated. The first contour is at 5σ (σ = 4 mJy for SO, and 1.5 mJy for SO2) with steps of 10σ (SO), and 5σ (SO2). |
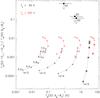 |
Fig. 9 SO line temperature ratio TR(SO 1011−1010)/TR(SO 98−87) versus intrinsic line temperature TR(SO 98−87) predicted by RADEX slab models at TK = 50, 500 K (black and red points/curves). Each curve corresponds to the labelled column density NSO/ ΔV increasing from 1012 to 1015 cm-2 (km s-1)-1 by factors of 10 (left to right). Each dot along the curves corresponds to the labelled log(nH2) (from 105 to 107 cm-3). Optically thin models are marked with a cross, and optically thick models with a star. The black points indicate the upper limit of the SO line ratio and the SO 98−87 intensity corrected for beam dilution in the B2, B3, and R2 knots over the HVjet velocity range. |
4.2. SO and SO2 abundance in the jet
To constrain the physical conditions of the gas and the SO abundance in the inner jet knots (B3, B2, and R2), the observed SO line intensities (corrected for beam dilution) and ratios (independent of beam dilution) are compared with the predictions of the statistical equilibrium, one-dimensional radiative transfer code RADEX adopting plane parallel slab geometry (van der Tak et al. 2007). Figure 9 shows the SO line temperature ratio, TR(SO 1011−1010)/TR(SO 98−87), versus the SO 98−87 intrinsic line temperature, TR(SO 98−87), predicted by RADEX for a reasonable range of kinetic temperatures (TK = 50−500 K) and H2 densities (nH2 from 105 to 107 cm-3) (e.g. Cabrit et al. 2007) and for SO column densities (NSO/ ΔV) increasing from 1012 to 1015 cm-2 (km s-1)-1. The model predictions are compared with the observed line ratios and line intensities corrected for beam dilution. As discussed in Sect. 3.3, for velocities higher than ~8 km s-1 with respect to systemic the SO emission is co-spatial with that of CO 3−2 and SiO 8−7, indicating that SO originate in the collimated molecular jet with no contamination from the surrounding outflow and cloud. Therefore, the SO ratios and intensity are measured in the jet high-velocity range defined as: HVjet = [ −8,−15 ] km s-1 for knots B3 and B2 and HVjet = [ + 10, + 15 ] km s-1 for knot R2. The different velocity range defined for R2 is to avoid the strong absorption feature around + 9 km s-1 when comparing with the CO 3−2 emission. As discussed by Lee et al. (2007a) and Cabrit et al. (2012), this feature is present at all positions and may be caused by an extended foreground component fully resolved out by interferometers. The SO 1011−1010 line is not detected in the jet knots, hence we report the upper limit of the considered SO line ratio. The SO line ratios do not depend on the assumed beam filling factor, as long as both lines trace the same volume of gas. The observed SO 98−87 line intensity, Tmb, is corrected for beam dilution, as the jet of width is broadened by a factor ~2 by beam convolution across the jet. The errorbars on the SO line intensity in Fig. 9 accounts for the range of intensity values over HVjet, and for possible beam dilution along the jet axis (a factor ~3 if the knot is circular, see also Cabrit et al. 2007).
Beam-averaged column densities and abundances of SO, SO2, and CO in the jet knots B2, B3, and R2.
Properties of the knots along the HH 212 jet.
Figure 9 shows that the avalaible SO observations do not allow for constraining the density and temperature of the emitting gas. However, for the considered temperatures and H2 densities the observations are in agreement with the model predictions for column densities NSO/ ΔV ~ 1013−1014 cm-2 (km s-1)-1. For these values of the column density, the emission in the considered SO lines is optically thin.
If the density is sufficiently high, i.e. for nH2 larger than a few 106 cm-3, the emission is also in local thermodynamic equilibrium (LTE). In this case, an estimate of the beam-averaged SO column density in the inner jet knots can be derived from the SO 98−87 line intensity integrated over the high-velocity range HVjet assuming optically thin and thermalised emission at TK ~ Tex = 50−500 K. Following Cabrit et al. (2012), the beam-averaged CO column density is also derived from the CO 3−2 intensity integrated on the same velocity range as for SO assuming optically thin, LTE emission. The latter assumption is not valid for knot B2 where the ratio between the CO 3−2 and SiO 8−7 emission is ~1 over the HVjet velocity range. This indicates that both lines are optically thick. Therefore, for knot B2 the derived CO column density is a lower limit. Then, the abundance of SO is derived as XSO = XCO × NSO/NCO, where the abundance of CO with respect to H2 is assumed to be XCO = NCO/NH2 = 10-4. The main uncertainty in the estimated column densities and abundances is because of the assumption on the gas temperature, therefore we report a range of values corresponding to the temperature values TK ~ Tex = 50−500 K. Moreover, if the density in the jet is lower than a few 106 cm-3, the SO 98−87 line is sub-thermally excited implying higher SO column densities. In particular, assuming nH2 = 3 × 105 cm-3, the SO column densities and abundances estimated using RADEX are from a factor 2 (for TK = 500 K) to a factor 4 (for TK = 50 K) larger than in the LTE-optically thin case.
The SO282,6−71,7 emission is much fainter and covers lower velocities than SO, therefore it is not possible to compare its PV with that of CO 3−2 (see Fig. 2). However, based on the intensity profiles shown in Fig. 4, we tentatively assume that SO2 and CO 3−2 emission probe the same jet component over the velocity range HVjet = [ −8, −10 ] km s-1 in knots B3 and B2 and that both are optically thin and thermalised. Based on these assumptions, the column density and abundance of SO2 are inferred by applying the same method as for SO. The main source of error in the estimated SO2 column densities and abundances is due to the assumed gas temperature, therefore we report a range of values for TK ~ Tex = 50−500 K. As for SO, if the density in the jet is lower than a few 106 cm-3, the SO2 line is sub-thermally excited. In that case, using RADEX with nH2 = 3 × 105 cm-3 and Tex = 50−500 K, we obtain a factor 2 to 4 higher column densities and abundances.
The SO, SO2, and CO line intensities integrated over the high-velocity range HVjet in the inner jet knots (B3, B2, and R2) are reported in the last column of Table 2, while the column densities and abundances estimated assuming LTE-optically thin emission are summarised in Table 3. The SO abundance in the high-velocity jet of HH 212 (XSO ~ 10-7−2 × 10⁻⁶) is comparable to that estimated in other Class 0 jets, namely HH 211 (Lee et al. 2010), the extremely high-velocity (EHV) wings of the L1448-mm and IRAS 04166+2706 outflows (Tafalla et al. 2010), and the B1 and B2 bow shocks at the tip of the L1157 outflow cavity (Bachiller & Perez Gutierrez 1997). On the other hand, the ratio SO2/SO appears variable from jet to jet: we find SO2/ SO ~ 0.5−4 in HH 212, while it is around 1 in L1157, and < 0.1−0.3 in the L1448-mm and IRAS 04166+270 EHV gas.
Assuming a sulfur elemental abundance (S/H)⊙ ~ 1.38 × 10⁻⁵ (Asplund et al. 2005), these values indicate that from 1% up to 40% of the elemental S is in the form of SO and SO2 in the HH 212 jet. This represents an enhancement by a factor 10−100 with respect to SO and SO2 abundances in prestellar cores and protostellar envelopes (Bachiller & Perez Gutierrez 1997; Tafalla et al. 2010).
An enhancement of SO and SO2 up to ≃ 10-7−10-6 is predicted by models of magnetised molecular C-shocks, as a result of neutral-neutral reactions in the shock-heated gas (Pineau des Forets et al. 1993) and sputtering of H2S-rich icy grain mantles (Flower & Pineau des Forets 1994). The formation of SO2 by oxydation of SO is predicted to occur late in the post-shock, hence the ratio of SO2/SO would be an indicator of shock age (see e.g. Fig. 7 of Flower & Pineau des Forets 1994). In the case of HH 212, the ratio SO2/ SO ≥ 0.5 that we observe seems inconsistent with the very short dynamical timescale of 15−30 yr of the knots. This high ratio at early times would require that SO2 is mainly released from grain mantles rather than formed in the gas phase out of SO as assumed in published shock models. Observations of other sulfur-bearing species, such as CS, OCS, H2S, H2CS, are crucial to constrain the sulfur chemistry and obtain an accurate estimate of the sulphur released in the gas phase in shocks (e.g. Podio et al. 2014). Alternatively to shocks, high SO and SO2 abundances up to 10-6 are predicted at the turbulent interface between the outflow and the surrounding cloud material (Viti et al. 2002). SO and SO2 is also strongly enhanced in an MHD disk wind because of the thermal sublimation of icy mantles near the source and the gradual heating by ambipolar diffusion during MHD acceleration (Panoglou et al. 2012). Detailed comparison with the models will be the subject of a future paper (Tabone et al., in prep.).
4.3. Jet physical and dynamical properties: H2 density and mass-loss rate
From the beam-averaged CO column density estimated in the HVjet range, NCO (see Table 3), one can infer the H2 column and volume density in the knots along the jet, NH2 and nH2, and the jet mass-loss rate, Ṁjet. The determination of these quantities relies on the assumption that CO 3−2 emission at high velocity is optically thin and traces all the emitting mass in the beam. As CO 3−2 in knot B2 is optically thick, the NH2, nH2, and Ṁjet values inferred for this knot are lower limits. First, the beam-averaged H2 column density is derived assuming XCO = NCO/NH2 = 10-4. Then, the H2 density is derived assuming that the jet is a cylinder uniformely filled by the observed gas. Hence, nH2 = (HPBWtr/ 2Rjet) × NH2/ 2Rjet, where 2Rjet is the jet width (~90 AU) and the factor (HPBWtr/ 2Rjet) accounts for the beam dilution of the ~90 AU jet emission in the transverse beam direction. Finally, the mass-loss rate is estimated assuming that the mass in the jet flows at constant density and speed along the jet axis over the beam length. The latter assumption is not fulfilled if the gas in the knots is highly compressed by shocks, therefore following Lee et al. (2007a,b), we correct the mass-loss rate for a compression factor of ~3. Based on the above assumptions, Ṁjet is calculated as Ṁjet = 1 / 3 × mH2 × (NCO/XCO) × HPBWtr × Vjet, where Vjet is the de-projected jet velocity in the considered HVjet range (Vjet ~ 165 km s-1) and HPBWtr is the beam size across the jet width ( ). Note that the correction for compression is uncertain, as it depends on the unknown shock parameters (magnetic field and shock speed), therefore the Ṁjet values are affected by a factor ~3 uncertainty. Moreover, the estimated mass-loss rate only accounts for the mass transported by the molecular jet component at high velocity (| V − Vsys | > 8 km s-1). The total jet mass-loss rate may be up to a factor of a few higher than the estimated value as the low velocity component can considerably contribute to the total mass-loss rate if it traces a slow wide angle wind rather than entrained ambient material (see, e.g. Maurri et al. 2014). If the jet is partially ionised, the atomic gas may further contribute to the mass-loss rate. However, Spitzer and Herschel observations of molecular jets driven by Class 0 sources indicate that the mass flux transported by the atomic component is about 10 times smaller than that carried by the molecular gas (Dionatos et al. 2009, 2010; Nisini et al. 2015). Hence, the atomic component of HH 212, if any, should not significatly contribute to the total jet mass-loss rate.
The inferred values of NH2, nH2, and Ṁjet for the B2, B3, and R2 knots are summarised in Table 4. These quantities are affected by the uncertainty in the NCO estimates, hence a range of values is given depending on the temperature assumed to derive NCO (Tex = 50, 500 K). As explained above, the Ṁjet values inferred for the molecular high-velocity jet component are a lower limit to the total jet mass-loss rate. Therefore, the mass flux transported by the jet (Ṁjet ≥ 0.2−2 × 10⁻⁶ M⊙ yr-1) is at least 3% to 33% of the envelope infall rate (Ṁinf ~ 6 × 10⁻⁶ M⊙ yr-1, Lee et al. 2006), indicating an high jet efficiency (Ṁjet/Ṁinf ≥ 0.03−0.3), in agreement with the young age of the source. The mass accretion rate from the disk onto the central source may be higher than the envelope infall rate. However, there are no estimates of the disk mass accretion rate for HH 212 as Class 0 sources like this one are too deeply embedded in their parental envelope to enable the use of well-calibrated accretion tracers such as, e.g., the Brγ line.
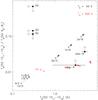 |
Fig. 10 SO line temperature ratio TR(SO 1011−1010)/TR(SO 98−87) versus intrinsic line temperature TR(SO 1011−1010) predicted by RADEX slab models at TK = 50, 500 K (black and red points/curves). Each curve corresponds to the labelled column density NSO/ ΔV increasing from 1015 to 2 × 1016 cm-2 (km s-1)-1 going from left to right. Each dot along the curves corresponds to the labelled log (nH2) (from 106.5 to ≥ 108 cm-3). Models for which the emission in the SO 1011−1010 is optically thin are marked with a cross, optically thick models with a star. The black points indicate the SO line ratio and the SO 1011−1010 line intensity (or their lower/upper limits) corrected for beam dilution in the B2, B3 and R2 knots and in the disk blue and red lobes. |
4.4. Disk properties: mass and SO abundance
An analysis similar to that performed in Sect. 4.2 is applied to constrain the gas physical conditions and the SO abundance in the disk. The observed SO 1011−1010 line intensity and the SO 1011−1010/SO 98−87 ratio in the blue and red disk lobes (HVdisk: | V − Vsys | = 1.9−3.5 km s-1, Codella et al. 2014a) are compared with the predictions of RADEX computed for TK = 50−500 K, H2 densities larger than 3 × 106 cm-3 and SO column densities NSO/ ΔV = 1015,5 × 1015,1016,2 × 1016 cm-2 (km s-1)-1. The observed SO 1011−1010 line intensity, Tmb, is corrected for beam dilution, as the emission from the compact disk lobes (Rdisk ~ 90 AU, i.e.  ) is strongly diluted in the
  beam (dilution factor ~8). The SO 98−87 emission at low velocities is heavily dominated by the outflow emission, hence the observed SO 1011−1010/SO 98−87 ratio is a lower limit to the SO line ratio in the disk. Figure 10 shows that, to reproduce the bright SO 1011−1010 emission, column densities of NSO/ ΔV ~ 1−2 × 1016 cm-2 (km s-1)-1 are required, i.e. two orders of magnitude larger than what estimated in the jet (NSO/ ΔV ~ 1014). In the considered models, the emission in the SO 98−87 line is optically thick (see also Fig. 9), while the emission in the SO 1011−1010 line is still optically thin. Moreover, volume densities are expected to be larger than 107 cm-3 in the disk (Lee et al. 2014), therefore we can assume that the line emission is thermalised.
Beam-averaged column densities and abundances of SO and C17O in the disk.
As the emission in the SO 1011−1010 is optically thin and thermalised, we estimate the SO column density in the disk by integrating the SO 1011−1010 line intensity on the velocity interval where the emission is consistent with a disk origin, HVdisk, and assuming TK ~ Tex = 50−500 K. Given its low abundance (XC17O = XCO/ 1792, Wilson & Rood 1994) and critical density the emission in the C17O 3−2 line is also assumed to be optically thin and thermalised at TK ~ Tex = 50−500 K and the C17O column density is inferred from the C17O 3−2 line intensity integrated on HVdisk as for SO. The SO 1011−1010 and C17O 3−2 line intensity integrated on HVdisk are reported in the last column of Table 2, while the estimated beam-averaged SO and C17O column densities are summarised in Table 5.
From the beam-averaged C17O column density, NC17O, we estimate the H2 column and volume density in the disk and its mass. The beam-averaged H2 column density is derived assuming XC17O = XCO/ 1792 and XCO = NCO/NH2 = 10-4. Then, as the disk is seen almost edge-on, the H2 density is 8 × NH2/Rdisk, where Rdisk ~ 90 AU and the factor 8 accounts for the beam dilution. Finally, the disk mass is obtained by integrating the beam-averaged C17O column density over the beam area, Abeam, and summing over the blue and red disk lobes: Mdisk ~ (1.4 × mH2 × (NC17O/XC17O) × Abeam)blue + red, where the factor 1.4 accounts for the mass in the form of helium.
Depending on the adopted temperature value, the estimated beam-averaged H2 column density and H2 volume density in the disk are NH2 ~ 0.4−2 × 1023 cm-2 and nH2 ~ 0.2−1 × 109 cm-3, where the lower and higher values correspond to Tex = 50, 500 K, respectively. The disk mass turns out to be ~ 0.002−0.013 M⊙. This value is close to the disk mass of 0.014 M⊙ estimated by Lee et al. (2014) from HCO+4−3. Hence, if C17O is tracing the same disk layer as HCO+, it is indeed optically thin and all in the gas phase in this region. More mass could be hidden in the dark disk mid-plane where molecules are frozen onto dust grains, so our estimate is only a lower limit to the total disk mass, i.e. Mdisk ≥ 0.002−0.013 M⊙.
Finally, we estimate the SO gas-phase abundance in the disk by assuming that SO 1011−1010 and C17O 3−2 originate from the same disk layer in the 1.9−3.5 km s-1 velocity range and that C17O is all in the gas phase in the considered disk-emitting region. Based on the above assumptions XSO = XC17O × NSO/NC17O ~ 10-8−10-7. This estimate would remain correct even if C17O is depleted onto grains, as long as SO and C17O are depleted by the same amount (and both optically thin). The estimated SO column density and abundance are much higher than that observed in evolved protoplanetary disks (NSO ≤ 1013 cm-2, XSO ≤ 10-11, Fuente et al. 2010; Dutrey et al. 2011) and may be due to an SO enhancement in the accretion shock at the envelope-disk interface as suggested by Lee et al. (2014) and Sakai et al. (2014). Alternatively, an high SO abundance (up to 10-6) is predicted by self-gravitating disk models because of the shocks occuring in the disk spirals caused by gravitational instabilities (Ilee et al. 2011; Douglas et al. 2013). Since the central star has a mass of only 0.2−0.3 M⊙ (Lee et al. 2014; Codella et al. 2014a), and our estimates of the disk mass do not include the mass reservoir frozen onto grains, this scenario is not excluded. However, the presented ALMA observations do not allow us to distinguish between these scenarios. The angular resolution () is too low to fully resolve the disk, therefore, the SO 1011−1010 line profile is averaged over a large portion of the disk impeding to detect SO enhancements as a function of velocity. Moreover, an edge-on view is not favourable to search for SO enhancements in a gravitationally unstable disk, as each line of sight would cross many spiral arms. This scenario could however be tested for less inclined Class 0 disks with higher resolution ALMA observations.
5. Conclusions
HH 212 is the prototype of the Class 0 jet and it has been the subject of a number of high angular resolution studies at mm wavelengths performed with the SMA and the PdBI (Lee et al. 2006, 2007a, 2008; Codella et al. 2007; Cabrit et al. 2007, 2012). The high sensitivity of the ALMA Cycle 0 observations allow us for the first time to simultaneously image the envelope, the outflow, the jet, and the inner compact disk (see also Lee et al. 2014; Codella et al. 2014a). In particular, the presented analysis of SO and SO2 emission show that these molecules probe different components in the inner ~1300 AU of the HH 212 protostellar system: (i) the circumstellar gas and the X-shaped cavity walls at systemic velocity; (ii) the poorly collimated gas (width ~135 AU) likely swept out by the high-velocity molecular jet at low velocities; (iii) the collimated (~90 AU) and fast (~100−200 km s-1) molecular jet at intermediate and high velocities; (iv) a compact structure with the blue- and the red-shifted peaks displaced roughly on the equatorial plane, which is consistent with an origin in the 90 AU disk rotating around a ~0.2−0.3 M⊙ star previously detected by Lee et al. (2014) and Codella et al. (2014a), in the high-excitation SO 1011−1010 line.
The high-velocity molecular jet detected in SO, SO2, CO, and SiO lines is dense (~ 105−106 cm-3) and transport a mass-loss rate Ṁjet ≥ 0.2−2 × 10⁻⁶ M⊙ yr-1, indicating a high ejection efficiency (Ṁjet/Ṁinf ≥ 0.03−0.3, for an infall rate of ~ 6 × 10⁻⁶ M⊙ yr-1, Lee et al. 2006). The abundance of SO in the jet is XSO ~ 10-7−10-6, similar to what is estimated in other Class 0 outflows and jets (e.g. Bachiller & Perez Gutierrez 1997; Tafalla et al. 2010; Lee et al. 2010), while XSO2/XSO ≥ 0.5. This indicates that between 1% and 40% of the elemental S has been converted into SO and SO2 in the shocks occuring along the jet or at the outflow-cloud interface (Pineau des Forets et al. 1993; Flower & Pineau des Forets 1994; Viti et al. 2002) and/or at the base of the wind because of ambipolar diffusion (Panoglou et al. 2012).
From C17O 3−2 emission we estimate a disk mass ≥ 0.002−0.013 M⊙, which is consistent with the estimate derived from HCO+ by Lee et al. (2014). The SO abundance in the disk (XSO ~ 10-8−10-7) is 3−4 orders of magnitude larger than is estimated in evolved protoplanetary disks (Fuente et al. 2010; Dutrey et al. 2011). This kind of an SO enhancement may be produced in the accretion shock occuring at the interface between the envelope and the disk, as suggested by Lee et al. (2014) and Sakai et al. (2014), or in spiral shocks if the disk is partly gravitationally unstable (Ilee et al. 2011; Douglas et al. 2013). Higher angular resolution and sensitivity observations are required to address the exact origin of the detected high-excitation SO emission.
The defined velocity intervals are the same as in Cabrit et al. (2007).
The jet half-opening angle is tan θmax = (R − 1) / (R + 1) × tan(i), where R is the algebrical ratio of maximum to minimum radial velocities and i the inclination with respect to the plane of the sky (see Codella et al. 2007).
Acknowledgments
L.P. has received funding from the European Union Seventh Framework Programme (FP7/2007−2013) under grant agreement No. 267251. This work was partly supported by the Italian Ministero dell’Istruzione, Universitá e Ricerca (MIUR) through the grants Progetti Premiali 2012 − iALMA (CUP C52I13000140001) and PRIN 2013 − JEDI. R.B. and M.T. gratefully acknowledge partial support from Spanish MINECO under Grant FIS2012-32096.
References
- Asplund, M., Grevesse, N., & Sauval, A. J. 2005, in Cosmic Abundances as Records of Stellar Evolution and Nucleosynthesis, ed. T. G. Barnes, III, & F. N. Bash, ASP Conf. Ser., 336, 25 [Google Scholar]
- Bacciotti, F., Ray, T. P., Mundt, R., Eislöffel, J., & Solf, J. 2002, ApJ, 576, 222 [NASA ADS] [CrossRef] [Google Scholar]
- Bachiller, R., & Perez Gutierrez, M. 1997, ApJ, 487, L93 [NASA ADS] [CrossRef] [Google Scholar]
- Cabrit, S., Codella, C., Gueth, F., et al. 2007, A&A, 468, L29 [NASA ADS] [CrossRef] [EDP Sciences] [Google Scholar]
- Cabrit, S., Codella, C., Gueth, F., & Gusdorf, A. 2012, A&A, 548, L2 [NASA ADS] [CrossRef] [EDP Sciences] [Google Scholar]
- Choi, M., Tatematsu, K., & Kang, M. 2010, ApJ, 723, L34 [NASA ADS] [CrossRef] [Google Scholar]
- Ciardi, A., & Hennebelle, P. 2010, MNRAS, 409, L39 [NASA ADS] [Google Scholar]
- Claussen, M. J., Marvel, K. B., Wootten, A., & Wilking, B. A. 1998, ApJ, 507, L79 [NASA ADS] [CrossRef] [Google Scholar]
- Codella, C., Cabrit, S., Gueth, F., et al. 2007, A&A, 462, L53 [NASA ADS] [CrossRef] [EDP Sciences] [Google Scholar]
- Codella, C., Cabrit, S., Gueth, F., et al. 2014a, A&A, 568, L5 [Google Scholar]
- Codella, C., Maury, A. J., Gueth, F., et al. 2014b, A&A, 563, L3 [NASA ADS] [CrossRef] [EDP Sciences] [Google Scholar]
- Coffey, D., Bacciotti, F., Woitas, J., Ray, T. P., & Eislöffel, J. 2004, ApJ, 604, 758 [NASA ADS] [CrossRef] [Google Scholar]
- Correia, S., Zinnecker, H., Ridgway, S. T., & McCaughrean, M. J. 2009, A&A, 505, 673 [NASA ADS] [CrossRef] [EDP Sciences] [Google Scholar]
- Davis, C. J., Berndsen, A., Smith, M. D., Chrysostomou, A., & Hobson, J. 2000, MNRAS, 314, 241 [NASA ADS] [CrossRef] [Google Scholar]
- Dionatos, O., Nisini, B., Garcia Lopez, R., et al. 2009, ApJ, 692, 1 [NASA ADS] [CrossRef] [Google Scholar]
- Dionatos, O., Nisini, B., Cabrit, S., Kristensen, L., & Pineau Des Forêts, G. 2010, A&A, 521, A7 [NASA ADS] [CrossRef] [EDP Sciences] [Google Scholar]
- Douglas, T. A., Caselli, P., Ilee, J. D., et al. 2013, MNRAS, 433, 2064 [NASA ADS] [CrossRef] [Google Scholar]
- Dutrey, A., Wakelam, V., Boehler, Y., et al. 2011, A&A, 535, A104 [NASA ADS] [CrossRef] [EDP Sciences] [Google Scholar]
- Ferreira, J., Dougados, C., & Cabrit, S. 2006, A&A, 453, 785 [NASA ADS] [CrossRef] [EDP Sciences] [Google Scholar]
- Flower, D. R., & Pineau des Forets, G. 1994, MNRAS, 268, 724 [NASA ADS] [CrossRef] [Google Scholar]
- Fuente, A., Cernicharo, J., Agúndez, M., et al. 2010, A&A, 524, A19 [NASA ADS] [CrossRef] [EDP Sciences] [Google Scholar]
- Guilloteau, S., Di Folco, E., Dutrey, A., et al. 2013, A&A, 549, A92 [NASA ADS] [CrossRef] [EDP Sciences] [Google Scholar]
- Ilee, J. D., Boley, A. C., Caselli, P., et al. 2011, MNRAS, 417, 2950 [NASA ADS] [CrossRef] [Google Scholar]
- Kwan, J., & Tademaru, E. 1988, ApJ, 332, L41 [NASA ADS] [CrossRef] [Google Scholar]
- Launhardt, R., Pavlyuchenkov, Y., Gueth, F., et al. 2009, A&A, 494, 147 [NASA ADS] [CrossRef] [EDP Sciences] [Google Scholar]
- Lee, C.-F., Ho, P. T. P., Beuther, H., et al. 2006, ApJ, 639, 292 [NASA ADS] [CrossRef] [Google Scholar]
- Lee, C.-F., Ho, P. T. P., Hirano, N., et al. 2007a, ApJ, 659, 499 [NASA ADS] [CrossRef] [Google Scholar]
- Lee, C.-F., Ho, P. T. P., Palau, A., et al. 2007b, ApJ, 670, 1188 [NASA ADS] [CrossRef] [Google Scholar]
- Lee, C.-F., Ho, P. T. P., Bourke, T. L., et al. 2008, ApJ, 685, 1026 [NASA ADS] [CrossRef] [Google Scholar]
- Lee, C.-F., Hirano, N., Palau, A., et al. 2009, ApJ, 699, 1584 [NASA ADS] [CrossRef] [Google Scholar]
- Lee, C.-F., Hasegawa, T. I., Hirano, N., et al. 2010, ApJ, 713, 731 [NASA ADS] [CrossRef] [Google Scholar]
- Lee, C.-F., Hirano, N., Zhang, Q., et al. 2014, ApJ, 786, 114 [NASA ADS] [CrossRef] [Google Scholar]
- Maurri, L., Bacciotti, F., Podio, L., et al. 2014, A&A, 565, A110 [NASA ADS] [CrossRef] [EDP Sciences] [Google Scholar]
- Maury, A. J., Belloche, A., André, P., et al. 2014, A&A, 563, L2 [NASA ADS] [CrossRef] [EDP Sciences] [Google Scholar]
- Murillo, N. M., Lai, S.-P., Bruderer, S., Harsono, D., & van Dishoeck, E. F. 2013, A&A, 560, A103 [NASA ADS] [CrossRef] [EDP Sciences] [Google Scholar]
- Nisini, B., Santangelo, G., Giannini, T., et al. 2015, ApJ, 801, 121 [NASA ADS] [CrossRef] [EDP Sciences] [Google Scholar]
- Panoglou, D., Cabrit, S., Pineau Des Forêts, G., et al. 2012, A&A, 538, A2 [NASA ADS] [CrossRef] [EDP Sciences] [Google Scholar]
- Pickett, H. M., Poynter, R. L., Cohen, E. A., et al. 1998, J. Quant. Spectr. Rad., 60, 883 [Google Scholar]
- Pineau des Forets, G., Roueff, E., Schilke, P., & Flower, D. R. 1993, MNRAS, 262, 915 [NASA ADS] [CrossRef] [Google Scholar]
- Podio, L., Lefloch, B., Ceccarelli, C., Codella, C., & Bachiller, R. 2014, A&A, 565, A64 [NASA ADS] [CrossRef] [EDP Sciences] [Google Scholar]
- Sakai, N., Sakai, T., Hirota, T., et al. 2014, Nature, 507, 78 [NASA ADS] [CrossRef] [Google Scholar]
- Tafalla, M., Santiago-García, J., Hacar, A., & Bachiller, R. 2010, A&A, 522, A91 [NASA ADS] [CrossRef] [EDP Sciences] [Google Scholar]
- Tobin, J. J., Hartmann, L., Chiang, H.-F., et al. 2012, Nature, 492, 83 [NASA ADS] [CrossRef] [PubMed] [Google Scholar]
- van der Tak, F. F. S., Black, J. H., Schöier, F. L., Jansen, D. J., & van Dishoeck, E. F. 2007, A&A, 468, 627 [NASA ADS] [CrossRef] [EDP Sciences] [Google Scholar]
- Viti, S., Natarajan, S., & Williams, D. A. 2002, MNRAS, 336, 797 [NASA ADS] [CrossRef] [Google Scholar]
- Wilson, T. L., & Rood, R. 1994, ARA&A, 32, 191 [NASA ADS] [CrossRef] [Google Scholar]
- Wiseman, J., Wootten, A., Zinnecker, H., & McCaughrean, M. 2001, ApJ, 550, L87 [NASA ADS] [CrossRef] [Google Scholar]
- Zinnecker, H., McCaughrean, M. J., & Rayner, J. T. 1998, Nature, 394, 862 [NASA ADS] [CrossRef] [PubMed] [Google Scholar]
All Tables
Properties of the observed emission lines on-source (MM1) and at the position of the knots along the jet.
Beam-averaged column densities and abundances of SO, SO2, and CO in the jet knots B2, B3, and R2.
All Figures
|
Fig. 1 Channel maps of SO 98−87 (top) and SO282,6−71,7 (bottom) at systemic, low (LV), intermediate (IV), and high (HV) velocities (panels from left to right). The green, blue, and red contours trace the emission at systemic velocity and over the labelled blue- and red-shifted velocity intervals (| V − Vsys |). The lowest contour of the emission at systemic velocity is shown in all panels. The first contour is at 5σ for SO and 3σ for SO2 with steps of 5σ (Vsys) and 20σ (LV, IV, HV) for SO and 3σ for SO2 (1σ ~ 3−4 mJy/beam/0.43 km s-1). The tilted black cross is centred at the source position and indicates the jet and the disk PA (PAjet = 22°, PAdisk = 112°). The ellipse in the bottom-left corner shows the beam HPBW of the line emission maps ( |
| In the text | |
|
Fig. 2 From left to right: position-velocity (PV) diagram of CO 3−2, SiO 8−7, SO 98−87, and SO282,6−71,7 lines obtained along the jet (PAjet = 22°, top) and the disk (PAdisk = 112°, bottom). Horizontal and vertical dashed lines mark Vsys = + 1.3 km s-1 and the continuum peak MM1. The red arrows on the SO282,6−71,7 PV indicate emission from complex organic molecules, which is blended with the SO2 emission at the source position. For CO 3−2, SiO 8−7, SO 98−87, SO282,6−71,7 the first contour is at 5σ (σ = 10 mJy for SiO, 4 mJy for SO, and 3 mJy for SO2) with steps of 10σ (CO, SiO, and SO), and 5σ (SO2). |
| In the text | |
|
Fig. 3 Left panels: PV of SO 98−87 emission along the jet PA (in red) is overplotted on SiO 8−7 and CO 3−2 PVs (in black, top, and bottom panels, respectively). Right panels: ratio of the SO 98−87 PV to the SiO 8−7 and CO 3−2 PV (top and bottom panels, respectively). The colour scale is logarithmic. |
| In the text | |
|
Fig. 4 Intensity profiles of SiO 8−7 (blue), SO 98−87 (red), and SO282,6−71,7 (orange) over CO 3−2 (grey) at the knots (B2, B3, R2) and source (MM1) positions. The name and distance of the knots and the normalisation factor to the CO 3−2 peak intensity are indicated at the top of the panels. The orange vertical arrows at the MM1 position indicate emission lines from complex organic molecules, which are blended to the SO2 line. |
| In the text | |
|
Fig. 5 Blue- and red- shifted emission of SO 1011−1010 at low velocities (| V − Vsys | < 1.9 km s-1, left panel) and in the higher velocity range where the emission is consistent with a rotating disk (HVdisk : 1.9 < | V − Vsys | < 3.5 km s-1, middle panel) is compared with C17O 3−2 emission in the HVdisk range (right panel, Codella et al. 2014a). The tilted black cross indicates the jet (PA = 22°) and the disk (PA = 112°) direction. The ellipse in the bottom left corner shows the beam HPBW of the line emission maps ( |
| In the text | |
|
Fig. 6 From left to right: position-velocity diagram of SO 1011−1010 obtained along the jet (PAjet = 22°, left) and the disk (PAdisk = 112°, right). Horizontal and vertical dashed lines mark Vsys = + 1.3 km s-1 and the continuum peak MM1. The first contour is at 6σ (1σ = 2 mJy) with steps of 0.5σ. On the PV along the disk the Keplerian curves for M∗ = 0.3 ± 0.1 M⊙ (solid and dashed black curves) and the r-1 curve for infalling gas with angular momentum conservation (red curve) are overplotted. |
| In the text | |
|
Fig. 7 Intensity profiles of SO 1011−1010 (grey) and C17O 3−2 (red) extracted at the source position. The horizontal bars in the bottom of the panel indicate the high-velocity range (HVdisk = 1.9−3.5 km s-1) where the lines are consistent with a disk origin (Codella et al. 2014a). The normalisation factor to the SO 1011−1010 intensity at peak (solid line) and in the blue-shifted HVdisk range (dotted line) are labelled on the top of the panel. |
| In the text | |
|
Fig. 8 From left to right: position-velocity diagrams of SO 98−87, and SO282,6−71,7 lines obtained perpendicular to the jet axis (PA = 112°) at the position of knots B2, B3, and R2. The distance of the knots from the driving MM1 protostar is indicated. The first contour is at 5σ (σ = 4 mJy for SO, and 1.5 mJy for SO2) with steps of 10σ (SO), and 5σ (SO2). |
| In the text | |
|
Fig. 9 SO line temperature ratio TR(SO 1011−1010)/TR(SO 98−87) versus intrinsic line temperature TR(SO 98−87) predicted by RADEX slab models at TK = 50, 500 K (black and red points/curves). Each curve corresponds to the labelled column density NSO/ ΔV increasing from 1012 to 1015 cm-2 (km s-1)-1 by factors of 10 (left to right). Each dot along the curves corresponds to the labelled log(nH2) (from 105 to 107 cm-3). Optically thin models are marked with a cross, and optically thick models with a star. The black points indicate the upper limit of the SO line ratio and the SO 98−87 intensity corrected for beam dilution in the B2, B3, and R2 knots over the HVjet velocity range. |
| In the text | |
|
Fig. 10 SO line temperature ratio TR(SO 1011−1010)/TR(SO 98−87) versus intrinsic line temperature TR(SO 1011−1010) predicted by RADEX slab models at TK = 50, 500 K (black and red points/curves). Each curve corresponds to the labelled column density NSO/ ΔV increasing from 1015 to 2 × 1016 cm-2 (km s-1)-1 going from left to right. Each dot along the curves corresponds to the labelled log (nH2) (from 106.5 to ≥ 108 cm-3). Models for which the emission in the SO 1011−1010 is optically thin are marked with a cross, optically thick models with a star. The black points indicate the SO line ratio and the SO 1011−1010 line intensity (or their lower/upper limits) corrected for beam dilution in the B2, B3 and R2 knots and in the disk blue and red lobes. |
| In the text | |
Current usage metrics show cumulative count of Article Views (full-text article views including HTML views, PDF and ePub downloads, according to the available data) and Abstracts Views on Vision4Press platform.
Data correspond to usage on the plateform after 2015. The current usage metrics is available 48-96 hours after online publication and is updated daily on week days.
Initial download of the metrics may take a while.