Fig. 2
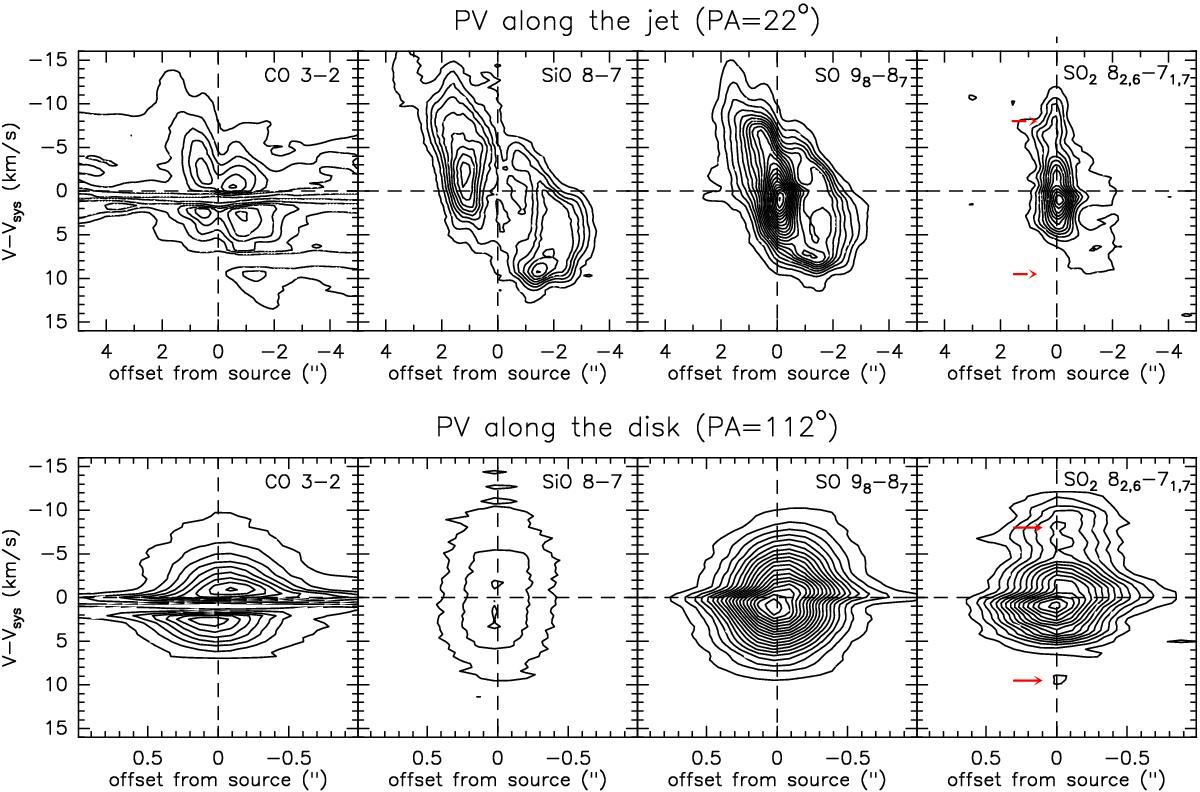
From left to right: position-velocity (PV) diagram of CO 3−2, SiO 8−7, SO 98−87, and SO282,6−71,7 lines obtained along the jet (PAjet = 22°, top) and the disk (PAdisk = 112°, bottom). Horizontal and vertical dashed lines mark Vsys = + 1.3 km s-1 and the continuum peak MM1. The red arrows on the SO282,6−71,7 PV indicate emission from complex organic molecules, which is blended with the SO2 emission at the source position. For CO 3−2, SiO 8−7, SO 98−87, SO282,6−71,7 the first contour is at 5σ (σ = 10 mJy for SiO, 4 mJy for SO, and 3 mJy for SO2) with steps of 10σ (CO, SiO, and SO), and 5σ (SO2).
Current usage metrics show cumulative count of Article Views (full-text article views including HTML views, PDF and ePub downloads, according to the available data) and Abstracts Views on Vision4Press platform.
Data correspond to usage on the plateform after 2015. The current usage metrics is available 48-96 hours after online publication and is updated daily on week days.
Initial download of the metrics may take a while.