Fig. 9
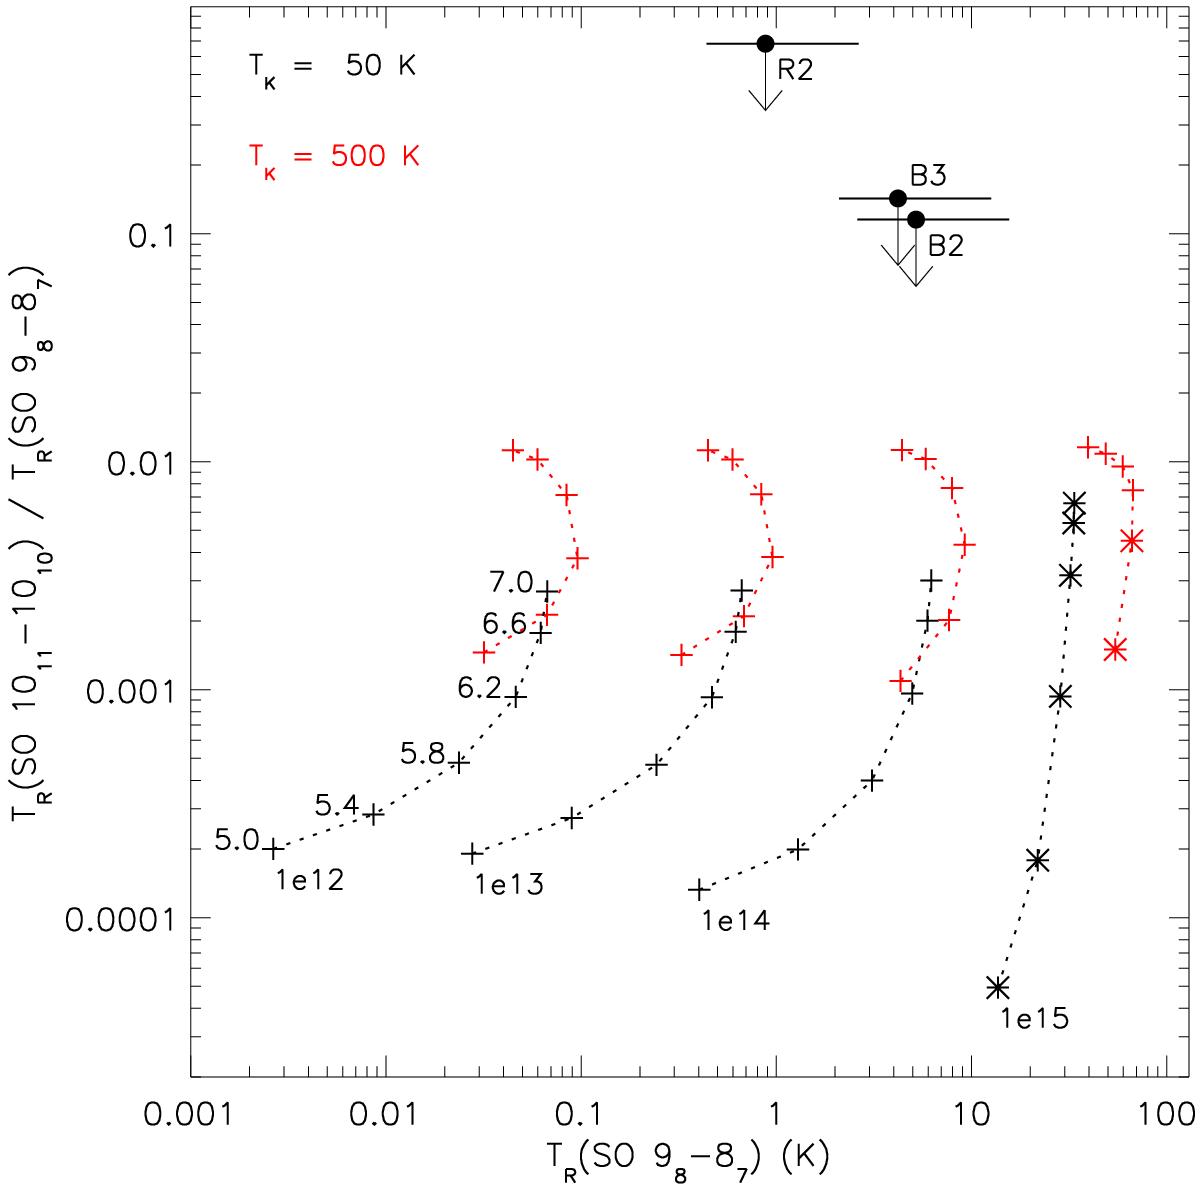
SO line temperature ratio TR(SO 1011−1010)/TR(SO 98−87) versus intrinsic line temperature TR(SO 98−87) predicted by RADEX slab models at TK = 50, 500 K (black and red points/curves). Each curve corresponds to the labelled column density NSO/ ΔV increasing from 1012 to 1015 cm-2 (km s-1)-1 by factors of 10 (left to right). Each dot along the curves corresponds to the labelled log(nH2) (from 105 to 107 cm-3). Optically thin models are marked with a cross, and optically thick models with a star. The black points indicate the upper limit of the SO line ratio and the SO 98−87 intensity corrected for beam dilution in the B2, B3, and R2 knots over the HVjet velocity range.
Current usage metrics show cumulative count of Article Views (full-text article views including HTML views, PDF and ePub downloads, according to the available data) and Abstracts Views on Vision4Press platform.
Data correspond to usage on the plateform after 2015. The current usage metrics is available 48-96 hours after online publication and is updated daily on week days.
Initial download of the metrics may take a while.