Fig. 1
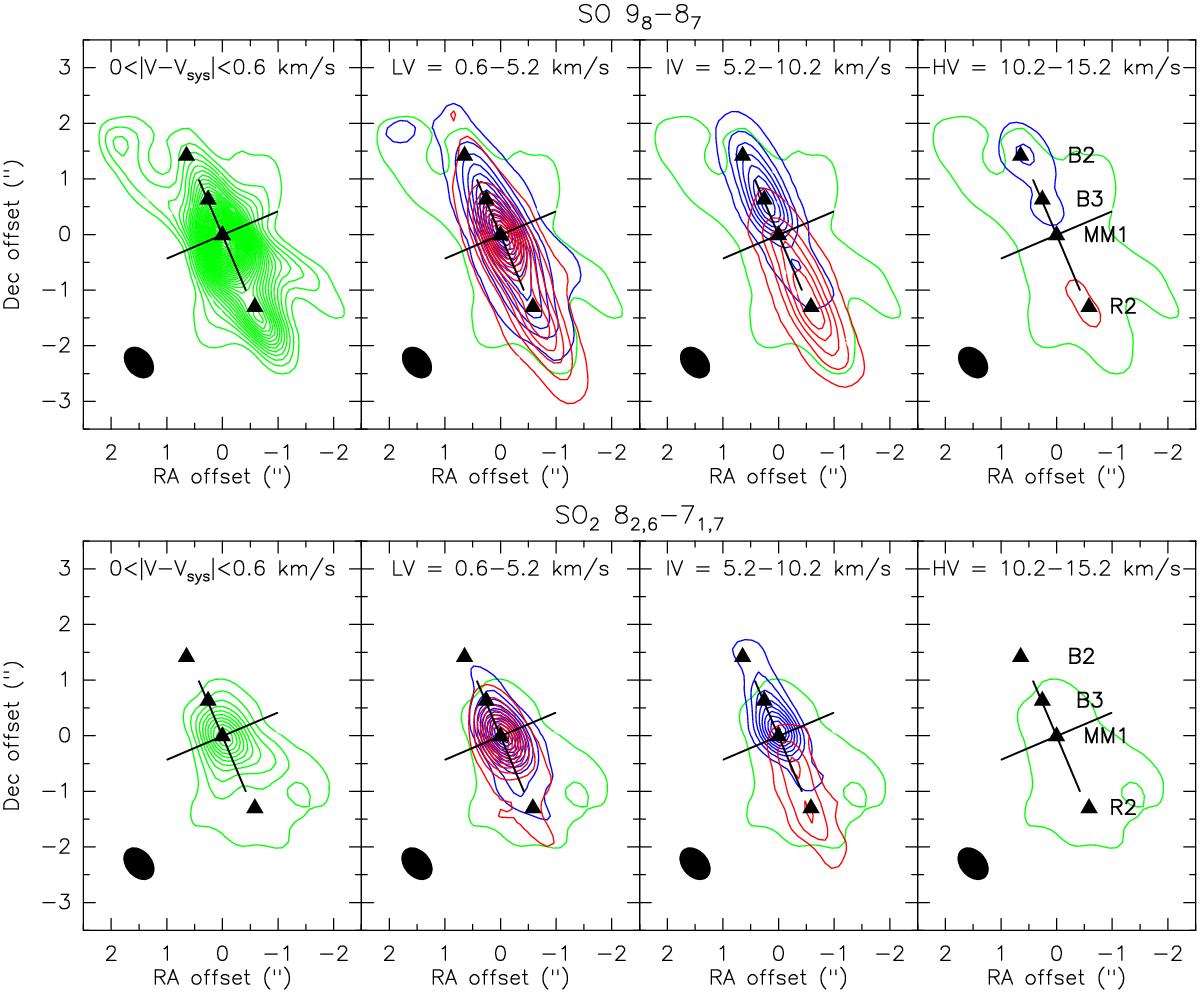
Channel maps of SO 98−87 (top) and SO282,6−71,7 (bottom) at systemic, low (LV), intermediate (IV), and high (HV) velocities (panels from left to right). The green, blue, and red contours trace the emission at systemic velocity and over the labelled blue- and red-shifted velocity intervals (| V − Vsys |). The lowest contour of the emission at systemic velocity is shown in all panels. The first contour is at 5σ for SO and 3σ for SO2 with steps of 5σ (Vsys) and 20σ (LV, IV, HV) for SO and 3σ for SO2 (1σ ~ 3−4 mJy/beam/0.43 km s-1). The tilted black cross is centred at the source position and indicates the jet and the disk PA (PAjet = 22°, PAdisk = 112°). The ellipse in the bottom-left corner shows the beam HPBW of the line emission maps (![]() , PA = 49°). The triangles indicate the emission peaks along the blue and red lobes.
, PA = 49°). The triangles indicate the emission peaks along the blue and red lobes.
Current usage metrics show cumulative count of Article Views (full-text article views including HTML views, PDF and ePub downloads, according to the available data) and Abstracts Views on Vision4Press platform.
Data correspond to usage on the plateform after 2015. The current usage metrics is available 48-96 hours after online publication and is updated daily on week days.
Initial download of the metrics may take a while.