| Issue |
A&A
Volume 580, August 2015
|
|
|---|---|---|
| Article Number | A116 | |
| Number of page(s) | 13 | |
| Section | Extragalactic astronomy | |
| DOI | https://doi.org/10.1051/0004-6361/201425351 | |
| Published online | 13 August 2015 | |
Hα3: an Hα imaging survey of HI selected galaxies from ALFALFA
VI. The role of bars in quenching star formation from z = 3 to the present epoch⋆
1
Università degli Studi di Milano-Bicocca, Piazza della Scienza 3, 20126
Milano, Italy
e-mail:
This email address is being protected from spambots. You need JavaScript enabled to view it.
2
INFN, Sezione di Milano-Bicocca, Piazza della Scienza 3, 20126
Milano,
Italy
3
Universitäts-Sternwarte München, Schenierstrasse 1, 81679
München,
Germany
4
Max-Planck-Institut für Extraterrestrische Physik,
Giessenbachstrasse,
85748
Garching,
Germany
e-mail:
This email address is being protected from spambots. You need JavaScript enabled to view it.
5
Institute for Computational Cosmology, Department of Physics,
Durham University, South
Road, Durham,
DH1 3LE,
UK
e-mail:
This email address is being protected from spambots. You need JavaScript enabled to view it.
6
Carnegie Observatories, 813 Santa Barbara Street, Pasadena, CA
91101,
USA
7
Centre for Astrophysics and Supercomputing, Swinburne University
of Technology, Hawthorn, Victoria
3122,
Australia
8
Aix Marseille Université, CNRS, LAM (Laboratoire d’Astrophysique
de Marseille) UMR 7326, 13388
Marseille,
France
9
Instituto de Astronomía, Universidad Nacional Autónoma de
Mexico, Carretera Tijuana-Ensenada,
km 103, 22860
Ensenada, B.C., Mexico
10
Instituto de Astronomía, Universidad Nacional Autónoma de
Mexico, Apartado Postal
70-264, 04510
México D.F.,
Mexico
11
Center for Radiophysics and Space Research, Space Science
Building, Ithaca,
NY, 14853, USA
Received: 17 November 2014
Accepted: 25 May 2015
Abstract
A growing body of evidence indicates that the star formation rate per unit stellar mass (sSFR) decreases with increasing mass in normal main-sequence star-forming galaxies. Many processes have been advocated as being responsible for this trend (also known as mass quenching), e.g., feedback from active galactic nuclei (AGNs), and the formation of classical bulges. In order to improve our insight into the mechanisms regulating the star formation in normal star-forming galaxies across cosmic epochs, we determine a refined star formation versus stellar mass relation in the local Universe. To this end we use the Hα narrow-band imaging follow-up survey (Hα3) of field galaxies selected from the HI Arecibo Legacy Fast ALFA Survey (ALFALFA) in the Coma and Local superclusters. By complementing this local determination with high-redshift measurements from the literature, we reconstruct the star formation history of main-sequence galaxies as a function of stellar mass from the present epoch up to z = 3. In agreement with previous studies, our analysis shows that quenching mechanisms occur above a threshold stellar mass Mknee that evolves with redshift as ∝ (1 + z)2. Moreover, visual morphological classification of individual objects in our local sample reveals a sharp increase in the fraction of visually classified strong bars with mass, hinting that strong bars may contribute to the observed downturn in the sSFR above Mknee. We test this hypothesis using a simple but physically motivated numerical model for bar formation, finding that strong bars can rapidly quench star formation in the central few kpc of field galaxies. We conclude that strong bars contribute significantly to the red colors observed in the inner parts of massive galaxies, although additional mechanisms are likely required to quench the star formation in the outer regions of massive spiral galaxies. Intriguingly, when we extrapolate our model to higher redshifts, we successfully recover the observed redshift evolution for Mknee. Our study highlights how the formation of strong bars in massive galaxies is an important mechanism in regulating the redshift evolution of the sSFR for field main-sequence galaxies.
Key words: galaxies: evolution / galaxies: fundamental parameters / galaxies: star formation
Based on observations taken at the observatory of San Pedro Martir (Baja California, Mexico), belonging to the Mexican Observatorio Astronómico Nacional.
© ESO, 2015
1. Introduction
Unlike starburst galaxies, normal star-forming galaxies inhabit the main sequence at all redshifts (e.g., Noeske et al. 2007; Elbaz et al. 2011). Among local main-sequence galaxies, the dependence of the star formation rate on the stellar mass is still debated in the literature. In other words, it has not yet been determined whether the specific star formation rate (sSFR) decreases with increasing stellar mass (a process also known as mass quenching or downsizing, Cowie et al. 1996; Gavazzi et al. 1996; Boselli et al. 2001; Fontanot et al. 2009; Gavazzi 2009; Huang et al. 2012) or whether these two quantities are nearly proportional at all masses (e.g., Peng et al. 2010). A broader consensus exists instead on the quenching of massive main-sequence galaxies at higher redshift, where massive galaxies are seen to evolve more rapidly (e.g., Whitaker et al. 2014; Ilbert et al. 2015) than their less-massive counterparts. However, some tension remains between the observations and the current models and simulations of galaxy evolution (Fontanot et al. 2009; Weinmann et al. 2009, 2012; Henriques et al. 2013; Boylan-Kolchin et al. 2012; Hirschmann et al. 2014) emphasizing that the physics of the quenching of star formation is still not fully understood. The nature of the physical processes responsible for this mass quenching is still under debate (Peng et al. 2012; Lilly et al. 2013).
Several mechanisms are often invoked, including active galactic nucleus (AGN) feedback (e.g., Scannapieco et al. 2005; Bundy et al. 2008; Oppenheimer et al. 2010; Tessier et al. 2011); cosmological starvation (e.g., Feldmann & Mayer 2015; Fiacconi et al. 2015); and formation of kinematically hot spheroidal structures such as classical bulges, which are thought to form through rapid merger events (e.g., Aguerri et al. 2001) or multiple coalescence of giant clumps in primordial disks (e.g., Elmegreen et al. 2008). The final word on the relative importance of these (or other) quenching processes has not been spoken yet.
In this paper, starting from Sect. 2, we exploit the recently completed Hα3 survey in the Coma supercluster (see the accompanying Paper V of this series; Gavazzi et al. 2015) and in the Local supercluster (Gavazzi et al. 2012, Paper I) to add a further piece of evidence in support of a significant quenching of star formation at masses M∗>Mknee ≈ 109.5 M⊙ for local, normal late-type galaxies. In Sect. 3 we also show that the threshold mass Mknee for the quenching increases with redshift. By exploiting the low redshift nature of our sample for which visual morphological classification can be obtained, we show that the occupation fraction of visually classified strong bars drops drastically for M∗ ≲ Mknee (Sect. 4). With the aid of numerical and analytical arguments, in Sect. 5, we develop a simple, observationally driven argument to explain the existence of a threshold mass for the formation of strong bars, which in turn contributes to the observed quenching. This model also predicts the observed redshift-dependence of Mknee. Discussion and conclusions follow in Sects. 6 and 7.
2. Star formation rate at z = 0
The sample of star-forming galaxies at z = 0 used in this work consists of 1399 galaxies HI-selected primarily from ALFALFA (Haynes et al. 2011) in the regions of the Local supercluster and in the Coma supercluster. These are complemented with pointed HI observations of late-type galaxies taken at similar sensitivity in the region of the Coma supercluster not covered by ALFALFA (as listed in the GOLDMine database of Gavazzi et al. 2003, 2014). Gavazzi et al. (2008, 2013a) showed that ALFALFA selected galaxies are genuine star-forming objects (late-type galaxies, LTGs) with almost no contamination from S0s and S0as (see also Buat et al. 2014 for a discussion on the selection criteria of star-forming galaxies). Among these, 1091 were followed up with Hα imaging observations to derive their global SFRs (Gavazzi et al. 2015, Paper V). The Hα luminosity was corrected for Galactic extinction, deblending from [NII], and internal extinction following Lee et al. (2009). Throughout this series (including Paper V), stellar masses M∗ and SFRs have been computed assuming a Salpeter initial mass function (IMF), following the calibrations of Kennicutt (1998). In this paper, however, we compare results from our survey with literature values. We therefore recompute both stellar masses and SFR assuming a Chabrier IMF, as commonly done in the modern literature. Specifically, the transformations applied to the Hα3 survey are SFRChabrier = 1.5 × SFRSalpeter and log (M∗/M⊙) = −0.963 + 1.032 (g − i) + log (Li/L⊙), following Zibetti et al. (2009).
The Hα3 survey also includes galaxies in proximity and inside the rich Coma and Virgo clusters. The present study focuses on unperturbed galaxies, which we select to avoid environmental quenching effects (see Gavazzi et al. 2013b). To this purpose, we do not include in our analysis galaxies with HI-deficiency parameters greater than 0.31.
In addition to the cut based on HI deficiency, we wish to remove any possible residual environmental effects, such as sSFR quenching in high-density environments (e.g., Poggianti et al. 1999; Lewis et al. 2002; Balogh et al. 2004; Patel et al. 2009; Boselli & Gavazzi 2006, 2014). Following Gavazzi et al. (2010) we measured around all galaxies (in the Local and Coma superclusters irrespective of their type and HI content) a density contrast δ1,1000, computed within a cylinder of 1 h-1 Mpc radius and 1000 km s-1 half-length. We repeated the analysis shown in Fig. 1 by including only galaxies with δ1,1000< 20, this time avoiding the cores of the rich clusters Virgo, A1367 and Coma. Except for a marginal decrease in the number of objects below M∗ = 108.5 M⊙, no differences are seen at high mass that could explain the observed decrease of the sSFR as being due to environmental mechanisms.
With this selection, and combining two local samples in the Local and Coma superclusters, we obtain a final sample of 864 galaxies. The derived SFRs are plotted in Fig. 1a and listed in Table 1 as a function of stellar mass.
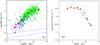 |
Fig. 1 Panel a) star formation rate as a function of stellar mass at z = 0 for HI non-deficient galaxies. Green symbols represent galaxies in the Coma supercluster; blue symbols are in the Local supercluster. Red symbols are averages in bins of stellar mass. The derived star formation rate are computed from the Hα luminosity assuming a Chabrier IMF. The two green (blue) diagonal lines represent the selection bias on the SFR induced by the limited sensitivity of ALFALFA at the distance of Coma (Virgo), computed for galaxies with inclination of 10 and 45 degrees respectively. Panel b) specific star formation rate as a function of stellar mass at z = 0. Average values from our local sample (Coma+Virgo) are given with red dots with error bars. Orange points are from Huang et al. (2012) and cyan points are from Brinchmann et al. (2004) (SDSS at z = 0). The blue points are taken in the interval 0.05 <z< 0.08 from Bauer et al. (2013). All sets of points show remarkable consistency above 109.5 M⊙. |
The flux limit of ALFALFA translates into a selection effect in the HI mass, which depends on galaxy inclination (see Giovanelli et al. 2005). At the distance of Virgo, this limit is log (MHI/M⊙) = 7.25–7.54, computed for inclinations of 10 and 45 degrees, respectively. As discussed in Gavazzi et al. (2015), this selection threshold does not hamper the detection of normal gas-rich galaxies with typical stellar masses as low as 107 M⊙. This sensitivity limit is, however, 25 times worse at the distance of Coma, being log (MHI/M⊙) = 8.78–9.08. Owing to this shallower selection, only an incomplete set of LTG galaxies at the distance of Coma are detected by ALFALFA and have been followed up by Hα3. The galaxies included in our study are therefore the most HI-rich objects, which means that the corresponding SFRs are generally biased towards high values. The two diagonal lines in Fig. 1a show this selection effect for Coma and for Virgo. Because of this bias, the slope of the SFR versus mass relation is significantly flatter for Coma than for the Local supercluster. Conversely, one can note how this latter subsample is not hampered by the ALFALFA selection bias, but it suffers instead from an undersampling at the highest mass bin, owing to a lack of surveyed volume. However, the two subsamples are complementary, and the underlying SFR versus mass relation can be obtained by combining them together. The mean SFRs in bins of stellar mass for this combined sample is shown in Fig. 1a. Here, we also show that the SFR of star-forming galaxies (main-sequence galaxies) in the local Universe is inconsistent with a single power law (a slope of nearly unity), but shows a decreasing slope with increasing mass.
Figure 1b shows the specific SFR derived from our data. Another set of local HI-selected galaxies in the entire ALFALFA survey by Huang et al. (2012) is shown. Although it is derived with a different SFR indicator based on UV luminosity corrected for IR, this second sample is remarkably consistent with our data. Additionally, we show a third sample of star-forming galaxies from Brinchmann et al. (2004), derived in the local Universe using SDSS data corrected for aperture effects. Finally we show a set of local data (obtained at 0.05 <z< 0.08) from the GAMA survey by Bauer et al. (2013). Despite the different selections and indicators, all local determinations are in reasonable mutual agreement. Although not shown in Fig. 1b, we note that the SFR versus stellar mass relation derived by Peng et al. (2010) using SDSS data is inconsistent with that found in other local samples, mainly because it does not show a change of slope above some turnover mass. We think this is due to the choice of Peng et al. (2010) to restrict their star-forming sample to galaxies showing strong emission lines in the nuclear spectra, thus biasing the selection towards starbursting objects. Similar inconsistency with Peng et al. (2010) is reported in Bauer et al. (2013) in their determination of the local SFR from the GAMA survey.
Star formation sequence at z = 0.
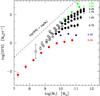 |
Fig. 2 Star formation rate as a function of stellar mass in bins of redshift. Data at z = 0 (red) are from this work (red symbols in Fig. 1). Data at z = 0.3 (blue) are from Bauer et al. (2013). Measurements in the interval 0.75 <z< 2.25 (black) are from Whitaker et al. (2014) (empty circles are for mass bins where individual galaxies were stacked when deriving IR luminosities); the points at z = 3 and z = 4.25 (green) are from Schreiber et al. (2015). Whitaker et al. (2014) and Schreiber et al. (2015) data are plotted above their respective completeness limit. |
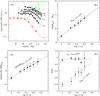 |
Fig. 3 Panel a) specific star formation rate as a function of stellar mass in bins of redshift. For all redshift bins the data are fitted with a broken power law with slope alow, holding below a critical mass (Mknee), and ahigh holding above Mknee (see Table 2). The blue line connects the loci of Mknee for the various redshifts. Panel b) position of the Mknee as a function of log (1 + z). Panel c) specific star formation at Mknee. Panel d) slope below and above Mknee (alow and ahigh). The position of Mknee and the specific SFR at Mknee increase approximately as (1 + z)2, while the mass quenching (given by ahigh) becomes less efficient with increasing redshift. |
3. The SFR as a function of redshift
In this section we extend the analysis to the SFR from z = 0 up to z ~ 4. Figure 2 gives the SFR as a function of stellar mass in bins of increasing z. The local data from this work (red) are taken from Fig. 1. Data at z = 0.3 are from the GAMA survey by Bauer et al. (2013). Data in the 0.75, 1.25, 1.75, 2.25 redshift bins are from Whitaker et al. (2014), who selected star-forming galaxies using the UVJ diagram (Williams et al. 2009). Their SFR are derived combining UV and IR luminosities from the deep CANDELS+3DHST surveys (Skelton et al. 2014) to account for obscured and unobscured star formation. This is currently among the best indicators of star formation at high-z (Wuyts et al. 2011). At even higher redshift (z = 3 and z = 4.25) we show the recent measurements by Schreiber et al. (2015), who adopt the same SFR indicator computed using Far-IR Herschel calibrated SFRs complemented by the UV luminosity from spectral energy distribution fitting. A line of proportionality between SFR and mass (exponential stellar mass growth) is given to guide the eye.
Figure 3 is derived from Fig. 2 after computing the sSFR at each redshift. This figure highlights that in most redshift bins (except for z = 2.25) the specific SFR is constant up to a characteristic stellar mass (Mknee), beyond which it decreases steeply with increasing stellar mass (Kauffmann et al. 2003). In other words main-sequence star-forming galaxies above Mknee have their sSFR suppressed compared to the lower mass systems. Still, they remain classified as UVJ active galaxies, i.e., they are only partially quenched, and should not be confused with a passive population.
Similarly to the analysis by Whitaker et al. (2014), we fit to the sSFR versus mass relation a broken power law of the form ![Mathematical equation: \begin{equation} \log {\rm s}{\it SFR} = a [\log (M_*/M_\odot)-\log(M_{\rm knee}/M_\odot)]+b, \end{equation}](/articles/aa/full_html/2015/08/aa25351-14/aa25351-14-eq36.png) (1)where a = alow for M∗<Mknee and a = ahigh for M∗ ≥ Mknee. In this equation, b represents the sSFR at Mknee. During the fit a, b, and Mknee are kept as free parameters, and the best-fit value is given in Table 2. The resulting functions, which are plotted in Fig. 3a, are found to be consistent with the results of Whitaker et al. (2014), even though we have kept Mknee as a free parameter. Our approach allows for the study of the dependence of Mknee on redshift, which is found to be consistent with a scaling-relation Mknee ∝ (1 + z)2 as is shown in Fig. 3b2. This implies that any quenching mechanism at work within the main sequence becomes effective above some mass threshold, which decreases by more than a factor of 10 from z = 3 to the present. We emphasize that, by construction, our analysis is insensitive to quenching mechanisms that would remove galaxies from the star-forming sequence altogether, while it is sensitive to those mechanisms that perturb only in part the SFRs of main-sequence galaxies. Figure 3c shows how the sSFR evaluated at Mknee scales with redshift, implying that the typical sSFR of the main sequence depends on z at the 1.65th power. In turn, this implies a decrease by more than one order of magnitude of the mean sSFR from z = 4 to z = 0 for normal (unquenched) galaxies. Figure 3d shows the dependence on redshift of the slope of the sSFR versus mass relation below (alow) and above (ahigh ) Mknee. The parameter alow is independent of redshift, while ahigh increases as (1 + z)0.88: i.e., the main sequence of unquenched galaxies exists at all redshifts, but the effects of quenching are less severe with increasing redshift. This is in agreement with the findings of Whitaker et al. (2014).
(1)where a = alow for M∗<Mknee and a = ahigh for M∗ ≥ Mknee. In this equation, b represents the sSFR at Mknee. During the fit a, b, and Mknee are kept as free parameters, and the best-fit value is given in Table 2. The resulting functions, which are plotted in Fig. 3a, are found to be consistent with the results of Whitaker et al. (2014), even though we have kept Mknee as a free parameter. Our approach allows for the study of the dependence of Mknee on redshift, which is found to be consistent with a scaling-relation Mknee ∝ (1 + z)2 as is shown in Fig. 3b2. This implies that any quenching mechanism at work within the main sequence becomes effective above some mass threshold, which decreases by more than a factor of 10 from z = 3 to the present. We emphasize that, by construction, our analysis is insensitive to quenching mechanisms that would remove galaxies from the star-forming sequence altogether, while it is sensitive to those mechanisms that perturb only in part the SFRs of main-sequence galaxies. Figure 3c shows how the sSFR evaluated at Mknee scales with redshift, implying that the typical sSFR of the main sequence depends on z at the 1.65th power. In turn, this implies a decrease by more than one order of magnitude of the mean sSFR from z = 4 to z = 0 for normal (unquenched) galaxies. Figure 3d shows the dependence on redshift of the slope of the sSFR versus mass relation below (alow) and above (ahigh ) Mknee. The parameter alow is independent of redshift, while ahigh increases as (1 + z)0.88: i.e., the main sequence of unquenched galaxies exists at all redshifts, but the effects of quenching are less severe with increasing redshift. This is in agreement with the findings of Whitaker et al. (2014).
Parameters of the fit for the function log sSFR = a(log M∗ − log Mknee) + b.
4. Strong bars and bulges as a function of M∗
In the previous section, we determine that galaxies above a redshift-dependent mass threshold are progressively more quenched. It is necessary to study in greater depth what physical mechanism might have caused such an effect.
We begin by taking a closer look at the morphology of the studied galaxies below and above Mknee, starting from the local sample. As discussed in the literature, it is quite challenging to produce a reliable morphological classification that distinguishes disks from bulges and, possibly, classical from pseudo-type bulges (Wilman et al. 2013). The task is even harder as recent evidence indicates that the two bulge categories can even occur simultaneously (Erwin et al. 2015).
With these caveats in mind, we focused on the detection of “strong bars” (using the nomenclature of Nair & Abraham 2010). We instead refrain from classifying “weak” and even “intermediate” bars as “bars”, because we expect that they produce only minor perturbations to the disk, making them difficult to recognize. The criteria used to visually identify strong bars include that the bar ellipticity must be larger than ~0.4, but we did not impose any constraint on the galaxy maximum inclination. Of course bars are easier to detect in face-on systems, although the presence of X-shaped, boxy, or peanut shaped bulges helps detect bars even in highly inclined objects. Secondary features such as rings near corotation, ansae, dust lanes, and inner Lindblad resonances (ILR, mostly too small to be detected on SDSS images) are not mandatory features, but of course – if present – they help in identifying bars.
The visual classification of strong bars was performed by seven authors (GG, GC, MD, RF, MFo, MFu, GS) who individually inspected and classified all 864 galaxies in our sample.
The classification was based on i-band SDSS images, not to be biased by the sSFR versus color relation, nor by dust attenuation effects. Following a template, the classifiers were called to distinguish i) barred; ii) unbarred galaxies hosting a bulge; and iii) disks without a bar or a bulge. Among class ii) we do not try to disentangle pseudobulges from classical bulges.
Despite the aforementioned difficulties, the robustness of the resulting classification is satisfactory overall: among the galaxies identified as hosts of a strong bar, agreement between more than four classifiers was reached in 92% of the cases; the level of agreement drops to 77% for bulges and to 85% for disks without bars or bulges. These percentages suggest that the main difficulty lies in the identification of bulges, reflecting the ambiguity in detecting the presence of bulges in face-on or poorly resolved disk galaxies when the color information is disregarded (see also Drory & Fisher 2007).
The result of this morphology classification is shown in Fig. 4, which presents again the SFR versus stellar mass relation that is now color coded according to the morphological classification. The value of Mknee is indicated by the vertical dashed line. Histograms are also provided to highlight the relative frequency of each class in bins of mass and SFR.
Below M∗ = 109.45 M⊙, i.e., Mknee at z = 0, the frequency of disks without bulge or bar, barred disks, and unbarred disks with a bulge is 87%, 8%, and 5% respectively. Above M∗ = 109.45 M⊙, instead, these frequencies become 28%, 27%, and 45%. Our analysis reveals that the vast majority of low-mass galaxies are disks without bulge or bar, while more than half of the high-mass galaxies host either a bulge or a strong bar.
In the top right panel, we plot the occupation fraction of visually classified strong bars of the whole sample as a function of stellar mass. This is in agreement with previous studies highlighting that the likelihood of having a bar in disk galaxies increases with increasing stellar mass. Skibba et al. (2012), Wang et al. (2012), and Masters et al. (2012) consistently find that the strong-bar fraction increases from 10% to 40% with increasing stellar mass from M∗ = 109 to M∗ = 1011 M⊙. Consistent conclusions are indirectly reached by Marinova et al. (2009) (who study the dependence on V luminosity). Moreover, focusing on the nearby Virgo cluster and using the early bar classifications by de Vaucouleurs et al. (1991, RC3) and by Binggeli et al. (1985) from high-quality photographic plates, we find that in the Local and Coma superclusters the fraction of barred galaxies is lower than 20% below M∗ = 109.5 M⊙ and rises to 30–40% at high masses. Again, this is consistent with all results listed above.
On the other hand, two other results contradict this trend. Barazza et al. (2008) and Nair & Abraham (2010) found bar fractions on the order of 30–40% above M∗ = 1010 M⊙, consistently with all cited works, but their strong-bar fraction increases with decreasing mass, reaching 40–50% around M∗ = 109.5 M⊙. We note, first of all, that these authors did not include dwarf irregulars in their study, but in fact these galaxies represent the majority in our sample among low-mass galaxies. We deliberately included them as they are gas-rich, star-forming main-sequence objects obeying the Tully-Fisher relation and this could explain the large discrepancies between our work and theirs. We stress that by selection, galaxies shown in Fig. 4 include dIrrs but not dEs. This makes a direct comparison to other studies of the frequency of strong bars as a function of mass, such as Nair & Abraham (2010) and Barazza et al. (2008), more difficult.
To further prove our point we checked against possible biases that could in principle artificially reduce the frequency of bars especially at low mass. These are traceable to the following cases: i) obscuration by dust; ii) galaxy inclination; and iii) limited spatial resolution (hampering the detection of bars in small galaxies and in gas-rich galaxies with patchy star formation).
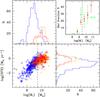 |
Fig. 4 SFR versus stellar mass for the local sample in Fig. 1, but with symbols corresponding to the visual morphology: disks without bulge or bar (blue), barred disks (red), and unbarred disks with a bulge (orange). The vertical dashed line indicates Mknee at z = 0. Within the same categories, distributions in bins of stellar mass and SFR are given in the top and right histograms. The top right panel gives the fraction of visually classified strong bars as a function of stellar mass, given separately for the whole sample (red), and for the local sample (within the distance of 40 Mpc, green). Owing to the small sampled volume, the third subsample lacks statistical weight at high mass (one barred galaxy over 4 objects in the highest mass bin), while the point at the low-mass end has the highest statistical significance (one barred galaxy over 85 targets). |
Case i) It has been shown by several groups that 60% of bright disk galaxies are barred in the near-infrared (Eskridge et al. 2000; Laurikainen et al. 2004; Menendez-Delmestre et al. 2007; Marinova & Jogee 2007), while only 45% appear barred in the optical (Eskridge et al. 2000; Reese et al. 2007; Marinova & Jogee 2007), presumably due to dust obscuration. Our lack of bars at low stellar masses in Fig. 4 could result from this dust bias if more obscuration associated with a larger dust fraction occurs at lower mass. However, first our bar selection band (SDSS iλ = 7600 Å) is closer to near-infrared than other bluer optical bands; second, we used a representative sample of the local universe (the HRS sample of Boselli et al. 2010) to compute the extinction coefficient as a function of stellar mass and (unsurprisingly, given the mass-metallicity relation) we found that it decreases with decreasing mass, such that for mass below M∗ = 109 M⊙A(i) < 0.2 mag (Boselli et al. 2015), ruling out a strong obscuration at low mass, and consequently a possible bias in our ability to find bars at the low-mass end of the distribution.
Case ii) We found no significant bias related to the galaxy inclination and/or to the relative PA between the bar and the inclined galaxy. Qualitatively, while bars could be missed in very inclined systems, there is no reason to expect a higher incidence of bars in inclined systems at lower masses. More quantitatively, we computed the fraction of strong bars as a function of stellar mass in a subsample of face-on (i< 45°) galaxies, and checked that the bar fraction remains unchanged as a function of mass. Actually, by adopting the same mass bins as used in Fig. 4 (from 8.5 to 11.0 in steps of 0.5 log (M⋆)), the bar fractions become 4%, 11%, 25%, 26%, and 35%, which are consistent with the results obtained when analyzing the whole sample (4%, 17%, 23%, 28%, 42%), confirming that our results are not affected by any inclination bias3.
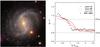 |
Fig. 5 RGB image (SDSS) of the barred galaxy NGC 5921 (left panel). The bar extent is marked in red. Its g − i color profile along the major axis in units of corotation radius (dots) is superposed to the median color profiles of barred galaxies with mass above Mknee and different inclinations (<15 deg, 30 deg, 50 deg). The two dashed horizontal lines mark the color of typical LTGs and ETGs above Mknee. |
Case iii) Our sample is limited to z< 0.03, but in the high-mass range it is dominated by objects with z ~ 0.02 (Coma supercluster), while at low mass Local supercluster galaxies dominate. The spatial resolution offered by SDSS images (~1.4 arcsec) corresponds to 0.7 kpc at the distance of Coma. As discussed by Barazza et al. (2008), the typical scale of strong bars at high mass (above 5 × 10⁹ M⊙) is 2 kpc, which does not hamper the bar detection at high mass. At low mass (below 109 M⊙) our sample is instead dominated by dIrr in the Local supercluster where the SDSS resolution element becomes ~110 pc, i.e., sufficient to resolve bars whose size is 10% of their optical diameter (Erwin et al. 2005), which is typically 2.5 kpc. In order to test the robustness of the determination of the bar fraction with respect to the spatial resolution, we split the sample in two distance bins: within 40 Mpc (i.e., dominated by the Local supercluster), and one between 40 and 100 Mpc (i.e., dominated by the Coma supercluster). In Fig. 4 we plot the bar fraction in the nearby subsample (green dots) separately from the total (red dots).
At low mass (M∗< 109 M⊙), nine dwarf galaxies host a strong bar, while in the same mass range 312 objects are classified as unbarred. None of them appears to have a missed bar; however, among these 312 candidates, 7 galaxies received at least one bar-vote from one of the classifiers. This would bring the bar fraction below 109 M⊙ to at most 5%, significantly below the frequencies measured by Barazza et al. (2008) and Nair & Abraham (2010).
We finally check the dependence of the bar fraction on color. Given the known color-mass relation, e.g., more massive galaxies exhibit redder colors, it is not surprising that Skibba et al. (2012) and Masters et al. (2012) find that the bar fraction increases from 10 to 40% from blue to red, while Barazza et al. (2008) and Nair & Abraham (2010) do not find such an effect. In our sample the bar fraction is 13%, 16%, 25%, and 21% with g − i increasing from 0.25 to 1.25 in steps of 0.25. Above Mknee, bars are undoubtedly associated with red regions, as vividly demonstrated by Fig. 5, where a picture of the barred galaxy NGC 5921 is shown. Within the bar extent (red circle) the color index is as red as the color of an early-type galaxy (ETG), while it is as blue as a typical massive LTG outside this radius. This color pattern is the same as the other massive barred galaxies in our local sample, as shown by the red lines in the right panel of Fig. 5. These lines correspond to the median color profiles of barred galaxies with mass above Mknee and different inclination cuts. Profiles have been normalized to the bar length. Despite the projection effects that smear the sharp color gradient seen in NGC 5921 a change in the color profile is still visible near the bar edge because, even in face-on galaxies, the zone containing the bar often has a higher ellipticity and a position angle that is different from that of the galaxy as a whole, which is used to compute the color profile.
5. Bar-driven star formation quenching
In this section we propose a simple model in which a forming or existing bar removes in few dynamical times most of the gas from the central region of the galaxy (i.e., within the bar corotational radius). As a consequence, after a short transient nuclear starburst, the inner region of the galaxy stops forming stars, and grows redder with time (see also Cheung et al. 2013). This model provides a simple and natural explanation of our observational evidence presented so far. We note, however, that our model applies only to isolated disk galaxies. Dynamically hot stellar systems, elliptical for example, would not form bars, and other environmental processes are known to act on galaxies in clusters (Boselli & Gavazzi 2006).
At first, in Sect. 5.1, we consider a single bar-unstable galaxy, and, through the comparison with a numerical simulation, we show that the main features of massive disk galaxies observed are nicely reproduced even with the most simplifying assumptions. Then, in Sect. 5.2, we make use of simple analytical considerations to demonstrate that the proposed model of bar-driven quenching reproduces the observed dependences of the sSFR on the galaxy masses and redshifts.
5.1. Comparison with hydrodynamical simulations
As a test-bed for the study of the effects of a strong bar on the gas on galactic scales we analyze one of the N-body/hydrodynamic simulations of isolated disk galaxies discussed in Fanali et al. (in prep.). In this run no star formation prescription or any kind of star formation/AGN related feedback has been implemented in order to allow for a clear identification of a dynamical quenching effect of the bar, if present. Reassuringly, despite the simple numerical techniques adopted in our calculation, the results discussed here are in line with the findings of other authors, as we will detail in the following.
The initial conditions of the run are equal to those described in Mayer & Wadsley (2004, model Lmd2c12), in order to reproduce an initially bulgeless bar-unstable galaxy. The stellar component of the galactic disk follows an exponential profile 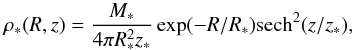 (2)where the radial and vertical scale lengths are R∗ = 3 kpc and z∗ = 0.3 kpc, respectively, and M∗ = 1.4 × 10¹⁰ M⊙ is the total stellar mass. The galactic disk has an additional gas component of mass Mgas = fgas × M∗, with a gas fraction fgas = 0.05. The gas follows the same surface density profile of the stars, and it is assumed to have a homogeneous temperature profile, with Tgas = 104 K. The gas evolves isothermally during the system evolution. We will see that our simulation reproduces all the key features of massive disk galaxies that we need to test our model, even under such simple assumptions about the gas thermodynamics.
The composite stellar-gaseous disk is embedded in a larger scale dark matter halo, following a density profile 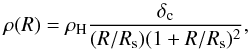 (3)where Rs = 10 kpc, ρH is the critical density of the Universe today and δc = (200 / 3) × { c3/ [ ln(1 + c) − c/ (1 + c) ] } depends only on the concentration parameter c, set equal to 12 for this galaxy (Navarro et al. 1997).
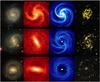 |
Fig. 6 RGB images (SDSS) of three galaxies (left column) with increasing stellar mass (NGC 3596, NGC 5921, NGC 5701 from top to bottom) showing a regular spiral galaxy (top), a well-developed bar (middle), a barred ring (bottom). Face-on views of simulations of stars (second column) and gas densities (third column) from t = 1 to t = 4 Gyr showing a spiral disk galaxy (top) that becomes bar unstable (middle). Inside the corotation radius, the gas is conveyed towards the center and quickly consumed (except for little left along the bar). Outside the corotation radius, the gas is unperturbed and feeds peripheral star formation. At the latest time step (t = 9 Gyr) the galaxy fully develops its bar and the central region is completely evacuated of gas. A ring of gas is left outside and feeds the star formation, as confirmed by the rightmost column showing our Hα images. When the bar is well developed (the two bottom panels) the star formation is suppressed inside the bar corotation radius, but it is ongoing in the outer parts. Even centrally quenched galaxies host some emission on a nuclear scale (rightmost column). However, we caution that this emission is dominated by [NII] with respect to Hα (common in LINERs) and so does not indicate solely ongoing star formation. |
For each component (halo and disk) the particle positions are generated through a direct Monte Carlo sampling of the density profiles. Because of the complexity of the system, we do not generate the particle velocities by directly solving the collisionless Boltzmann equation. We instead enforce an approximate dynamical equilibrium for the system, following Hernquist (1993, H93 hereafter) and Springel et al. (2005). In detail, we make use of the Jeans equation to compute the first and second moments of the velocity field as a function of the position, i.e., the bulk motion of the particles and the components of their local velocity dispersion. In the simpler halo case we assume an isotropic velocity field (i.e., no net rotation) and that all the components of the velocity dispersion tensor are equal. The three components of the velocity dispersion tensor as well as the rotational bulk velocity of the disk particles are obtained following the numerical procedure described in Sect. 2.2.3 in H93. The velocity components of each particle, then, are sampled through a Monte Carlo procedure, assuming that the local distribution function is Gaussian, in good agreement with the observational constraints (see the discussion in H93).
We sample the stellar disk with 9.5 × 10⁵ particles, the gaseous disk with 5 × 10⁴ particles, and the halo with 106 particles. We ensure that the particles in the disk all have the same mass, preventing any spurious relaxation and mass segregation. The softening length that sets the spatial resolution of the gravitational interaction in the run of each particle is 15 pc. The system is evolved using the smoothed particle hydrodynamics (SPH) code Gadget-2 (Springel 2005).
Three snapshots of the stellar and gas surface densities at different times are shown in the two central columns of Fig. 6, together with three images of real galaxies taken from our sample for comparison (left columns). The simulated galaxy has a first evolutionary phase (t< 1.5 Gyr) during which it develops mainly spiral features (top panels in Fig. 6). At t ~ 1.5 Gyr a stellar bar forms, and during its growth and evolution it triggers strong gas inflows toward the galaxy center. Already at t ~ 4 Gyr (second row in in Fig. 6) most of the gas in the central 4.5 kpc has been forced into the galactic nucleus, in accordance with previous observational (e.g., Sakamoto et al. 1999, Jogee et al. 2005, Sheth et al. 2005) as well as analytical and numerical studies (e.g., Sanders & Huntley 1976; Shlosman et al. 1989; Athanassoula 1992; Berentzen et al. 1998; Regan & Teuben 2004; Kim et al. 2012; Cole et al. 2014).
Although our simulation does not include any prescription for star formation, the extreme gas densities in the nucleus and its short dynamical time ensures that most of the gas mass is doomed to convert into stars in a burst of nuclear star formation (e.g., Krumholz et al. 2009; Krumholz & McKee 2005; Daddi et al. 2010; Genzel et al. 2010), likely resulting in the formation of a pseudobulge4. After the short transient starburst event, the gas density (and, consequently, any expected SFR) drops. After 9 Gyr the stellar bar has swept the quasi-totality of the gas in the central 4.5 kpc (bottom row in in Fig. 6), and our simulation nicely reproduces the properties of a centrally quenched galaxy as NGC 5701, but retains an evident external spiral structure (bottom left panel in Fig. 6). Streams of low-density gas falling along the edges of the bar are still visible, both in the simulation and in the observations, where they are traced by dust filaments. The Hα images shown in rightmost column of Fig. 6 show (from top to bottom) that normal star formation is taking place in the disk of the relatively lower mass NGC 3596, while when the bar fully develops (NGC 5921 and NGC 5701) the star formation activity is null inside the bar corotation radius, but remains conspicuous outside it. Some emission remains observable in the nuclear regions, hosting a star-forming cluster (in NGC 3596) or showing [NII] over Hα ratios suggestive of low ionization nuclear emission-line regions (LINERs, as in NGC 5921 and NGC 5701), as the nuclear spectra of these three galaxies indicate (Gavazzi et al. 2013c).
The comparison between our simulation and observations have been performed for more than three galaxies. We note that Fig. 5 already demonstrates that the central regions of barred galaxies are, on average, quenched with respect to the corresponding outer parts. To further support this scenario with our observational data of nearby galaxies, we present in Fig. 7 the color-mass diagram dividing the inner parts (within the bar extent) of barred galaxies from their outer parts. The g − i colors, taken as a proxy for sSFR, have been corrected for Milky Way and internal extinction as in Gavazzi et al. (2013b). Non-barred LTGs in our sample and ETGs in the Coma and Local superclusters have been plotted for comparison. Figure 7 clearly demonstrates the significant central quenching caused by the bars in massive galaxies. We also note that the bar-driven gas removal cannot be the only quenching mechanism in place, as even the exteriors of massive barred galaxies are redder than lower mass counterparts. Our selection criteria, however, allow us to exclude a possible environmental nature of the additional quenching process. We note that the triggering of a strong gas inflow like the one observed in our simulation is ubiquitously observed in many investigations, regardless of the particular type of code used (2D versus 3D, Eulerian grid based codes versus SPH, see Sellwood 2014 for a thorough discussion). As a final word of caution, we highlight that the main shortcut of our simulation is the lack of any feedback associated with star formation or to the possible onset of an AGN. This allowed us to firmly identify an independent – purely dynamical – bar driven quenching process. Stellar feedback could, however, eject a significant amount of the gas driven into the galaxy central regions by the bar. Because of the small angular momentum of such outflows, the gas would not re-enrich the quenched kpc size region. The ejected gas is instead expected to fall back towards the nucleus, leading to multiple episodes of intense and fast nuclear star formation (see the results of the high-resolution simulation including stellar feedback discussed in Emsellem et al. 2015).
5.2. Dynamical model for the sSFR-quenching cosmic evolution
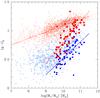 |
Fig. 7 Color-mass diagram obtained with the g − i color (corrected for extinction in the Milky Way and for internal extinction). ETGs in the Coma and Local superclusters (small red points) are also shown for comparison. The LTGs are subdivided into galaxies with disks without a bulge or a bar (including dIrr and other blue dwarfs, light blues symbols) and galaxies that we classified as containing a strong bar. The colors of the latter are separately displayed as large red symbols within the corotation radius and with large blue squares outside the corotation radius. Fits to the colors of the inner and outer regions of barred galaxies (as well as for ETGs) are shown in the figure. |
In the previous section we discuss how the presence of a bar results in the removal of gas in the central region of a galaxy, explaining its red colour within the corotation radius and the lower sSFR of the whole galaxy. Figure 3, however, clearly indicates that the bar-driven quenching is not effective in low-mass galaxies. More specifically, the observational data are indeed consistent with strong bars forming only in massive spiral galaxies, with M∗>Mknee ~ 109.5 M⊙ at z = 0, where Mknee is an increasing function of redshift. We stress that the trend of Mknee with redshift fits with the results of studies on the strong bar frequencies in large observational samples. As an example, Sheth et al. (2008) analyzed the COSMOS 2 deg2 field finding a decreasing bar fraction moving toward higher redshifts. They also comment on the fact that the strong bar fraction of low-mass M∗ ≲ 1010.5 M⊙ spirals declines significantly with redshift beyond z = 0.3, while it remains roughly constant out to z ~ 0.84 in more massive, luminous spirals. This is consistent with the seminal results of Jogee et al. (2004), obtained analyzing galaxies out to z ~ 1 observed with the Hubble Space Telescope Advanced Camera for Surveys (ACS). Later on, similar results were discussed in Cameron et al. (2010) who reported that the strong bar fraction for massive systems (M∗> 1011 M⊙) does not change between z = 0.2 and z = 0.6, while it falls for lower mass systems. More recently, Melvin et al. (2014), on the basis of visual classifications provided by citizen scientists via the Galaxy Zoo Hubble project, also find that the overall strong bar fraction decreases from 22 ± 5% at z = 0.4 to 11 ± 2% at z = 1.0. In addition, they confirmed that this decrease in the bar fraction is most prominent at low stellar masses.
A simple model that explains the existence of a redshift-dependent Mknee above which the sSFR declines can be built on the observational evidence that the dynamical state of galactic disks depends on their masses and redshifts (e.g., Sesana et al. 2014 and references therein). We start noticing that dynamically hot galactic disks are stable against bar formation, while colder disks can form bars in few dynamical times (e.g., Athanassoula & Sellwood 1986). We define hot disks those with Toomre parameter 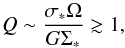 (4)where σ∗ is the stellar velocity dispersion, Ω is the angular velocity and Σ∗ is the stellar surface density. The Toomre parameter can be rewritten as
 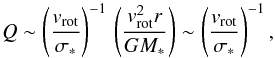 (5)where vrot is the rotational velocity of the disk, r is a proxy for the disk extension, and
  because of the virial equilibrium of the rotating stellar disk. Using Eq. (5) we can translate the critical value of the Toomre parameter Qcrit, distinguishing between bar stable and unstable systems, into a critical value of the vrot/σ∗ ratio.
A growing number of studies (e.g., Förster Schreiber et al. 2009; Law et al. 2009; Gnerucci et al. 2011; Kassin et al. 2012; Wisnioski et al. 2011; 2015; Epinat et al. 2012; Swinbank et al. 2012; Newman et al. 2013) finds that the vrot/σgas in disk galaxies increases as a function of the galaxy mass M∗ and decreases with redshift. A similar trend in vrot/σ∗ is required to reproduce the observed evolution of the fraction of galactic bars and of the sSFR discussed above (as already noted by e.g., Sheth et al. 2008). As a note of caution we stress that the above cited studies focus on the gas dynamics instead of the stellar one, and that the gas component, being subject to additional forces of radiative and hydrodynamical nature, could have a different dynamics with respect to the stars. This, together with the very limited number of galaxies in the samples listed above and the large observational uncertainties in vrot/σgas prevents us to perform a more quantitative analysis.
Recently Kraljic et al. (2012) have studied the occurrence of bars in disk galaxies of 1010 ≲ M∗/M⊙ ≲ 1011 in high-resolution cosmological simulations. They presented a physically motivated scenario in which long-lived bars form when galaxies stop being battered by frequent minor mergers, which tend to keep the host galaxies dynamically hot (see also Romano-Diaz et al. 2008). In the mass range they studied, the bar fraction is ≈0 at z ≳ 1.5, ≈10% at z ≈ 1, and ≈80% at z ≈ 0.5, in reasonable agreement with our model and with the value of Mknee we find for those masses. An observational confirmation of the model should pass through an estimate of the fraction of galaxies of a given mass undergoing a minor merger within a given redshift. This exercise has been already performed in the literature (e.g., Jogee et al. 2009; Lotz et al. 2011). The results depend on the different tracers used to identify galaxy mergers and the different assumptions underlying the estimates of the merging frequency, and do not always agree with the theoretical predictions, calling for a critical revision of both the observational and theoretical approaches (as discussed in Lotz et al. 2011). Even so, assuming the maximum number of mergers within the last 7 Gyr (z ≈ 0.8) reported in Jogee et al. (2009) and Lotz et al. (2011), about half of the galaxies with M∗> 109 M⊙ did not undergo any minor merger, leaving sufficient time to develop a bar in their central regions.
We conclude by commenting that the Mknee ∝ (1 + z)2 fit to the observational data (Fig. 3, panel b) implies that vrot/σ∗ does not depend on two uncorrelated variables (M∗ and z), but only on M∗/ (1 + z)2, decreasing the dimensionality of the problem. This prediction can be tested by future accurate measurements of vrot/σ∗ in larger samples of galaxies of different masses and redshifts.
6. Discussion
The results of our observational study together with simple numerical and analytical arguments, demonstrate the relevance of bars in quenching the central regions of about 25% of the field main-sequence galaxies with M∗>Mknee in our sample. In this section we speculate further, depicting a physical scenario in which the mass quenching of the vast majority of the massive field galaxies is caused by the occurrence of a bar.
In Sect. 4 we visually classified the galaxies in our sample either as pure disks or as hosts of strong bars or bulges. A significant fraction (~40%) of the galaxies above Mknee do not show a prominent bar, but rather host a central bulge. We start by assuming that the most of the observed bulges are not classical, but rather boxy/peanut bulges and/or pseudobulges. Such an assumption is not unrealistic for isolated disk galaxies (Weinzirl et al. 2009), but we stress again that it is highly challenging to classify reliably the different bulge morphologies (e.g., Graham et al. 2008; Wilman et al. 2013). The task is even harder as recent evidence indicates that the two bulge categories can even occur simultaneously (Erwin et al. 2015). Given the speculative nature of this section, we will work under this assumption anyway, for which pseudobulges originate from bars. In fact, there is a growing evidence (e.g., Combes et al. 1990; Kormendy & Cornell 2004; Athanassoula 2005, 2008) that non-classical bulges represent the late evolutionary stage of stellar bars, due to the buckling of the central part of the bar itself (boxy/peanut bulges) and to nuclear star formation fueled by bar-driven gas inflows (pseudobulges). The formation of a central gas concentration that could result in the formation of a pseudobulge is present in the simulation previously discussed (Sect. 5.1). We further note that at the very end of the simulation the bar develops a thicker rotating stellar structure in its center, consistent with a boxy/peanut shape bulge, depending on the assumed line of sight (see Fig. 8). Meanwhile, although still present, the bar becomes harder to identify in the stellar surface density distribution. For a detailed theoretical and observational description of the bar/pseudobulge interplay we refer the reader to the work of Raha et al. (1991), Kormendy & Kennicutt (2004), Kormendy (2013), and Sellwood (2014).
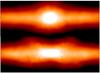 |
Fig. 8 Edge-on view of the same object at the t = 9 Gyr step of the simulation in Fig. 6. The azimuthal angle of the bar is along (perpendicular to) the line of sight in the top (bottom) panel. In both cases we would classify it as pseudobulge. |
While it is well established that pseudobulges and boxy/peanut bulges can indeed form from the evolution of a bar, we cannot prove that our bulge category does not include a significant fraction of classical bulges. A detailed study of the nature of the bulges would require a wealth of additional information, including observational constraints on the dynamical state of the bulges (e.g., through long slit or integral field spectroscopy), and is beyond the scope of this paper. However, we can discuss some additional properties of the bulge population that hint to a physical link with the population of bar-hosting galaxies.
Figure 4 shows a sharp separation between pure disks and bars or bulges across 109.5 M⊙. A Kolmogorov-Smirnov test gives a null probability that the distributions of pure disks and galaxies hosting bars or bulges are derived from the same parent population. Bars and bulges, instead, have almost identical SFR distributions (>99% K-S probability, see the right panel of Fig. 4), supporting a scenario in which bars and bulges are physically associated. Bars and bulges also show similar mass distributions (upper panel in Fig. 4). In this last case, however, they do not perfectly match, probably because of the ambiguity in the classification of objects in the transition regime between bulges and disks near 109.5 M⊙.
An additional independent hint comes from the study of the nuclear activity of galaxies with bars and bulges. Observations confirm that indeed many barred galaxies have dense central concentration of gas and enhanced central star formation (Sakamoto et al. 1999; Laurikainen et al. 2004; Jogee et al. 2005; Sheth et al. 2005; Ellison et al. 2011; Kormendy et al. 2013). We strengthen this point by performing an analysis of the nuclear activity of the galaxies in our sample, making use of the classification given in Gavazzi et al. (2013c). We find that among massive barred galaxies (M∗> 109.5 M⊙) at z = 0, 61% of nuclei show line ratios typical of HII regions, 12% are strong AGNs (mostly type 2), and 11% are either passive (2%) or retired (9%)5. The remaining galaxies (15%) are classified as LINERs. Very similarly, among massive spirals showing bulges, 53% have HII-like nuclei, 14% are strong AGNs, 23% are LINERs, and 9% are passive or retired. The large fraction of star-forming nuclei and strong AGNs in the two samples hints at large gas concentrations, and the similar fractions further hint to a common physical origin of bulges and bars. As a check we performed the same exercise among 954 E+S0, selected in the Local and Coma superclusters with stellar masses greater than 109.5 M⊙. Of these, only 5% show line ratios common to HII regions, 2% are strong AGNs, while 13% are LINERs and the remaining 80% are either passive or retired. In summary, the population of galaxies with strong bars is indistinguishable from that hosting bulges as far as their nuclear properties are concerned, while the E+S0 class (supposedly dominated by genuine classical bulges) does not show any significant central activity whatsoever.
In conclusion, the arguments discussed so far support a possible evolutionary scenario in which, at a given redshift, galaxies above Mknee undergo a bar instability (Sect. 5.2). The bar forces the gas within the corotational radius to fall toward the center in few dynamical times. The forming central gas condensation is immediately consumed by a vigorous burst of star formation (and/or AGN activity), resulting in the formation of a pseudobulge. After a few rotations, the bar sweeps all the gas within its corotational radius, quenching the SF in the central region of the galaxy. Consequently, this region grows redder and redder with time, decreasing the global sSFR of the galaxy (see also Cheung et al. 2013). With time the central region of the bar undergoes a buckling instability (e.g., Sellwood 2014, and references therein): the bar becomes less and less visible, while a thicker but still rotationally supported stellar condensation (i.e., a boxy/peanut bulge) becomes clearly observable, often with a pseudobulge hosted in its very center. The common origin of pseudobulges and boxy/peanut bulges from bars justifies i) the significant fraction of galaxies hosting bulges observed in our sample above Mknee; and ii) the similarities between their masses, SFRs, and nuclear activity distributions and those describing their barred counterparts.
7. Summary and conclusion
In the present paper we tried to reconstruct the star formation history of main-sequence galaxies as a function of stellar mass from the present epoch (Sect. 2) up to z = 3 (Sect. 3). The local determination was based on the Hα narrow-band imaging follow-up survey (Hα3) of field galaxies selected from the HI Arecibo Legacy Fast ALFA Survey (ALFALFA) in the Coma and Local superclusters. The higher redshift measurements were taken from the recent literature.
A clear evolutionary trend was found indicating that star-forming galaxies had their SFR quenched above a certain threshold mass, which is a strong increasing function of redshift (Sect. 3).
To help identify what physical mechanism is responsible for this mass quenching, a set of hydrodynamical simulations of isolated disk galaxies was run to reproduce the formation of a bar (Sect. 5.1) and some dynamical considerations allowed us to highlight the joint dependence on mass and redshift of the Toomre conditions for bar instability (Sect. 5.2).
The present investigation has focused on five fundamental aspects underlying the global history of star-forming galaxies:
-
(i)
there is a clear increase in the fraction of visually classified strong bars above some critical stellar mass Mknee that in the local Universe corresponds to ~109.5 M⊙;
-
(ii)
above Mknee the bars are responsible for intense gas inflows that effectively trigger bursts of nuclear star formation that accelerate SF activity in the circumnuclear region, thus contributing to quenching the star formation in the longer run within the bar extent (on kpc scales) in agreement with Cheung et al. (2013);
-
(iii)
the critical stellar mass Mknee is found to be strongly dependent on redshift, with only the most massive galaxies harboring bars at high redshift;
-
(iv)
the specific SFR below Mknee (among normal main-sequence galaxies) strongly increases with redshift at least up to z ~ 4 (Madau et al. 1998);
-
(v)
among centrally quenched galaxies, above Mknee, the effects of quenching decrease significantly with increasing redshift.
Points (iv) and (v) may be caused by the cosmic evolution of galaxies, according to which higher redshift galaxies are progressively more gas-rich and are more often perturbed. Instead, results (i) to (iii) can be accounted for within a simple, physically motivated scenario, as detailed in Sect. 5. In this picture, galaxies evolve from dynamically hotter structures to disks clearly dominated by their bulk rotation. More massive galaxies settle into dynamically cold configurations earlier, as supported by a growing wealth of observations (see references in Sect. 5.2), with respect to less massive structures. As soon as a galaxy relaxes, the central part of the disk can undergo bar instability. The resulting bar sweeps away the gas within its corotational radius quenching the SF in the central region of the galaxy. This region, consequently, grows redder and redder with time, decreasing the global sSFR of the galaxy.
As a note of caution we stress that, although bars play a significant role, some additional mass-driven quenching mechanisms are required to explain the “downsizing” of high-mass spirals. As shown in Fig. 7, even the exteriors of massive barred galaxies are redder than lower mass counterparts. This could also be related to the evolution of galaxies in a cosmological context. Since the additional mechanisms are needed to quench the outer regions of field disk galaxies, we consider cosmological starvation (Feldmann & Mayer 2015, Fiacconi et al. 2015; Peng et al. 2015) to be a better candidate than SF/AGN feedback, for example, or any environmental effect. A complete understanding of this second quenching mechanism would require a more comprehensive study and is beyond the scope of this investigation.
The simple model outlined above has a number of testable assumptions and predictions: (i) Deep imaging can verify whether the central regions of quenched galaxies host bars/bulges at higher redshift, and if such structures are instead absent below Mknee. This is already hinted at by observational studies of the cosmic evolution of the bar occupation fraction, e.g., Sheth et al. (2008). (ii) Our model predicts that the degree of “relaxation” of galaxies, as described by the vrot/σ∗ ratio, must depend on a specific combination (M∗/ (1 + z)2) of the galaxy masses and redshift. Increasing the statistics and the accuracy of vrot/σ∗ measurements in mass and redshift bins will test such a prediction.
We conclude by speculating on the relevance of the bar-induced mass quenching for massive field galaxies. We believe that most of the massive galaxies that do not show a clear bar while hosting a central bulge can be associated with a late evolutionary stage of a previously barred galaxy. In this scenario most of the bulges in our classification would be either pseudobulges, formed during the bar-induced nuclear gas inflow, or boxy/peanut bulges, which are the results of the buckling instability that naturally develops in the central regions of the bar (e.g., Sellwood 2014 and references therein). As discussed in the literature, the bar buckling and formation of dense nuclear concentration of mass (e.g., the pseudobulge) modifies the dynamics of the stars in the bar. This can result in what is known as “bar suicide”: the bar becomes less and less visible (Raha et al. 1991; Norman et al. 1996; Martinez-Valpuesta & Shlosman 2004; Shen & Sellwood 2004; Debattista et al. 2004, 2006; Athanassoula et al. 2005). A thicker but still rotationally supported stellar condensation (i.e., a boxy/peanut bulge) with a pseudobulge hosted in its very center would be the remaining traces of the dissolved bar. Such a speculative scenario is supported the similarities between the mass, SFR, and nuclear activity distributions of massive galaxies hosting bars and bulges.
The HI deficiency parameter, defined by Haynes & Giovanelli (1984) provides the logarithmic difference between the HI mass actually observed in galaxies and the one inferred from their optical diameter.
A similar trend was recently found independently by Lee et al. (2015).
Our sample is also not biased by the relative PA as it does not affect face-on galaxies in any way.
“Retired galaxies” is a denomination proposed by Stasińska et al. (2008) to describe nuclei that have stopped forming stars and are ionized by “hot post-AGB stars”.
Acknowledgments
We thank Katherine Whitaker for exchanging information with us, Davide Fiacconi for his help in initializing the numerical simulation presented in this work, and Alister Graham for comments. We wish to thank the anonymous referee for his constructive criticism. The authors would like to acknowledge the work of the entire ALFALFA collaboration team in observing, flagging, and extracting the catalog of galaxies used in this work and thank Shan Huang for providing original data. This research has made use of the GOLDmine database (Gavazzi et al. 2003, 2014) and of the NASA/IPAC Extragalactic Database (NED) which is operated by the Jet Propulsion Laboratory, California Institute of Technology, under contract with the National Aeronautics and Space Administration. We wish to thank an unknown referee whose criticism helped improving the manuscript. Funding for the Sloan Digital Sky Survey (SDSS) and SDSS-II has been provided by the Alfred P. Sloan Foundation, the Participating Institutions, the National Science Foundation, the US Department of Energy, the National Aeronautics and Space Administration, the Japanese Monbukagakusho, and the Max Planck Society, and the Higher Education Funding Council for England. The SDSS Web site is http://www.sdss.org/. The SDSS is managed by the Astrophysical Research Consortium (ARC) for the Participating Institutions. The Participating Institutions are the American Museum of Natural History, Astrophysical Institute Potsdam, University of Basel, University of Cambridge, Case Western Reserve University, The University of Chicago, Drexel University, Fermilab, the Institute for Advanced Study, the Japan Participation Group, The Johns Hopkins University, the Joint Institute for Nuclear Astrophysics, the Kavli Institute for Particle Astrophysics and Cosmology, the Korean Scientist Group, the Chinese Academy of Sciences (LAMOST), Los Alamos National Laboratory, the Max-Planck-Institute for Astronomy (MPIA), the Max-Planck-Institute for Astrophysics (MPA), New Mexico State University, Ohio State University, University of Pittsburgh, University of Portsmouth, Princeton University, the United States Naval Observatory, and the University of Washington. M. Fossati acknowledges the support of the Deutsche Forschungsgemeinschaft via Project ID 387/1-1. R.G. and M.P.H. are supported by US NSF grants AST-1107390 and the Brinson Foundation grant. M. Fumagalli acknowledges support by the Science and Technology Facilities Council [grant number ST/L00075X/1]. H. Hernández Toledo acknowledges support from DGAPA PAPIIT grant IN112912. L. Gutiérrez acknowledges support from Consejo Nacional de Ciencia y Tecnología de Mexico (CONACYT) under project 167236.
References
- Aguerri, J. A. L., Balcells, M., & Peletier, R. F. 2001, A&A, 367, 428 [NASA ADS] [CrossRef] [EDP Sciences] [Google Scholar]
- Athanassoula, E. 1992, MNRAS, 259, 345 [NASA ADS] [CrossRef] [Google Scholar]
- Athanassoula, E. 2005, MNRAS, 358, 147 [Google Scholar]
- Athanassoula, E. 2008, Formation and Evolution of Galaxy Disks, 396, 333 [NASA ADS] [Google Scholar]
- Athanassoula, E., & Sellwood, J. A. 1986, MNRAS, 221, 213 [NASA ADS] [CrossRef] [Google Scholar]
- Athanassoula, E., Lambert, J. C., & Dehnen, W. 2005, MNRAS, 358, 147 [Google Scholar]
- Balogh, M. L., Baldry, I. K., Nichol, R., et al. 2004, ApJ, 615, L101 [NASA ADS] [CrossRef] [Google Scholar]
- Barazza, F. D., Jogee, S., & Marinova, I. 2008, ApJ, 675, 1194 [NASA ADS] [CrossRef] [Google Scholar]
- Bauer, A. E., Hopkins, A. M., Gunawardhana, M., et al. 2013, MNRAS, 434, 209 [NASA ADS] [CrossRef] [Google Scholar]
- Berentzen, I., Heller, C. H., Shlosman, I., & Fricke, K. 1998, MNRAS, 300, 49 [NASA ADS] [CrossRef] [Google Scholar]
- Binggeli, B., Sandage, A., & Tammann, G. A. 1985, AJ, 90, 1681 [NASA ADS] [CrossRef] [Google Scholar]
- Boselli, A., & Gavazzi, G. 2006, PASP, 118, 517 [NASA ADS] [CrossRef] [Google Scholar]
- Boselli, A., & Gavazzi, G. 2014, A&A Rev., 22, 74 [CrossRef] [Google Scholar]
- Boselli, A., Gavazzi, G., Donas, J., & Scodeggio, M. 2001, AJ, 121, 753 [NASA ADS] [CrossRef] [Google Scholar]
- Boselli, A., Eales, S., Cortese, L., et al. 2010, PASP, 122, 261 [NASA ADS] [CrossRef] [Google Scholar]
- Boselli, A., Fossati, M., Gavazzi, G., et al. 2015, A&A, 579, A102 [NASA ADS] [CrossRef] [EDP Sciences] [Google Scholar]
- Boylan-Kolchin, M., Bullock, J. S., & Kaplinghat, M. 2012, MNRAS, 422, 1203 [NASA ADS] [CrossRef] [Google Scholar]
- Brinchmann, J., Charlot, S., White, S. D. M., et al. 2004, MNRAS, 351, 1151 [NASA ADS] [CrossRef] [Google Scholar]
- Buat, V., Heinis, S., Boquien, M., et al. 2014, A&A, 561, A39 [NASA ADS] [CrossRef] [EDP Sciences] [Google Scholar]
- Bundy, K., Georgakakis, A., Nandra, K., et al. 2008, ApJ, 681, 931 [NASA ADS] [CrossRef] [Google Scholar]
- Cameron, E., Carollo, C. M., Oesch, P., et al. 2010, MNRAS, 409, 346 [NASA ADS] [CrossRef] [Google Scholar]
- Cheung, E., Athanassoula, E., Masters, K. L., et al. 2013, ApJ, 779, 162 [NASA ADS] [CrossRef] [Google Scholar]
- Cole, D. R., Debattista, V. P., Erwin, P., Earp, S. W. F., & Roskar, R. 2014, MNRAS, 445, 3352 [NASA ADS] [CrossRef] [Google Scholar]
- Combes, F., Debbasch, F., Friedli, D., & Pfenniger, D. 1990, A&A, 233, 82 [NASA ADS] [Google Scholar]
- Cowie, L. L., Songaila, A., Hu, E. M., & Cohen, J. G. 1996, AJ, 112, 839 [Google Scholar]
- Daddi, E., Elbaz, D., Walter, F., et al. 2010, ApJ, 714, L118 [Google Scholar]
- Debattista, V. P., Carollo, C. M., Mayer, L., & Moore, B. 2004, ApJ, 604, L93 [NASA ADS] [CrossRef] [Google Scholar]
- Debattista, V. P., Mayer, L., Carollo, C. M., et al. 2006, ApJ, 645, 209 [NASA ADS] [CrossRef] [Google Scholar]
- de Vaucouleurs, G., de Vaucouleurs, A., Corwin, H. G., Jr., et al. 1991, Third Reference Catalogue of Bright Galaxies, Volume I: Explanations and references, Volume II: Data for galaxies between 0h and 12h, Volume III: Data for galaxies between 12h and 24h, eds. G. de Vaucouleurs, A. de Vaucouleurs, H. G. Jr. Corwin, et al. (New York, NY: Springer), 2091 [Google Scholar]
- Drory, N., & Fisher, D. B. 2007, ApJ, 664, 640 [NASA ADS] [CrossRef] [Google Scholar]
- Elbaz, D., Dickinson, M., Hwang, H. S., et al. 2011, A&A, 533, A119 [NASA ADS] [CrossRef] [EDP Sciences] [Google Scholar]
- Ellison, S. L., Nair, P., Patton, D. R., et al. 2011, MNRAS, 416, 2182 [NASA ADS] [CrossRef] [Google Scholar]
- Elmegreen, B. G., Bournaud, F., & Elmegreen, D. M. 2008, ApJ, 688, 67 [NASA ADS] [CrossRef] [Google Scholar]
- Emsellem, E., Renaud, F., Bournaud, F., et al. 2015, MNRAS, 446, 2468 [NASA ADS] [CrossRef] [Google Scholar]
- Epinat, B., Tasca, L., Amram, P., et al. 2012, A&A, 539, A92 [NASA ADS] [CrossRef] [EDP Sciences] [Google Scholar]
- Erwin, P. 2005, MNRAS, 364, 283 [NASA ADS] [CrossRef] [Google Scholar]
- Erwin, P., Saglia, R. P., Fabricius, M., et al. 2015, MNRAS, 446, 4039 [NASA ADS] [CrossRef] [Google Scholar]
- Eskridge, P. B., Frogel, J. A., Pogge, R. W., et al. 2000, AJ, 119, 536 [NASA ADS] [CrossRef] [Google Scholar]
- Feldmann, R., & Mayer, L. 2015, MNRAS, 446, 1939 [NASA ADS] [CrossRef] [Google Scholar]
- Fiacconi, D., Feldmann, R., & Mayer, L. 2015, MNRAS, 446, 1957 [NASA ADS] [CrossRef] [Google Scholar]
- Fontanot, F., De Lucia, G., Monaco, P., Somerville, R. S., & Santini, P. 2009, MNRAS, 397, 1776 [NASA ADS] [CrossRef] [Google Scholar]
- FörsterSchreiber, N. M., Genzel, R., Bouché, N., et al. 2009, ApJ, 706, 1364 [NASA ADS] [CrossRef] [Google Scholar]
- Gavazzi, G. 2009, Rev. Mex. Astron. Astrofis. Conf. Ser., 37, 72 [NASA ADS] [Google Scholar]
- Gavazzi, G., Pierini, D., & Boselli, A. 1996, A&A, 312, 397 [NASA ADS] [Google Scholar]
- Gavazzi, G., Boselli, A., Donati, A., Franzetti, P., & Scodeggio, M. 2003, A&A, 400, 451 [NASA ADS] [CrossRef] [EDP Sciences] [Google Scholar]
- Gavazzi, G., Giovanelli, R., Haynes, M. P., et al. 2008, A&A, 482, 43 [NASA ADS] [CrossRef] [EDP Sciences] [Google Scholar]
- Gavazzi, G., Fumagalli, M., Cucciati, O., & Boselli, A. 2010, A&A, 517, A73 [NASA ADS] [CrossRef] [EDP Sciences] [Google Scholar]
- Gavazzi, G., Fumagalli, M., Galardo, V., et al. 2012, A&A, 545, A16 (Paper I) [NASA ADS] [CrossRef] [EDP Sciences] [Google Scholar]
- Gavazzi, G., Fumagalli, M., Galardo, V., et al. 2013a, A&A, 553, A89 (Paper II) [NASA ADS] [CrossRef] [EDP Sciences] [Google Scholar]
- Gavazzi, G., Savorgnan, G., Fossati, M., et al. 2013b, A&A, 553, A90 (Paper III) [NASA ADS] [CrossRef] [EDP Sciences] [Google Scholar]
- Gavazzi, G., Consolandi, G., Dotti, M., et al. 2013c, A&A, 558, A68 [NASA ADS] [CrossRef] [EDP Sciences] [Google Scholar]
- Gavazzi, G., Franzetti, P., & Boselli, A. 2014, ArXiv e-prints [arXiv:1401.8123] [Google Scholar]
- Gavazzi, G., Consolandi, G., Viscardi, E., et al. 2015, A&A, 576, A16 (Paper V) [NASA ADS] [CrossRef] [EDP Sciences] [Google Scholar]
- Genzel, R., Tacconi, L. J., Gracia-Carpio, J., et al. 2010, MNRAS, 407, 2091 [NASA ADS] [CrossRef] [Google Scholar]
- Giovanelli, R., Haynes, M. P., Kent, B. R., et al. 2005, AJ, 130, 2598 [NASA ADS] [CrossRef] [Google Scholar]
- Gnerucci, A., Marconi, A., Cresci, G., et al. 2011, A&A, 528, A88 [NASA ADS] [CrossRef] [EDP Sciences] [Google Scholar]
- Haynes, M. P., & Giovanelli, R. 1984, AJ, 89, 758 [NASA ADS] [CrossRef] [Google Scholar]
- Haynes, M. P., Giovanelli, R., Martin, A. M., et al. 2011, AJ, 142, 170 [NASA ADS] [CrossRef] [Google Scholar]
- Henriques, B. M. B., White, S. D. M., Thomas, P. A., et al. 2013, MNRAS, 431, 3373 [NASA ADS] [CrossRef] [Google Scholar]
- Hernquist, L. 1993, ApJS, 86, 389 [NASA ADS] [CrossRef] [Google Scholar]
- Hirschmann, M., De Lucia, G., Wilman, D., et al. 2014, MNRAS, 444, 2938 [NASA ADS] [CrossRef] [Google Scholar]
- Ho, L. C., Filippenko, A. V., & Sargent, W. L. W. 1997, ApJ, 487, 591 [NASA ADS] [CrossRef] [Google Scholar]
- Huang, S., Haynes, M. P., Giovanelli, R., & Brinchmann, J. 2012, ApJ, 756, 113 [NASA ADS] [CrossRef] [Google Scholar]
- Hunt, L. K., & Malkan, M. A. 1999, ApJ, 516, 660 [NASA ADS] [CrossRef] [Google Scholar]
- Ilbert, O., Arnouts, S., Le Floc’h, E., et al. 2015, A&A, 579, A2 [NASA ADS] [CrossRef] [EDP Sciences] [Google Scholar]
- Jogee, S., Barazza, F. D., Rix, H.-W., et al. 2004, ApJ, 615, L105 [NASA ADS] [CrossRef] [Google Scholar]
- Jogee, S., Scoville, N., & Kenney, J. D. P. 2005, ApJ, 630, 837 [NASA ADS] [CrossRef] [Google Scholar]
- Jogee, S., Miller, S. H., Penner, K., et al. 2009, ApJ, 697, 1971 [NASA ADS] [CrossRef] [Google Scholar]
- Kassin, S. A., Weiner, B. J., Faber, S. M., et al. 2012, ApJ, 758, 106 [NASA ADS] [CrossRef] [Google Scholar]
- Kauffmann, G., Heckman, T. M., White, S. D. M., et al. 2003, MNRAS, 341, 54 [Google Scholar]
- Kim, W.-T., Seo, W.-Y., & Kim, Y. 2012, ApJ, 758, 14 [NASA ADS] [CrossRef] [Google Scholar]
- Kennicutt, R. C., Jr. 1998, ApJ, 498, 541 [NASA ADS] [CrossRef] [Google Scholar]
- Kraljic, K., Bournaud, F., & Martig, M. 2012, ApJ, 757, 60 [NASA ADS] [CrossRef] [Google Scholar]
- Kormendy, J. 2013, Secular Evolution of Galaxies (Cambridge University Press), 1 [Google Scholar]
- Kormendy, J., & Cornell, M. E. 2004a, Penetrating Bars Through Masks of Cosmic Dust, 319, 261 [Google Scholar]
- Kormendy, J., & Kennicutt, R. C., Jr. 2004b, ARA&A, 42, 603 [NASA ADS] [CrossRef] [Google Scholar]
- Krumholz, M. R., & McKee, C. F. 2005, ApJ, 630, 250 [NASA ADS] [CrossRef] [Google Scholar]
- Krumholz, M. R., McKee, C. F., & Tumlinson, J. 2009, ApJ, 699, 850 [NASA ADS] [CrossRef] [Google Scholar]
- Laurikainen, E., Salo, H., & Buta, R. 2004, ApJ, 607, L103 [NASA ADS] [CrossRef] [Google Scholar]
- Law, D. R., Steidel, C. C., Erb, D. K., et al. 2009, ApJ, 697, 2057 [NASA ADS] [CrossRef] [Google Scholar]
- Lee, J. C., Gil de Paz, A., Tremonti, C., et al. 2009, ApJ, 706, 599 [NASA ADS] [CrossRef] [Google Scholar]
- Lee, N., Sanders, D. B., Casey, C. M., et al. 2015, ApJ, 801, 80 [NASA ADS] [CrossRef] [Google Scholar]
- Lewis, I., Balogh, M., De Propris, R., et al. 2002, MNRAS, 334, 673 [NASA ADS] [CrossRef] [Google Scholar]
- Lilly, S. J., Carollo, C. M., Pipino, A., Renzini, A., & Peng, Y. 2013, ApJ, 772, 119 [NASA ADS] [CrossRef] [Google Scholar]
- Lotz, J. M., Jonsson, P., Cox, T. J., et al. 2011, ApJ, 742, 103 [NASA ADS] [CrossRef] [Google Scholar]
- Madau, P., Pozzetti, L., & Dickinson, M. 1998, ApJ, 498, 106 [NASA ADS] [CrossRef] [Google Scholar]
- Marinova, I., & Jogee, S. 2007, ApJ, 659, 1176 [NASA ADS] [CrossRef] [Google Scholar]
- Marinova, I., Jogee, S., Heiderman, A., et al. 2009, ApJ, 698, 1639 [NASA ADS] [CrossRef] [Google Scholar]
- Martinet, L., & Friedli, D. 1997, A&A, 323, 363 [NASA ADS] [Google Scholar]
- Martinez-Valpuesta, I., & Shlosman, I. 2004, ApJ, 613, L29 [NASA ADS] [CrossRef] [Google Scholar]
- Masters, K. L., Nichol, R. C., Haynes, M. P., et al. 2012, MNRAS, 424, 2180 [NASA ADS] [CrossRef] [Google Scholar]
- Mayer, L., & Wadsley, J. 2004, MNRAS, 347, 277 [NASA ADS] [CrossRef] [Google Scholar]
- Melvin, Th., Masters, K., & Lintott, Ch. 2014, MNRAS, 438, 2882 [NASA ADS] [CrossRef] [Google Scholar]
- Menéndez-Delmestre, K., Sheth, K., Schinnerer, E., Jarrett, T. H., & Scoville, N. Z. 2007, ApJ, 657, 790 [NASA ADS] [CrossRef] [Google Scholar]
- Nair, P. B., & Abraham, R. G. 2010, ApJ, 714, L260 [NASA ADS] [CrossRef] [Google Scholar]
- Navarro, J. F., Frenk, C. S., & White, S. D. M. 1997, ApJ, 490, 493 [NASA ADS] [CrossRef] [Google Scholar]
- Newman, S. F., Genzel, R., Förster Schreiber, N. M., et al. 2013, ApJ, 767, 104 [NASA ADS] [CrossRef] [Google Scholar]
- Noeske, K. G., Weiner, B. J., Faber, S. M., et al. 2007, ApJ, 660, L43 [Google Scholar]
- Norman, C. A., Sellwood, J. A., & Hasan, H. 1996, ApJ, 462, 114 [NASA ADS] [CrossRef] [Google Scholar]
- Oppenheimer, B. D., Davé, R., Kereš, D., et al. 2010, MNRAS, 406, 2325 [NASA ADS] [CrossRef] [Google Scholar]
- Patel, S. G., Holden, B. P., Kelson, D. D., Illingworth, G. D., & Franx, M. 2009, ApJ, 705, L67 [NASA ADS] [CrossRef] [Google Scholar]
- Peng, Y.-j., Lilly, S. J., Kovač, K., et al. 2010, ApJ, 721, 193 [NASA ADS] [CrossRef] [Google Scholar]
- Peng, Y.-j., Lilly, S. J., Renzini, A., & Carollo, M. 2012, ApJ, 757, 4 [NASA ADS] [CrossRef] [Google Scholar]
- Peng, Y., Maiolino, R., & Cochrane, R. 2015, Nature, 521, 192 [NASA ADS] [CrossRef] [Google Scholar]
- Poggianti, B. M., Smail, I., Dressler, A., et al. 1999, ApJ, 518, 576 [NASA ADS] [CrossRef] [Google Scholar]
- Raha, N., Sellwood, J. A., James, R. A., & Kahn, F. D. 1991, Nature, 352, 411 [NASA ADS] [CrossRef] [Google Scholar]
- Reese, A. S., Williams, T. B., Sellwood, J. A., Barnes, E. I., & Powell, B. A. 2007, AJ, 133, 2846 [NASA ADS] [CrossRef] [Google Scholar]
- Regan, M. W., & Teuben, P. J. 2004, ApJ, 600, 595 [NASA ADS] [CrossRef] [Google Scholar]
- Romano-Díaz, E., Shlosman, I., Heller, C., & Hoffman, Y. 2008, ApJ, 687, L13 [NASA ADS] [CrossRef] [Google Scholar]
- Sakamoto, K., Okumura, S. K., Ishizuki, S., & Scoville, N. Z. 1999, ApJ, 525, 691 [NASA ADS] [CrossRef] [Google Scholar]
- Sanders, R. H., & Huntley, J. M. 1976, ApJ, 209, 53 [NASA ADS] [CrossRef] [Google Scholar]
- Scannapieco, E., Silk, J., & Bouwens, R. 2005, ApJ, 635, L13 [NASA ADS] [CrossRef] [Google Scholar]
- Schreiber, C., Pannella, M., Elbaz, D., et al. 2015, A&A, 575, A74 [NASA ADS] [CrossRef] [EDP Sciences] [Google Scholar]
- Sellwood, J. A. 2014, Rev. Mod. Phys., 86, 1 [NASA ADS] [CrossRef] [Google Scholar]
- Sesana, A., Barausse, E., Dotti, M., & Rossi, E. M. 2014, ApJ, 794, 104 [NASA ADS] [CrossRef] [Google Scholar]
- Shen, J., & Sellwood, J. A. 2004, ApJ, 604, 614 [NASA ADS] [CrossRef] [Google Scholar]
- Sheth, K., Vogel, S. N., Regan, M. W., Thornley, M. D., & Teuben, P. J. 2005, ApJ, 632, 217 [NASA ADS] [CrossRef] [Google Scholar]
- Sheth, K., Elmegreen, D. M., Elmegreen, B. G., et al. 2008, ApJ, 675, 1141 [NASA ADS] [CrossRef] [Google Scholar]
- Sheth, K., Melbourne, J., Elmegreen, D. M., et al. 2012, ApJ, 758, 136 [NASA ADS] [CrossRef] [Google Scholar]
- Shlosman, I., Frank, J., & Begelman, M. C. 1989, Nature, 338, 45 [NASA ADS] [CrossRef] [Google Scholar]
- Skelton, R. E., Whitaker, K. E., Momcheva, I. G., et al. 2014, ApJS, 214, 24 [Google Scholar]
- Skibba, R. A., Masters, K. L., Nichol, R. C., et al. 2012, MNRAS, 423, 1485 [NASA ADS] [CrossRef] [Google Scholar]
- Springel, V. 2005, MNRAS, 364, 1105 [NASA ADS] [CrossRef] [Google Scholar]
- Springel, V., Di Matteo, T., & Hernquist, L. 2005, MNRAS, 361, 776 [NASA ADS] [CrossRef] [Google Scholar]
- Stasińska, G., Vale Asari, N., Cid Fernandes, R., et al. 2008, MNRAS, 391, L29 [NASA ADS] [Google Scholar]
- Swinbank, A. M., Sobral, D., Smail, I., et al. 2012, MNRAS, 426, 935 [NASA ADS] [CrossRef] [Google Scholar]
- Wang, J., Kauffmann, G., Overzier, R., et al. 2012, MNRAS, 423, 3486 [NASA ADS] [CrossRef] [Google Scholar]
- Weinmann, S. M., Kauffmann, G., van den Bosch, F. C., et al. 2009, MNRAS, 394, 1213 [NASA ADS] [CrossRef] [Google Scholar]
- Weinmann, S. M., Pasquali, A., Oppenheimer, B. D., et al. 2012, MNRAS, 426, 2797 [NASA ADS] [CrossRef] [Google Scholar]
- Weinzirl, T., Jogee, S., Khochfar, S., Burkert, A., & Kormendy, J. 2009, ApJ, 696, 411 [NASA ADS] [CrossRef] [Google Scholar]
- Williams, R. J., Quadri, R. F., Franx, M., van Dokkum, P., & Labbé, I. 2009, ApJ, 691, 1879 [NASA ADS] [CrossRef] [Google Scholar]
- Wilman, D. J., Fontanot, F., De Lucia, G., Erwin, P., & Monaco, P. 2013, MNRAS, 433, 2986 [NASA ADS] [CrossRef] [Google Scholar]
- Wisnioski, E., Glazebrook, K., Blake, C., et al. 2011, MNRAS, 417, 2601 [NASA ADS] [CrossRef] [Google Scholar]
- Wisnioski, E., Förster Schreiber, N. M., Wuyts, S., et al. 2015, ApJ, 799, 209 [NASA ADS] [CrossRef] [Google Scholar]
- Whitaker, K. E., Franx, M., Leja, J., et al. 2014, ApJ, 795, 104 [NASA ADS] [CrossRef] [MathSciNet] [Google Scholar]
- Wuyts, S., Förster Schreiber, N. M., Lutz, D., et al. 2011, ApJ, 738, 106 [NASA ADS] [CrossRef] [Google Scholar]
- Zibetti, S., Charlot, S., & Rix, H.-W. 2009, MNRAS, 400, 1181 [NASA ADS] [CrossRef] [Google Scholar]
All Tables
All Figures
|
Fig. 1 Panel a) star formation rate as a function of stellar mass at z = 0 for HI non-deficient galaxies. Green symbols represent galaxies in the Coma supercluster; blue symbols are in the Local supercluster. Red symbols are averages in bins of stellar mass. The derived star formation rate are computed from the Hα luminosity assuming a Chabrier IMF. The two green (blue) diagonal lines represent the selection bias on the SFR induced by the limited sensitivity of ALFALFA at the distance of Coma (Virgo), computed for galaxies with inclination of 10 and 45 degrees respectively. Panel b) specific star formation rate as a function of stellar mass at z = 0. Average values from our local sample (Coma+Virgo) are given with red dots with error bars. Orange points are from Huang et al. (2012) and cyan points are from Brinchmann et al. (2004) (SDSS at z = 0). The blue points are taken in the interval 0.05 <z< 0.08 from Bauer et al. (2013). All sets of points show remarkable consistency above 109.5 M⊙. |
| In the text | |
|
Fig. 2 Star formation rate as a function of stellar mass in bins of redshift. Data at z = 0 (red) are from this work (red symbols in Fig. 1). Data at z = 0.3 (blue) are from Bauer et al. (2013). Measurements in the interval 0.75 <z< 2.25 (black) are from Whitaker et al. (2014) (empty circles are for mass bins where individual galaxies were stacked when deriving IR luminosities); the points at z = 3 and z = 4.25 (green) are from Schreiber et al. (2015). Whitaker et al. (2014) and Schreiber et al. (2015) data are plotted above their respective completeness limit. |
| In the text | |
|
Fig. 3 Panel a) specific star formation rate as a function of stellar mass in bins of redshift. For all redshift bins the data are fitted with a broken power law with slope alow, holding below a critical mass (Mknee), and ahigh holding above Mknee (see Table 2). The blue line connects the loci of Mknee for the various redshifts. Panel b) position of the Mknee as a function of log (1 + z). Panel c) specific star formation at Mknee. Panel d) slope below and above Mknee (alow and ahigh). The position of Mknee and the specific SFR at Mknee increase approximately as (1 + z)2, while the mass quenching (given by ahigh) becomes less efficient with increasing redshift. |
| In the text | |
|
Fig. 4 SFR versus stellar mass for the local sample in Fig. 1, but with symbols corresponding to the visual morphology: disks without bulge or bar (blue), barred disks (red), and unbarred disks with a bulge (orange). The vertical dashed line indicates Mknee at z = 0. Within the same categories, distributions in bins of stellar mass and SFR are given in the top and right histograms. The top right panel gives the fraction of visually classified strong bars as a function of stellar mass, given separately for the whole sample (red), and for the local sample (within the distance of 40 Mpc, green). Owing to the small sampled volume, the third subsample lacks statistical weight at high mass (one barred galaxy over 4 objects in the highest mass bin), while the point at the low-mass end has the highest statistical significance (one barred galaxy over 85 targets). |
| In the text | |
|
Fig. 5 RGB image (SDSS) of the barred galaxy NGC 5921 (left panel). The bar extent is marked in red. Its g − i color profile along the major axis in units of corotation radius (dots) is superposed to the median color profiles of barred galaxies with mass above Mknee and different inclinations (<15 deg, 30 deg, 50 deg). The two dashed horizontal lines mark the color of typical LTGs and ETGs above Mknee. |
| In the text | |
|
Fig. 6 RGB images (SDSS) of three galaxies (left column) with increasing stellar mass (NGC 3596, NGC 5921, NGC 5701 from top to bottom) showing a regular spiral galaxy (top), a well-developed bar (middle), a barred ring (bottom). Face-on views of simulations of stars (second column) and gas densities (third column) from t = 1 to t = 4 Gyr showing a spiral disk galaxy (top) that becomes bar unstable (middle). Inside the corotation radius, the gas is conveyed towards the center and quickly consumed (except for little left along the bar). Outside the corotation radius, the gas is unperturbed and feeds peripheral star formation. At the latest time step (t = 9 Gyr) the galaxy fully develops its bar and the central region is completely evacuated of gas. A ring of gas is left outside and feeds the star formation, as confirmed by the rightmost column showing our Hα images. When the bar is well developed (the two bottom panels) the star formation is suppressed inside the bar corotation radius, but it is ongoing in the outer parts. Even centrally quenched galaxies host some emission on a nuclear scale (rightmost column). However, we caution that this emission is dominated by [NII] with respect to Hα (common in LINERs) and so does not indicate solely ongoing star formation. |
| In the text | |
|
Fig. 7 Color-mass diagram obtained with the g − i color (corrected for extinction in the Milky Way and for internal extinction). ETGs in the Coma and Local superclusters (small red points) are also shown for comparison. The LTGs are subdivided into galaxies with disks without a bulge or a bar (including dIrr and other blue dwarfs, light blues symbols) and galaxies that we classified as containing a strong bar. The colors of the latter are separately displayed as large red symbols within the corotation radius and with large blue squares outside the corotation radius. Fits to the colors of the inner and outer regions of barred galaxies (as well as for ETGs) are shown in the figure. |
| In the text | |
|
Fig. 8 Edge-on view of the same object at the t = 9 Gyr step of the simulation in Fig. 6. The azimuthal angle of the bar is along (perpendicular to) the line of sight in the top (bottom) panel. In both cases we would classify it as pseudobulge. |
| In the text | |
Current usage metrics show cumulative count of Article Views (full-text article views including HTML views, PDF and ePub downloads, according to the available data) and Abstracts Views on Vision4Press platform.
Data correspond to usage on the plateform after 2015. The current usage metrics is available 48-96 hours after online publication and is updated daily on week days.
Initial download of the metrics may take a while.