Fig. 1
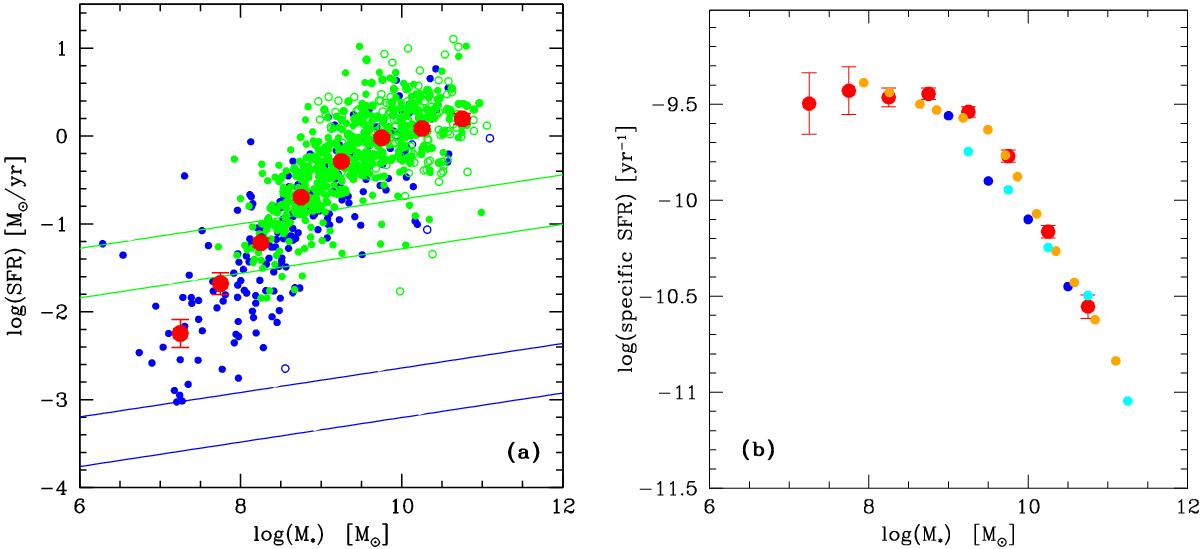
Panel a) star formation rate as a function of stellar mass at z = 0 for HI non-deficient galaxies. Green symbols represent galaxies in the Coma supercluster; blue symbols are in the Local supercluster. Red symbols are averages in bins of stellar mass. The derived star formation rate are computed from the Hα luminosity assuming a Chabrier IMF. The two green (blue) diagonal lines represent the selection bias on the SFR induced by the limited sensitivity of ALFALFA at the distance of Coma (Virgo), computed for galaxies with inclination of 10 and 45 degrees respectively. Panel b) specific star formation rate as a function of stellar mass at z = 0. Average values from our local sample (Coma+Virgo) are given with red dots with error bars. Orange points are from Huang et al. (2012) and cyan points are from Brinchmann et al. (2004) (SDSS at z = 0). The blue points are taken in the interval 0.05 <z< 0.08 from Bauer et al. (2013). All sets of points show remarkable consistency above 109.5 M⊙.
Current usage metrics show cumulative count of Article Views (full-text article views including HTML views, PDF and ePub downloads, according to the available data) and Abstracts Views on Vision4Press platform.
Data correspond to usage on the plateform after 2015. The current usage metrics is available 48-96 hours after online publication and is updated daily on week days.
Initial download of the metrics may take a while.