| Issue |
A&A
Volume 696, April 2025
|
|
|---|---|---|
| Article Number | A118 | |
| Number of page(s) | 17 | |
| Section | Extragalactic astronomy | |
| DOI | https://doi.org/10.1051/0004-6361/202452701 | |
| Published online | 09 April 2025 | |
Investigating the role of bars in quenching star formation using spatially resolved ultraviolet-optical colour maps
1
Indian Institute of Astrophysics, 2nd Block Koramangala, Bengaluru 560034, India
2
Pondicherry University, R.V. Nagar, Kalapet, 605014 Puducherry, India
3
Department of Physics, University of Alberta, CCIS 4-181 Edmonton, AB T6G 2E1, Canada
4
Faculty of Physics, Ludwig-Maximilians-Universitat, Scheinerstr. 1, Munich 81679, Germany
⋆ Corresponding author email: This email address is being protected from spambots. You need JavaScript enabled to view it.
, This email address is being protected from spambots. You need JavaScript enabled to view it.
Received:
22
October
2024
Accepted:
27
January
2025
Abstract
Context. Bars are ubiquitously found in disc galaxies and they are known to drive galaxy evolution through secular processes. However, the specific contribution of the bars in the suppression of star formation is still a matter of debate.
Aims. Our aim is to investigate the role of bars in quenching star formation using spatially resolved UV-optical colour maps and radial colour profiles of a sample of 17 centrally quenched barred galaxies in the redshift range of 0.02–0.06.
Methods. We selected the sample of centrally quenched barred galaxies based on their location in the SFR-M⋆ plane. They are classified as passive based on the parameters from the Max Planck Institute for Astrophysics (MPA) and Johns Hopkins University (JHU) value-added catalogue (MPA – JHU VAC); however, they have also been classified as non-passive based on the parameters from the GALEX-SDSS-WISE Legacy (GSWLC) catalogue, indicating a passive inner region and recent star formation in their extended disc. We used the archival SDSS optical r-band and GALEX far- and near- ultraviolet (FUV and NUV) imaging data of these galaxies and created spatially resolved (FUV−NUV versus NUV−r) colour-colour maps to understand the nature of the UV emission from different regions of these galaxies. We also analysed their NUV−r colour radial profiles and use the NUV−r colour as a proxy for the stellar population age in the different regions of these galaxies. We also analysed a control sample of eight centrally quenched unbarred galaxies to disentangle the effect of bulge and bar in quenching star formation.
Results. The centrally quenched barred galaxies display redder colours (NUV−r > 4 – 4.5 mag) in the inner regions, up to the length of the bar, indicating the age of the stellar population in these regions is older than > 1 Gyr. Most barred galaxies in our sample host pseudo-bulges and do not host an active galactic nucleus (AGN), indicating that the most probable reason for the internal quenching of these galaxies is the action of stellar bar. In comparison to their unbarred counterparts, lying in a similar regime of stellar mass and redshifts, the barred galaxies show redder colours (NUV−r > 4 mag) to a larger spatial extent.
Conclusions. In their later stages of evolution, bars turn the inner regions of galaxies redder, leading to quenching, with the effect being most prominent up to the ends of the bar and creating a region dominated by older stellar population. This may occur because bars have already funneled gas to the galactic centre leaving behind no fuel for further star formation. Spatially resolved studies of a larger sample of barred galaxies at different redshifts will provide more insights to the role of bar in quenching star formation and the different evolutionary stages of quenching.
Key words: galaxies: evolution / galaxies: photometry / galaxies: spiral / galaxies: star formation / galaxies: structure / ultraviolet: galaxies
© The Authors 2025
 Open Access article, published by EDP Sciences, under the terms of the Creative Commons Attribution License (https://creativecommons.org/licenses/by/4.0), which permits unrestricted use, distribution, and reproduction in any medium, provided the original work is properly cited.
This article is published in open access under the Subscribe to Open model. This email address is being protected from spambots. You need JavaScript enabled to view it. to support open access publication.
1. Introduction
The suppression of star formation in galaxies is known as quenching and it plays an important role in the evolution of galaxies (Man & Belli 2018). The connection of quenching to galaxy evolution is observed in the optical colour distribution of galaxies in the Local Universe. It shows a bimodal distribution, with the blue region mostly populated by star-forming galaxies and the red region dominated by galaxies with little or no ongoing star formation (known as passive galaxies; Strateva et al. 2001; Baldry et al. 2004). Such a bimodality in the rest-frame colour distribution of galaxies exists up to a redshift of z ∼ 1. However, from z ∼ 1 to the present epoch, the population of blue, luminous galaxies is gradually declining, while the number of red galaxies is consistently growing. This implies that a good fraction of blue galaxies halt their star formation and become part of the red sequence (Bell et al. 2004; Faber et al. 2007). Another manifestation of this bimodal optical colour distribution can be seen in the star formation rate (SFR) versus stellar mass (M⋆) plot (Salim et al. 2007). The three-dimensional (3D) SFR-M⋆ relation of local galaxies (with the third dimension accounting for the number of galaxies in the SFR-M⋆ bins) in the Sloan Digital Sky Survey (SDSS) database show two prominent peaks: one for star-forming galaxies and one for the quenched ones (Renzini & Peng 2015). The star-forming galaxies show a clear correlation with M⋆ and form a main sequence (MS) in the two-dimensional (2D) SFR – M⋆ plane. The position of galaxies from the MS is widely used to identify galaxies that do not belong to the MS, such as starburst outliers on one side and the quenched or passive galaxies on the other side (Wuyts et al. 2011; Morselli et al. 2017; Guo et al. 2018).
Identifying the physical mechanism responsible for star formation quenching in galaxies is one of the open questions. Both internal mechanisms (i.e. feedback from AGNs and stars, action of stellar bars, and bulges) and external ones (ram pressure stripping, major mergers, harassment, starvation, strangulation) have been proposed to be responsible for quenching (see Peng et al. 2015; Man & Belli 2018 and references therein). For external processes such as ram pressure stripping or strangulation, star formation quenching is expected to happen outside-in, while internal processes, such as the action of bulges, bars, and active galactic nuclei (AGNs) would show an inside-out trend of quenching (Lin et al. 2019). Furthermore, George & Subramanian (2021) suggested that different SFR indicators can be used to identify centrally quenched galaxies (i.e. which are undergoing inside-out quenching) in the local Universe. In this study, we aim to focus on the barred spiral galaxies that are centrally quenched with extended star-forming discs to understand the effect of bars in quenching star formation (Gavazzi et al. 2015; Spinoso et al. 2016; Khoperskov et al. 2018; George et al. 2019).
Bars are known to be non-axisymmetric structure in the centre of spiral galaxies that can survive for longer time scales (in Gyrs), even though it only takes million years to form a bar (Sellwood & Wilkinson 1993; Kraljic et al. 2012; Fragkoudi et al. 2020). Cheung et al. (2013) found that the likelihood of a galaxy to host a bar is anti-correlated with the specific SFR, regardless of stellar mass or prominence of the bulge. Barred galaxies are also found to have lower star formation activity compared to unbarred galaxies (Consolandi et al. 2017; Kim et al. 2017). Fraser-McKelvie et al. (2020b) analysed the stellar populations and star formation histories of 245 barred galaxies from the Mapping Nearby Galaxies at APO (MaNGA) galaxy survey, and suggested that the presence of a bar and the early cessation of star formation within a galaxy are intimately linked. These results suggest possible role of bars in regulating and eventually quenching of star formation in galaxies. Bars are understood to redistribute angular momentum in disc galaxies, influencing gas inflows and star formation regulation, and the overall stability of the disc (Romeo et al. 2023). The suppression of star formation aided by bars within the region between the nuclear or central sub-kpc region and the ends of the bar is known as bar-quenching. There are two possible scenarios which can lead to bar-quenching. At the early stages of its formation, stellar bar induces torque on the gas within its extent which drives gas inflows to the centre of the galaxy. This can enhance star formation along the bar. But as the bar reaches its maximum length, the infalling gas is all consumed. This leads to depletion of gas and quenching of star formation within the central region of the galaxy (Combes & Gerin 1985; Spinoso et al. 2016; James et al. 2009; James & Percival 2015, 2018; Donohoe-Keyes et al. 2019; George et al. 2020; Newnham et al. 2020; Géron et al. 2021; Scaloni et al. 2024). Many observations and simulations suggest this scenario of bar-driven quenching of star formation, with the bar-hosting region to be devoid of Hα and molecular gas (Gavazzi et al. 2015; Consolandi et al. 2017). Another possible mechanism of bar quenching is due to the bar induced shocks and shear, which increase the turbulence of gas in the bar region and in turn stabilise the gas against collapse leading to inhibition of star formation (Reynaud & Downes 1998; Haywood et al. 2016; Khoperskov et al. 2018; Hogarth et al. 2022; Kim et al. 2024). Several individual studies have focussed on the SFR, molecular gas fraction, and star formation efficiency in the bar region, ultimately finding a low star formation efficiency, even with the presence of molecular gas, and suggested that it could be due to shocks and shear produced by the bar (Pessa et al. 2022; Maeda et al. 2023). It is not well understood whether one or a combination of these two processes or a different unknown mechanism is responsible for bar quenching. The net effect of both the processes explained above is quenching of star formation within the co-rotation radius of barred galaxies, with little or no star formation in the sub-kpc nuclear region. The presence or absence of star formation in the central sub-kpc region may depend on the evolutionary stage of bar-quenching (George et al. 2020). Other quenching mechanisms, such as cosmological starvation (Gavazzi et al. 2015) and/or environmental effects (Skibba et al. 2012), can transform these centrally quenched barred galaxies into fully passive galaxies (George et al. 2019).
The galaxies hosting strong bars are found to be gas-poor and those which do not host a strong bar are found to be gas-rich (Masters et al. 2012). This indicates that it might be difficult to form or grow bars in the discs of gas rich galaxies. Simulations do show that the presence of significant amount of gas can inhibit or slow down bar formation and bars form easily in gas poor discs (Villa-Vargas et al. 2010; Athanassoula et al. 2013; Algorry et al. 2017). Thus, an alternate explanation for the observed properties of barred galaxies that they are globally redder, older, and more metal-rich than unbarred galaxies of similar mass, is that the strong bars are formed in quenched discs. However, strong bars do exist in gas rich discs galaxies (Newnham et al. 2020) and very recent studies have observed bar formation in gas-rich environments at redshifts of z ∼ 3.8 (Amvrosiadis et al. 2024). Thus, the role of bars in the suppression of star formation is still under inspection. Spatially resolved studies of barred galaxies to find the age of stellar populations across different regions of the galaxy will help to improve our understanding of the evolution of bar, as well as the coupling between the bar and disc evolution. Hence, we can also better understand the role of bars in the evolution of galaxies.
The bar driven quenching scenario has been investigated in a spatially resolved manner by various studies (Gavazzi et al. 2015; Consolandi et al. 2017; James & Percival 2018; George et al. 2019, 2020; Scaloni et al. 2024 and references therein), using different tracers of star formation (such as molecular gas, atomic gas, dust emission, ionised gas, UV emission from young stars). All of the above studies are limited to nearby galaxies (10–100 Mpc distance or redshift < 0.02). From the study of spatially resolved star formation in local barred galaxies (z ≤ 0.15), using MaNGA data, Fraser-McKelvie et al. (2020a) found that bars play an important role in the galaxy’s ongoing star formation. However, due to MaNGA’s limited field of view, they mainly analysed the bar region of the sample galaxies and does not include the extended disc region. Recent JWST observations (Guo et al. 2023; Le Conte et al. 2024) have revealed barred galaxies at very high redshifts (z ≥ 2.5), suggesting that bar-driven quenching may also operate in the early Universe. And if this mechanism is effective at these redshifts, it could lead to galaxies being quenched very early when the Universe was still young. Hence, to better understand how passive galaxies form over time and the role played by bars in quenching star formation, we need to study barred galaxies in a spatially resolved manner (including the bar and disc regions) across different redshifts. In this context, we analyse a sample of nearly face-on barred galaxies, which are centrally quenched and host star-forming discs, within a redshift range of 0.02–0.06, using spatially resolved UV-optical colour-colour maps to understand the role of bars in quenching star formation.
The centrally quenched systems are identified based on their location in the SFR versus M⋆ plots created using the M⋆ and SFR values from the Max Planck Institute for Astrophysics (MPA) and Johns Hopkins University (JHU) value-added catalogue (MPA – JHU VAC, Brinchmann et al. 2004) and the GALEX-SDSS-WISE Legacy Catalogue (GSWLC, Salim et al. 2018). In the MPA-JHU catalogue, the fibre-based SFRs are derived from the SDSS spectra (the spectra is collected with 3 arcsec-sized fibre) using the Hα line flux for star-forming galaxies, and an empirical relation between specific SFR and Dn4000 index for AGN or weak emission line galaxies. Aperture corrections are then estimated by deriving out-of-fiber SFRs via spectral energy distribution (SED) fitting to the SDSS u, g, r, i, and z photometry. The GSWLC catalogue SFR estimates are based on the SED fitting from ultraviolet (UV) to mid-infrared (MIR) photometric data that fully covers the galaxy with no aperture correction required. Cortese et al. (2020) suggested that the aperture-corrected SFR estimates from the MPA – JHU SDSS DR7 catalogue, may not provide a fair representation of the global SFR of galaxies with extended star-forming discs. Thus, galaxies which are classified as quenched/passive in the SFR-M⋆ plane, based on the parameters from the MPA-JHU catalogue, but are non-passive (green valley or star-forming) based on the parameters from the GSWLC catalogue, are potential candidates for centrally quenched systems, with star-forming discs (George & Subramanian 2021). These galaxies might be undergoing internal quenching, potentially driven by mechanisms like AGN feedback, influence of stellar bar or bulge as discussed before. If the central quenching is due to stellar bar, then we expect to see older population in a region of a size comparable to the size of the bar and younger population in the outer disc. We use the UV-optical colours of different regions of barred galaxies to probe the role of the bar in quenching.
The UV emission in galaxies is predominantly from young star-forming regions, which host massive O and B type stars. However, evolved, hot stellar populations such as the horizontal branch stars, post asymptotic giant branch stars, and white dwarfs can emit in UV and this excess UV emission (in FUV) due to old and hot (or extreme) horizontal branch stars is known as UV upturn. We note that the AGN/LINER activity can also contribute to the UV emission in the galaxies, but in this work (as shown in Sect. 2) we study galaxies which do not host AGN. The UV-optical colour-colour map, introduced by Yi et al. (2011), which makes use of two colour indices, FUV−NUV and NUV−r, is a powerful tool to understand the nature of UV emission in galaxies and classify them into UV upturn, UV weak or star-forming categories. Along with the UV-optical colour-colour map, we also analyse the radial profiles of NUV−r colour, which is a good photometric indicator of star formation in the last 1 Gyr (Salim et al. 2005; Kaviraj et al. 2007; Salim 2014; Pan et al. 2016), of our sample galaxies.
The main goals of this study are to: (1) identify barred galaxies which are probable candidates of centrally quenched systems, based on their location in the SFR versus M⋆ plots created using the MPA-JHU and GSWLC catalogues; (2) make spatially resolved UV-optical colour-colour maps of different regions of these galaxies and classify the regions as either star-forming or UV-upturn (due to old hot stellar population). Based on these colour-colour maps and the NUV−r colour radial profiles, check whether these systems are actually centrally quenched galaxies or not and to identify the location of star-forming region of the galaxies; and (3) if the galaxies are indeed centrally quenched galaxies, we want to check whether there is any correlation with the size of the centrally quenched region and the size of the bar, supporting the role of bar in quenching the inner regions of the galaxies. The structure of the paper is as follows. Section 2 describes the procedure followed for sample selection. Sections 3 and 4 provide information about data and the methods employed for the analysis of the whole sample. In Section 5, we present our results and try to understand the impact of different morphological features and their properties in central quenching. In Section 6, we discuss our results regarding the significant role of the bar in central quenching. In Section 7, we summarise our work. We adopt standard flat cosmological model with H0 = 70 Km s−1 Mpc−1, ΩM = 0.3, and ΩΛ = 0.7.
2. Sample selection
We used the catalogues provided by Nair & Abraham (2010) (hereafter, NA10) and Kruk et al. (2018) (hereafter, K18) to identify the sample of barred spiral galaxies. A control sample of unbarred galaxies was also taken from NA10 (discussed in Sect. 6).
The catalogue by NA10 provides detailed visual morphological classifications for a comprehensive set of 14 034 galaxies from SDSS Data Release 4 (DR4). The catalogue gives information about a galaxy’s morphology in terms of its T-type and whether it contains a bar. The T-type offers a scale (ranging from −5 to 0 for ellipticals and lenticulars and from 1 to 7 for spirals, with higher values for Magellanic and irregular types) to quantify a galaxy’s morphological type in a more continuous manner compared to the traditional Hubble classification. We selected spiral galaxies with T-types ranging from 1 to 7. From this catalogue, we identified 2113 barred spiral galaxies. To select only those galaxies that are not significantly affected by external influence, we excluded those which are in pairs or undergoing interactions based on the given flags in the NA10 catalogue. This reduces the number of barred galaxy sample to 1567. Additionally, this catalogue also provides information on the type of AGN, based on the line flux measurement from the SDSS spectra, and criteria from Kauffmann et al. (2003) and Kewley et al. (2001). We note that AGN feedback can also quench star formation in the inner regions of the galaxies. In this study, we have mainly focussed on the role of the bar in quenching star formation. Thus, we removed galaxies classified as AGNs and reduced the sample to 1044 barred galaxies.
The catalogue by K18 comprises of 2D photometric decomposition of ∼3461 local barred galaxies from the Galaxy Zoo 2 project (Willett et al. 2013). In their study, 2D decomposition on the SDSS images was performed with bar and disc components considered for all the galaxies, and a bugle component is used when required for a good fit. As we plan to study the spatially resolved colour-colour maps of our sample galaxies, we removed inclined galaxies with b/a < 0.5 and also applied a cut-off in the redshift and removed those with z > 0.06. After applying these two cuts, the number of barred galaxies reduced to 830 and 3327 barred galaxies from NA10 and K18, respectively, resulting in 4157 total barred galaxies.
In order to identify the centrally quenched galaxies, we need to compare the nature of their star formation based on the parameters from both the MPA-JHU and the GSWLC catalogues. So, we cross-matched the sample of 4157 barred galaxies with both these catalogues. We found 2065 galaxies (491 from NA10 & 1574 from K18) in common with defined logM⋆ and logSFR parameters. The MPA-JHU catalogue also provides information about the AGN class based on emission line diagnostics from the SDSS spectra. We removed galaxies which are classified as AGN or LINERs. This led to a sample of 1501 barred galaxies (376, NA10 & 1125, K18) barred galaxies. The SFR-M⋆ plots, created based on the parameters from the MPA-JHU and the GSWLC catalogues are shown in the upper and lower panels of Fig. 1, with the classification lines taken from Bluck et al. (2020) and Guo et al. (2018) respectively.
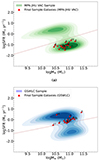 |
Fig. 1. SFR-M* relation defined for the final sample of 18 barred galaxies with two different SFR indicators: MPA-JHU Value Added Catalogue and GSWLC M2 catalogue. (a) SFR-M* relation for MPA-JHU VAC (Brinchmann et al. 2004) (green contours) with red line representing SFMS−1.1 dex adopted from Bluck et al. (2020). Our sample galaxies are quenched based on MPA-JHU SFR estimates. (b) SFR-M* relation for GSWLC catalogue (Salim et al. 2018) (blue contours) with red line representing SFMS−0.6 dex taken from Guo et al. (2018). Our sample galaxies are unquenched based on GSWLC SFR estimates indicating these are non-passive systems. The discrepancy is due to the estimation of SFR using different techniques adopted for both catalogues as described in Sect. 2. |
Bluck et al. (2020) used the star-forming main sequence (SFMS) relation provided by Renzini & Peng (2015) and classified galaxies within the ±0.5 dex lines as star-forming galaxies, galaxies above the +0.5 dex line are considered as starburst galaxies, galaxies between −0.5 dex and −1.1 dex are considered as Green Valley galaxies, and galaxies below the −1.1 dex line (shown as red line in Fig. 1a) are considered as passive galaxies. Guo et al. (2018) found the MS relation using the sample from the GSWLC catalogue and classified galaxies within the ±0.2 dex of the relation as star-forming, galaxies above the +0.2 dex line as starbursts, galaxies between −0.2 dex and −0.6 dex are considered as green valley galaxies, and galaxies below the −0.6 dex line (shown as red line in Fig. 1b) are considered as passive galaxies. Thus the empirical form of the SFMS relation can be used to separate different regions on the M⋆ – SFR plane as star-forming, starburst, and passive. The cut of −0.6 dex below the MS to identify passive galaxies, is higher than the conventional cut used in literature to classify passive galaxies. So by selecting galaxies above this cut, we select the highly probable non-passive galaxies. We employed the above-described criteria to the sample of 1501 barred galaxies and selected those galaxies which are located below the red line (SFMS−1.1 dex corresponding to passive region in MPA-JHU catalogue) based on MPA-JHU catalogue SFR estimates (Fig. 1a) but lie above the red line (SFMS−0.6 corresponding to passive region in GSWLC catalogue) based on GSWLC SFR estimates (Fig. 1b). We found 87 galaxies (11, NA10 and 76, K18) galaxies out of 1501 that are classified as quenched according to the MPA-JHU parameters and classification provided by Bluck et al. (2020) – but which have been classified as unquenched according to GSWLC parameters and the classification provided by Guo et al. (2018). These 87 barred galaxies are potential candidates of centrally quenched galaxies with central quenching likely due to the effect of bars. We then applied a stellar mass cut of M⋆ > 1010 M⊙ to the sample to select massive galaxies and the sample reduced to 80 galaxies. We then checked for the availability of GALEX DR6/DR7 imaging data in both FUV and NUV bands for our sample of 80 barred galaxies ensuring full coverage. As we want to analyse the UV emission in the inner as well as outer regions of our sample galaxies, for further analysis, we selected only those galaxies which are observed under the Medium/Deep imaging surveys of GALEX. These observations have a typical exposure time greater than 1000s. This resulted in a subset of 39 galaxies (7, NA10 and 32, K18) with GALEX data. After identifying 5 duplicate galaxies present in both samples and removing them from the NA10 sample, our refined sample ended up with 34 galaxies, with 2 from NA10 and 32 from K18.
Since our goal is to study centrally quenched galaxies with no traces of ongoing (10 Myr) star formation, we visually inspected the SDSS spectra, which correspond to the central 3 arcsec region of these candidate galaxies, and removed those that show some amount of Hα emission (which might indicate ongoing star formation or LINER activity). We found 12 galaxies that show emission in the central regions, which could contain those galaxies that are showing the last event of star formation in the central sub-kpc regions and are in the final stages of bar-quenching. This sample will be analysed in detail in our future work. After removing the 12 galaxies which show emission in the central regions, our sample reduced to 22 galaxies, the most probable candidates of centrally quenched barred galaxies. We further cross-checked our final sample using the GSWLC M1 (Salim et al. 2016) based parameters for unquenched galaxies, retaining only those unquenched in both GSWLC M1 and GSWLC M2. The GSWLC M1 (Salim et al. 2016) and GSWLC M2 (Salim et al. 2018) differ in terms of their SFRs derived from SED fitting with the former used UV/optical photometry and the latter employed UV+Optical+mid-IR photometry. Additionally, the slope of the attenuation curve and the strength of the 2200 Å feature are taken as free parameters in GSWLC M2. Thus, our final sample consists of 18 barred galaxies, with 2 from NA10 and 16 from K18. The different criteria applied for the selection of the final sample are given in Table 1. The detailed information about the various properties of our sample galaxies is provided in Table 2. The majority of our sample galaxies have stellar masses higher than that of L⋆ galaxies. Three galaxies in our sample have HI mass estimates available from the ALFALFA-SDSS galaxy catalogue (Durbala et al. 2020) and these HI masses are roughly 10% of their stellar masses. The location of the final sample of 18 galaxies in the SFR-M⋆ plane based on the MPA-JHU and the GSWLC catalogues are shown, as red triangles, in the upper and lower panels of Fig. 1.
Final sample of barred galaxies is obtained based upon the following cuts and criteria mentioned in the table below from two catalogues, K18 and NA10.
We note that we have not given any specific selection cuts to the K18 sample, to understand their environment. To evaluate the environment of these galaxies, we defined a cubic box with a width of 1 Mpc centred on each galaxy and estimated the number of neighbouring galaxies within this volume using data from the NASA Extragalactic Database (NED1). Approximately 66% of the sample galaxies have no neighbours, 22% have one or two neighbours, and only 11% have 3 neighbours. The presence of nearby neighbours can influence the formation of bars in galaxies (Romano-Díaz et al. 2009; Kazantzidis et al. 2008), but their contributions to the quenching of star formation in barred regions may be minimal. The impact of the environment is likely to primarily affect the disc star formation. Furthermore, studies indicate that environmental effects are nominal for galaxies with stellar masses exceeding 1010.5 M⊙ (Guo et al. 2018). As the aim of our study is to understand the effect of bars in the internal quenching of star formation, we do not expect the environmental effects to affect our final results.
3. Data
Our aim is to study the spatially resolved UV-optical colour-colour maps of the centrally quenched barred galaxies. For this, we have used the SDSS r-band (5500–7000 Å with central wavelength 6166 Å) optical images from the SDSS DR7, Abazajian et al. 2009) for the photometric analysis. We opted for SDSS data over deeper optical surveys like DECaLS (Dey et al. 2019) because the two catalogues from which our sample is drawn are based on the SDSS database and provide structural properties using SDSS images exclusively. In SDSS r-band image, each pixel traces 0.396 arcseconds and the point spread function (PSF) in r-band is 1.32 arcsecond. The data is readily downloaded from SDSS DR7 skyserver. The postage stamp of SDSS colour composite images taken from SDSS skyserver for all our sample galaxies is shown in Fig. 2. We have also employed GALEX (Galaxy Evolution Explorer, Martin et al. 2005) FUV (1344–1786 Å) and NUV (1771–2831 Å) bands imaging data with effective wavelengths, 1538.6 and 2315.7 Å respectively and they are accessed through the MAST2 portal. The FWHM for FUV and NUV channels corresponds to 4.2 and 5.3 arcseconds respectively (Morrissey et al. 2007).
The image cutouts of size ∼2′×2′ are made for our sample galaxies, centred on the source coordinates. The r-band images are background subtracted based on mean background calculated from different source-free positions in the images while the background maps are available for GALEX images for background subtraction. As the spatial resolution of the GALEX FUV (∼4.2″), GALEX NUV (∼5.3″), and SDSS r-band (∼1.3″) images are different, we first degraded the GALEX FUV and SDSS r-band images to the resolution of the GALEX NUV having coarser resolution to match the NUV PSF. The FUV and r-band images are degraded to the NUV resolution using a Gaussian 2D convolution, where the width (defined as σ) of the Gaussian kernel used to convolve with the original images is calculated using target PSF and original PSF. The convolution is performed in pixel space for both FUV and r-band images, with σ = 5.52 pixels (2.19 in arcsec) for the r-band image and σ = 0.92 pixels (1.38 arcsec) for the FUV image. Foreground as well as nearby sources are all masked with the minimum pixel count. These background subtracted and cleaned image cutouts are used for further analysis. However, for the measurement of bar lengths, described in Sect. 4.3, we use the original SDSS r-band images with a native resolution of ∼1.3″.
4. Analysis
4.1. UV-optical colour-colour map
Our sample of 18 barred spiral galaxies is found to be passive in nature based on their parameters in the MPA-JHU catalogue and is found to be non-passive based on their parameters in the GSWLC catalogue. As explained earlier, we leverage this discrepancy to identify them as the centrally quenched systems with outer star-forming discs. However, Zhang et al. (2021) noted that the SFR based on the GSWLC, could have been overestimated as the UV and IR emission of quenched galaxies can be contaminated by old hot stellar population and/or by AGN/LINER activity. We note that we have already removed AGN/LINER galaxies from our sample. To understand the contribution of UV emission from old hot stellar population, we used the UV-Optical colour-colour map criteria provided by Yi et al. (2011). The excess of UV emission (in FUV) due to old and hot horizontal branch stars is known as UV upturn. Yi et al. (2011) investigated the UV upturn phenomenon in elliptical galaxies and used their foreground reddening corrected NUV−r, FUV−NUV and FUV−r colours to classify them as UV upturn galaxies, UV weak galaxies or those with residual star formation. The limit of NUV−r = 5.4 was used to differentiate UV emission arising from older hot stellar populations, such as horizontal branch (HB) and extreme horizontal branch (EHB) stars, from that produced by young stellar populations. Young massive stars emit intense UV radiation, resulting in a bluer NUV−r colour (Yi et al. 2011). A FUV−NUV colour < 0.9 is indicative of a rising UV slope with decreasing wavelength and corresponding to a flat UV spectrum in the λ − Fλ domain, it is used to identify the UV upturn nature of galaxies, which reflects the presence of old hot stars. The criterion FUV−r < 6.6, represents a high relative UV flux to optical flux.
The FUV, NUV, and r-band magnitudes of our sample galaxies are estimated using the fixed elliptical aperture photometry on the PSF matched and background subtracted FUV, NUV, and r-band images. We used the R25 value (radii at which surface brightness reaches 25 mag arcsec−2 in the B-band) given in Table 2 (taken from NED) as the galaxy semi-major axis. We used the position angle extracted from the Ellipse task and b/a values given in the NA10 and K18 to define the elliptical apertures in the r, FUV, and NUV images. The count rates are converted to magnitudes using the appropriate zero points (18.82 for GALEX FUV and 20.08 for NUV (Morrissey et al. 2007); SDSS r-band photometric zero point is provided in image header along with atmospheric extinction parameters). The magnitudes are corrected for the foreground galactic dust extinction using the reddening values provided by Schlafly & Finkbeiner (2011) and the reddening law by Cardelli et al. (1989). The reddening corrected colours of our sample galaxies are plotted on the colour-colour map, which is shown in Fig. 3. Extinction errors along with magnitude errors are also taken into account in the colours of each galaxy.
Galaxies in our sample.
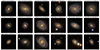 |
Fig. 2. Postage stamp of colour composite images of the final sample for 18 barred galaxies from SDSS DR7 u,g,r,i, and z bands. Each image is ∼ 1 arcmin × 1 arcmin with redshift ranging from 0.01–0.06. The SDSS id is also provided on the top of each image. More information on the sources is available in Table 2. |
From our initial sample of 18 galaxies, we identified one galaxy, galaxy no. 14, to be in the UV weak region of the UV-optical colour-colour map. The remaining 17 galaxies have UV-optical colours corresponding to ongoing star formation. However, as discussed earlier, the SDSS central spectra of these galaxies and their location in the SFR-M⋆ plot based on the parameters from the MPA-JHU catalogue, indicate that they are passive galaxies. These suggest that the ongoing star formation in these galaxies might be happening in their outer disc and these galaxies are centrally quenched. Indeed, also from the visual inspection of the SDSS colour images shown in Fig. 2, it is evident that these galaxies are characterised by a passive inner component (presence of regions with red colour) and a star-forming outer disc (relatively bluer colour in outskirts). As these galaxies do not host AGN, the quenching of star formation in the central regions might be due to bars and/or bulges. In the next sub-section, we discuss the bulge properties of our sample galaxies.
4.2. Bulge properties
Our sample contains barred galaxies contained from the catalogue of K18 and NA10. The K18 sample provides structural parameters for the barred disc galaxies using bulge+bar+disc decomposition in five SDSS bands (u,g,r,i, and z) by employing an automated GALFITM tool which is a modified version of GALFIT3.0 (Peng et al. 2010). Basically, GALFIT performs a 2D fitting of a parametric function to the surface brightness profile for the galaxy. The image of the galaxy is fitted with an exponential or sérsic profile, and the model and residual image are obtained after convolving the model with the PSF of the image. It provides structural properties like photometric magnitude, effective radius (re), sérsic index (n), axis ratio (b/a), and position angle (PA) for each structural component. Out of 18 galaxies, 16 galaxies have their structural parameters available from K18. Two of our sample galaxies (Galaxy no. 4 and 5) are from NA10 and do not have the structural properties available. For these 2 galaxies, we used GALFIT tool on SDSS r-band image and obtained their structural parameters. For comparison, we performed a similar exercise on other galaxies with catalogue values and confirmed that the values we derived matched those in the catalogue. In Table 3, we provide the photometric r-band magnitude of bar (rbar) and bulge (rbulge), their effective radii (re, bar and re, bulge), and sérsic indices (nbar and nbulge). The sérsic index of our sample galaxies, excluding galaxy no. 14, is less than 2, indicating the pseudo nature of these bulges (Fisher & Drory 2008, 2010). The galaxy no. 14, was found to be falling in the UV weak region in Fig. 3 and hence was already removed from our further analysis. The suppression of star formation is expected from classical bulges, which are formed during mergers. However, our sample does not have any galaxies with classical bulges. This suggests that the suppression of star formation in the central regions of our sample galaxies can be considered to be due to the action of bar.
Structural parameters from K18 derived from the photometric decomposition of barred disc galaxies in five SDSS bands (u, g, r, i, and z) using the automated GALFITM tool.
If the central quenching is due to the effect of bar, then we expect to see no recent star formation in a region with size comparable to the size of the bar (James et al. 2009; George et al. 2019, 2020, and references therein). Scaloni et al. (2024) did a spatial level deviation of distance from the MS and showed that SFR is indeed very low along the bar region. To check these hypotheses, we want to identify the nature of star formation in different regions of these galaxies. We plan to do this by creating spatially resolved UV-optical colour-colour maps of these galaxies. In order to divide the galaxy into different sub-regions, especially with respect to the size of the bar, we estimated the length of the bar in these galaxies using isophotal analysis. This is described in the next Section.
4.3. Measurement of bar length
The bar length can be measured using different known methods like ellipse fits (Jogee et al. 2004; Erwin 2005; Menéndez-Delmestre et al. 2007; Yu & Ho 2020; Guo et al. 2023), Fourier decomposition (Athanassoula et al. 1990; Rosas-Guevara et al. 2020, 2022) or simply by visual inspection (Cheung et al. 2013). Although there is no general agreement on which method is preferable, each method comes with its advantages and limitations (Aguerri et al. 2009; Lee et al. 2019). The Fourier decomposition is very suitable for stronger bars due to high sensitivity of Fourier mode m = 2 (Athanassoula & Misiriotis 2002) but less effective for weak bars (Lee et al. 2019). Similarly, visual inspection generates better outcomes only for stronger bars. Compared to these two methods, isophotal ellipse fits and the radial profile of ellipticity is more robust to find bar length and applies for both strong and weak bars. Isophotes, representing contours of constant surface brightness in a galaxy image, can reveal features such as bars, spiral arms, and other substructures. By fitting ellipses to isophotes at various radii, we can map a galaxy’s 2D light distribution in detail. This method only fails for low signal-to-noise and clumpy structures. In this paper, our sample of barred galaxies is drawn from K18 and NA10. The K18 galaxies are further a subsample of Galaxy Zoo 2 (GZ2) project (Lintott et al. 2008; Willett et al. 2013) where bars are identified based on a debiased bar likelihood and the K18 primarily selected strong and intermediate bars in their cuts. Similarly, NA10 employed visual identification for bars and mentioned that their bars identified belong to subclasses of the strong bar classification in RC3 (de Vaucouleurs et al. 1991). Consequently, our sample galaxies have all been visually identified with structural properties avoiding the issues of low signal-to-noise and any clumpy structures.
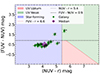 |
Fig. 3. FUV−NUV and NUV−r colour colour map plotted with integrated colours (green points) of final sample (18 galaxies) upto R25 scale length (radii at which surface brightness reaches 25 mag arcsec−2 in the B-band). The median value for the sample is shown in purple. This UV-Optical colour-colour map is used to distinguish UV emission coming from both young stellar population and horizontal branch old stellar population. Out of 18 galaxies, 1 galaxy lies in UV weak and close to UV upturn, while the other 17 galaxies lie in star-forming region. This signifies that the galaxies of our sample are indeed star-forming. |
To determine the bar length, we performed ellipse fitting on the original SDSS r-band images, (with a native resolution of 1.3″) of our sample using the Ellipse task from the photutils isophote module3. The ellipticity (ϵ) profile typically peaks at the bar’s extent and decreases as it transitions to the disc (see Fig. 4a), while the position angle (PA) of the isophotes aligns with the bar’s PA, resulting in a flat PA profile across the bar region. We first located the centre by averaging the isophote distribution with ϵ and PA taken as free parameters and then fixing the centre to extract the ϵ and PA profiles. This method, as described by Jedrzejewski (1987), is widely established and frequently used for identifying bars (Wozniak et al. 1995; Menéndez-Delmestre et al. 2007; Consolandi 2016) and determining their lengths. Also, all the bars in our sample meet the criteria mentioned in Jogee et al. (2004) with peak ellipticity at ϵ ≥ 0.3 and small PA variations (δ PAbar≲15°). According to Erwin (2004), for reliable estimation of bar properties, the semi-major axis length of the bar should be larger than ∼2× PSF FWHM. All the galaxies in our sample satisfy this criterion. We applied the above steps to study the bar regions across our sample galaxies. However, the caveats we found for galaxies at higher inclinations or relatively higher redshift, are that the ϵ profiles either smoothen out to the disc ellipticity or show multiple peaks (Galaxy No. 3, 5, and 11). In such cases, visual inspection was used to determine the bar lengths.
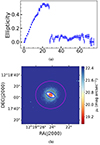 |
Fig. 4. (a) Radial profile of ellipticity. It rises as the radius increases, peaking at the bar length and then decreasing, matching the disc’s ellipticity, shown at the top. (b) SDSS r-band image in terms of surface brightness μr (mag arcsec−2) is shown at the bottom, along with the various apertures used to represent distinct regions, such as the bulge region (red), elliptical bar region (blue), circular bar region (brown), and annular disc region (magenta) of a galaxy. |
4.4. Different sub-regions of sample galaxies
To obtain the spatially resolved UV-optical colour-colour maps of our 17 sample galaxies, we defined the following regions in the PSF matched and background subtracted, NUV, FUV, and r-band images: circular bulge region (with a diameter corresponding to the PSF of the lowest resolution image, which in our case is the GALEX NUV image and it is ∼6″), elliptical bar region (defined using the measured bar length, ellipticity and position angle, as described in Sect. 4.3), circular bar region (corresponding to a radius equivalent to the semi-major axis of the bar), entire galaxy (defined using an elliptical aperture covering whole galaxy with its major axes defined in terms of R25), disc region (which is basically the entire galaxy − circular bar), elliptical bar after subtracting circular bulge region, circular bar after subtracting circular bulge region, and circular bar after subtracting elliptical bar region. In Fig. 4b, the different apertures defined for bulge (red), elliptical bar (blue), circular bar region (brown), and disc components (magenta) are shown on the original SDSS r-band image of a sample galaxy. The effective bulge radii of the bulges in our sample galaxies, as given in Table 3, is in the range of re ∼ 0.5–1.1 kpc. In our analysis, we have fixed the bulge size to a radius of 3″and it corresponds to a physical length scale of ∼1.0–2.5 kpc at the distance of our sample galaxies. We note that by fixing the bulge size to a radius of 3″, the defined bulge region might also include parts of the disc or bar regions of the galaxies.
5. Results
5.1. Spatially resolved UV-optical colour-colour maps
To further understand the nature of UV emission in the different regions of our sample galaxies, we analysed the spatially resolved UV-optical colour-colour maps. For all the sub-regions (defined in Sect. 4.4) of our sample galaxies, the FUV, NUV, and r-band magnitudes are estimated and corrected for the foreground extinction using the values taken from Schlafly & Finkbeiner (2011). From the extinction-corrected magnitudes, we derived the colours and created UV-optical colour-colour maps, which help us to understand the nature of star formation in these sub-regions. Each component (e.g. bulge, bar, and disc) of the galaxy can be identified to be star-forming or quenched depending upon its location in the two colour map. The steps involved in the analysis of a sample galaxy (galaxy no. 6) are shown in Fig. 5. The different apertures as previously described, defined for bulge, bar, and disc are over-plotted on the resolution-matched SDSS r-band, GALEX FUV, and GALEX NUV images and are shown in Figs. 5a–5c. The positions of the different sub-regions in the two colour map are shown in Fig. 5d. In this sub-fig., the bulge (red point) lies in UV weak (NUV−r > 5.4 mag and FUV−NUV > 0.9 mag) region indicating a lack of strong UV emission. The bar region, with and without subtracting bulge (represented by grey and blue points respectively) component, exhibits a NUV−r colour of more than 5 mag. Similarly, the circular bar region (brown point) after subtracting both bulge and elliptical bar components display colour greater than 4.5 mag which translates to stellar population older than 1 Gyr (as explained in Sect. 5.2). This implies no star formation inside the bar region, in the last 1 Gyr. This is in contrast to the disc region (magenta point) which displays a much bluer NUV−r colour (∼3.3 mag) suggesting the presence of ongoing star formation in the last 1 Gyr. The redder values of NUV−r colour up to circular bar region, indicate that the inner regions, up to the bar length, are quenched. The colours of the disc suggest that the disc is actively star-forming.
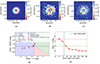 |
Fig. 5. Steps involved in the analysis (Galaxy no. 6 in Table 2). (a) Four apertures are over plotted on the SDSS r-band degraded image same as in Fig. 4b, for distinct regions i.e. bulge region (red), elliptical bar region (blue), circular bar region (brown), and disc (magenta). Outer aperture is defined by R25 scale length. The innermost aperture is defined for bulge with a fixed diameter of 6 arcsec considering GALEX PSF resolution. The middle circular aperture covers region up to bar length; (b) and (c) Same apertures are over-plotted on GALEX FUV (degraded to NUV resolution) and GALEX NUV image where flux scale is in units of surface brightness. (d) UV-optical spatially resolved colour-colour map for all structural components. The Bulge is lying in UV upturn while the disc is in star-forming region. (e) The NUV−r colour radial profile. The red and yellow horizontal dotted lines represent NUV−r = 5.4 and 4 mag, respectively. The green vertical dashed line denotes bar half-length. The colours within the bar region are redder than the outer disc, with the transition occurring near the end of the bar. |
In Fig. 6, we present spatially resolved UV-optical colour-colour map for the entire sample of 17 galaxies. The median value for each sub-region across the 17 galaxies is also shown in sub-plots. The disc regions of these galaxies are consistently bluer than their inner structural counterparts while the circular bar regions with or without subtracting bulge and bar component, exhibit redder NUV−r colours than the disc regions, typically greater than 4 mag. The elliptical bar regions with or without subtracting the bulge component are even more redder. The bulges mostly fall in UV weak or UV upturn, or closer, indicating that the detected UV emission is predominantly coming from older stars, not from young stars. This is more in line with inside-out quenching scenario happening in galaxies. In the next Sect., we attempt to quantify the age of the stellar populations in these different regions using the NUV−r colour as a proxy for age.
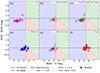 |
Fig. 6. UV-optical spatially resolved colour-colour maps for (a) the disc component, (b) the bar circular aperture region without subtracting the bulge component, (c) the bar circular aperture after subtracting the bulge and bar components, (e) the bar elliptical aperture region without subtracting the bulge, (f) the bar elliptical aperture region after subtracting the bulge, and (g) the bulge region within 6 arcsecond diameter. The diamond symbol denotes the median values in each map. The spatial resolved two colour maps reveal that the disc regions of all galaxies are bluer (< 4 mag) indicating ongoing star formation phase, while the inner region, bar and bulge regions of these galaxies within bar circular radius, are redder (> 4 mag) reminiscent of the older stellar population with ages > 1 Gyr. |
5.2. NUV−r profile
Massive O and B type stars in recent star-forming regions (up to 300 Myr), emit in UV and hence the UV emission arising from the galaxies can be used as a direct tracer of recent star formation (Kennicutt & Evans 2012). However, the FUV flux might be contaminated by the flux from the old hot stellar population. NUV is less contaminated by the emission from old population. Based on the analysis of single stellar population models with different metallicities, Kaviraj et al. (2007) showed the evolution of NUV−r as a function of age. They showed that the NUV−r colour evolves slowly after 1–2 Gyrs (Fig. 7 in Kaviraj et al. 2007) for all models and an intrinsic NUV−r colour of 4 mag corresponds to ∼1 Gyr or higher. This is because the young stars contributing to the NUV flux evolve off the MS in this timescale. They suggested that NUV−r colour is an effective age indicator for the population formed in the last ∼1 Gyr. Therefore, the NUV−r colour can be used to determine whether a star formation event has occurred within the past 1 Gyr. Pan et al. (2016) found that for less dust-attenuated galaxies, NUV−r is found to be linearly correlated with Dn4000. Dn4000 index is an excellent age indicator and it represents spectral discontinuity around 4000 Å wavelengths. This happens due to either the absence of young UV-dominated stars or increased metal absorption in the stellar atmosphere of older metal-rich stars. Pan et al. (2016) found that NUV−r colour of ∼ 4.0 mag corresponds to a Dn4000 value of 1.5. A value of < 1.5 indicates the presence of stellar population younger than 1 Gyr and a value > 1.5 indicates a population older than 1 Gyr (Kauffmann et al. 2003). Thus, NUV−r is a good photometric indicator of stellar age. This is similar to the correlation found by Salim (2014) between the NUV−r and the specific SFR.
As shown in Fig. 6, the median NUV−r colour of all the regions within a circular aperture equivalent to the bar length is > 4 mag. This indicates that the stellar populations inside the bar region are older than 1 Gyr or there was no star formation in the inner regions (covering the bar) of these galaxies in the last 1 Gyr. However, the median NUV−r colour of the disc regions of our sample is < 4 mag (magenta diamond symbol in the upper-left panel of Fig. 6) and it indicates star formation, in the last 1 Gyr, in the outer disc of most of our sample galaxies. In order to better understand this inner to outer transition, we plotted the NUV−r colour radial profiles of all the 17 galaxies. To create NUV−r colour radial profile, we plotted concentric elliptical annuli with a width of 3 arcseconds each, extending out to the R25 radius on both SDSS r-band (degraded to the GALEX NUV spatial resolution) and GALEX NUV images, and then estimated the NUV−r colour in each annulus and plotted it as a function of the semi-major axis (in kpc). As can be seen from Fig. 5e, which is the profile for the Galaxy no. 6, the NUV−r colour changes from red to blue as a function of radius and it happens near the bar radius (green vertical line in Fig. 5e). Similarly, in most of the galaxies (Fig. A.1), the transition to a colour ≤4–4.5 mag happens at distances of ∼5–9 kpc from the centre of the galaxies, which is similar to the length of the semi-major axis of the bars in these galaxies (shown as green vertical lines in Fig. A.1). This shows that inside the bar region, there is no star formation over a period > 1 Gyr and outside the bar there is significant star formation. This timescale of ∼1 Gyr matches with the results by James & Percival (2016), who found that the star formation between the central sub-kpc region and the ends of the bar in four nearby galaxies to be truncated at least 1 or more Gyrs ago. Our results suggest that these galaxies are centrally quenched and no recent star formation in the last 1 Gyr or more, and the size of this centrally quenched region correlates with the size of the bar. This indirectly indicates the role of the bar in central quenching. We note that for certain galaxies in our sample, specifically galaxy nos. 3, 4, 16, 17, and 18, the NUV−r colour profiles do not exhibit the transitions to bluer colours and remain > 4 mag throughout their extent, up to the R25. For galaxies 16 and 17, this is primarily attributed to contamination from foreground or background objects within their fields. Though we have masked these objects, the contamination still contributes to their profiles. The galaxy 3 has a higher inclination and a higher redshift, resulting in fewer data points in its colour profile, limiting the analysis. However, galaxies 4 and 18, despite sharing similar parameters with the rest of the sample, do not exhibit the typical transition from redder to bluer colours, unlike most galaxies. These galaxies require further investigation. In Fig. 7, we have shown the median NUV−r colour for a full sample of 17 barred galaxies as a function of radius normalised with R25. Each point represents the median NUV−r colour within a bin size of 0.2 and the shadow region represents the inter-quartile range for y-values within each bin, bounded by the 25th and 75th percentiles. The dashed blue vertical line indicates the median bar radius or bar half-length. The average colour transition is happening around 4.5 mag indicating the bar region of most of the barred galaxies is quenched.
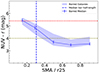 |
Fig. 7. Median NUV-r colour radial profile for the complete sample of barred galaxies. The median NUV-r values (with error bars) are plotted against normalised SMA/R25, with the shadow region representing the inter-quartile range (IQR) of the y-values within each bin, bounded by the 25th and 75th percentiles. The dashed blue line indicates the median normalised bar half-length. The red and yellow dashed horizontal lines reference NUV-r = 5.4 and NUV-r = 4 mag. |
To understand the NUV−r colour profiles of barred galaxies in different stages of star formation, with respect to their positions on the SFR-M⋆ plane, and to compare with our sample of centrally quenched galaxies, we selected two representative galaxies: a star-forming barred galaxy located in the star-forming region and a fully quenched barred galaxy located in the quenched region in the SFR-M⋆ plane, based on the parameters from both the MPA-JHU (Brinchmann et al. 2004) and GSWLC (Salim et al. 2018) catalogues. Both these galaxies have stellar masses around the median stellar mass value of our sample, log(M⋆)∼10.9 M⊙, comparable redshifts and axial ratios (b/a) as those of our sample galaxies and do not host AGN. Their normalised bar lengths are similar to that of the median bar length of our sample galaxies. The two galaxies also share similar bulge properties to that of our sample galaxies (sérsic indices, n< 2). We compared the NUV−r normalised colour profiles of these two galaxies with those of our sample of centrally quenched galaxies. Fig. 8 shows the typical NUV−r profiles of these star-forming barred galaxy and fully quenched barred galaxy, along with the profile of one of our sample galaxies with similar stellar mass.
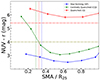 |
Fig. 8. NUV-r normalised radial profile for three barred galaxies positioned differently on the SFR-M⋆ plane is shown with corresponding colour-coded bar half-lengths. The star-forming barred galaxy (blue) lies in the star-forming region, as determined by both the MPA-JHU (Brinchmann et al. 2004) and GSWLC (Salim et al. 2018) catalogues. The quenched barred galaxy (red) is positioned in the quenched region in both catalogues, while the centrally quenched galaxy (Galaxy 9) is selected from our sample. All three galaxies share similar stellar masses around the median value (logM⋆ ∼ 10.9 M⊙), within comparable redshifts and axial ratios (b/a). The figure clearly pictures the role of bars in driving barred galaxies from the MS to the quenched region by inducing a cessation of star formation. |
The inner region of the star-forming galaxy exhibits colours well below 4 mag, with a nearly flat NUV−r profile, and with its disc slightly bluer than the inner region. This suggests that the bar is still actively funnelling gas and driving star formation in both the central regions and across the bar. In contrast, the (NUV−r) profile of the quenched galaxy shows colours exceeding 5.4 mag throughout its disc, indicating it is fully quenched, with the disc lacking the fuel needed for star formation. Fig 8. illustrates this progression, with the MS galaxy exhibiting ongoing star formation throughout the galaxy while the quenched galaxy is fully quenched at all radii. Our sample of barred galaxies lies in between, showing central quenching up to the extent of the bar but retaining star-forming discs. This might indicate an evolutionary sequence of a barred galaxy moving from a star-forming stage to a quenched state, mainly by the action of bar. Although the potential impact of strong bars on disc properties requires further exploration, comparing our results with galaxies at different stages of star formation suggests that bars play a significant role in suppressing star formation in the central regions of internally quenched galaxies. A more detailed analysis of a larger sample of galaxies in different evolutionary stages, based on their location in the SFR-M⋆ plane, will be presented in a future work.
6. Discussion
In this study, we used the spatially resolved UV-optical colour-colour maps and NUV−r radial profiles of 17 centrally quenched barred galaxies, in the redshift range of 0.02–0.06, to understand the role of bars in quenching star formation. We utilised spatially resolved (FUV−NUV versus NUV−r) colour-colour maps to understand the nature of UV emission in different sub-regions of these galaxies. We found that our sample galaxies exhibit notably redder colours, within their bulge, bar, and the region within the co-rotation radius of the bar, suggesting UV emission from old and hot stellar populations in the bulge region and lack of recent star formation in the bar region, while their discs remain bluer, reflecting ongoing star formation. Then to better quantify the age of the stellar populations, we used NUV−r colour as a proxy of age and created the NUV−r radial profiles of these systems. These profiles suggest that the NUV−r colour changes from red to blue as a function of radius and the stellar population inside the bar co-rotation radius has ages > 1 Gyr. The disc region of the majority of our sample galaxies (12 out of 17) have NUV−r < 4 mag, indicating recent star formation (in < 1 Gyr) in the discs. The colour transition from red to blue (at NUV−r ∼ 4 mag) is particularly evident at the bar radius, emphasising the bar’s role in suppressing star formation. Strong and extended bars are known to inhibit star formation by either funnelling gas to the centre or producing shear in the gas that prevents its collapse. The HI gas holes have been observed in case of removal of gas when the period of intense star formation is over after the bar has completely funnelled the gas all the way to the centre (George et al. 2020; Gavazzi et al. 2015; Newnham et al. 2020). Such HI cavities have been observed in very nearby galaxies, suggesting that the redistribution of gas by bar is the mechanism of bar-quenching in these galaxies (George et al. 2019, 2020). The HI interferometric observations of these barred spiral galaxies, aimed at identifying the presence or absence of HI gas in the bar region, will be of interest with respect to improving our understanding of the physical mechanisms of bar quenching in these redshifts.
We note that in our analysis, we only considered galactic foreground extinction correction and we did not apply any internal extinction correction to the NUV, FUV, and r-band magnitudes. This suggests that the estimated colours of different regions of the galaxies are an upper limit and, hence, on the related ages of these regions. To check the effect of internal extinction in the estimated colours, we used the dust attenuation value for each of our sample galaxies, provided in the GSWLC M2 catalogue, and re-estimated the colours of different regions of our sample galaxies. The dust attenuation in the GSWLC catalogue is determined by constraining SED fits with infrared luminosity (SED+LIR) and represents the internal extinction. We used a constant attenuation value across the galaxy. As expected, the re-estimated colours are bluer. However, the change in the colours of different regions, with and without internal dust attenuation, is of the order of ∼0.25 mag. Even with this shift in colour to a bluer value, the (NUV−r) colour of our sample galaxies, inside the bar co-rotation radius is still > 4 mag; hence, the age of the stellar population can be assumed to be older than 1 Gyr. As we are using a constant value of dust attenuation, the shape of the NUV−r profiles are not affected. However, the dust attenuation can be a function of galactocentric radius and such variation can affect the NUV−r profile of our galaxies. The studies of 2D dust maps of nearby galaxies and those at z ∼ 1.4 by González Delgado et al. (2015) and Nelson et al. (2016), respectively, indicate that in the galaxy scale, the dust attenuation is not a strong function of radius. These studies suggest that for galaxies massive than 1010 M⊙, the dust attenuation could have a strong negative gradient in the inner 1 kpc region – however, beyond that, the dust attenuation has no variation. As the spatial resolution of the NUV−r profile of all our sample galaxies is coarser than 1 kpc, we would not expect to see a change in their profile due to the variation in the dust attenuation across the galaxy. Thus, the effect of internal extinction in the estimated colours and the order of magnitude estimation of the ages of the stellar populations in the different regions of our sample galaxies is likely to be negligible. Thus, our results regarding the role of bars in quenching star formation in the central regions are not expected to be affected.
The spatially resolved UV-optical colour-colour maps and the NUV−r colour profiles of our sample galaxies (with most of them having stellar mass greater than 1010.5 M⊙) suggest an inside-out quenching scenario for these galaxies. Such an inside-out quenching scenario is expected for high mass (≥1010.5 M⊙) galaxies (Pan et al. 2015; Lin et al. 2019; Zhang et al. 2019, 2021). However, these previous studies suggest different physical mechanisms, such as morphological quenching, bar-quenching, and AGN feedback, for the inside-out quenching in secularly evolving high mass galaxies. Lin et al. (2019) favoured morphological quenching over AGN feedback as the primary mechanism. Morphological quenching (Martig et al. 2009) is mainly driven by classical bulges. The Sérsic indices of the bulges, given in Table 3, of our sample galaxies are < 2 (Fisher & Drory 2008, 2010), indicating the pseudo nature of these bulges. Hence, the quenching of central regions of our sample galaxies due to the action of bulges is highly unlikely. As described earlier, none of our sample galaxies host AGN. However, a past AGN activity causing central quenching of these systems cannot be ruled out; again, it is highly unlikely that all our sample galaxies have a history of past AGN activity that created a centrally quenched region exactly similar to the region covering the co-rotation radius of the bar. Fraser-McKelvie et al. (2020a) suggested that the physical properties of a bar are mostly governed by the stellar mass of the host galaxy and found that massive galaxies host longer bars. George & Subramanian (2021) observed a mild correlation between the offset of fully quenched barred galaxies from the SFMS and the scaled bar length for isolated massive galaxies. These results indicate the role of bar in the inside-out quenching of high mass galaxies. Hence, the most likely mechanism for the observed inside-out quenching in our sample galaxies is the action of bar.
To further validate our findings and determine if the central quenching is only associated with the bars, we conducted a comparative analysis with a control sample of eight unbarred galaxies, as shown in Fig. 9. These unbarred galaxies are also centrally quenched and are selected using the same criteria outlined in Sect. 2. We also note that these unbarred galaxies dust attenuation levels are similar with our main sample of barred galaxies. The properties of this control sample of unbarred galaxies are mentioned in Table B.1. We obtained the individual NUV−r profiles of all these eight unbarred galaxies and then obtained a median profile for our sample. We plotted the NUV−r colour against the normalised disc radius, with each data point representing the median NUV−r values within a bin size of 0.2 for both barred and unbarred sample galaxies. The median bar radius of our barred sample galaxies is also indicated as a blue vertical line in Figs. 9b and 9d. Although the NUV−r profiles appear similar for both barred and unbarred samples in Fig. 9b, the unbarred galaxies exhibit a larger variance in their colour distribution (Fig. 9a). When the individual profiles of the unbarred galaxies are checked, we found that this increased variance is primarily due to the presence of four unbarred galaxies with quenched central regions. To understand the cause of this central quenching in these unbarred galaxies, we performed a 2D structural analysis using GALFIT (Peng et al. 2010) to infer the properties of bulges in our sample of unbarred galaxies sample. The estimated parameters are given in Table B.1. Our analysis reveals a dual nature for these bulges in the unbarred galaxies. Five of the unbarred galaxies display bulge Sérsic indices of > 2, indicating that they are classical in nature (Fisher & Drory 2008, 2010). Four of these five galaxies (galaxy no. 2, 4, 5, and 8) are ones that have had their central regions quenched to a larger extent, with their NUV−r radial profiles similar to the profiles of barred galaxies. This suggests that the central quenching in these four unbarred galaxies (to a larger radial extent, similar to the extent that is observed in the barred galaxies) could be due to the action of classical bulges. Interestingly, we found that galaxy no. 4 in Table B.1 showed some indications of the presence of a bar like feature in the residue of our GALFIT analysis. However, the addition of a bar component did not provide a satisfactory fit, probably due the higher redshift of this sample galaxy and/or lower b/a value. Thus, for this galaxy, central quenching due to the action of bar cannot be ruled out. For a viable comparison with the barred galaxies, we removed the four centrally quenched unbarred (galaxy no. 2, 4, 5, and 8) galaxies, which show different bulge properties than those of our barred galaxies sample. The remaining four systems show redder colour values NUV−r > 4 only to a smaller extent from the centre, while bluer profiles with NUV−r < 4 mag (Fig. 9c) are observed for the rest of the region. While comparing our barred sample with these four systems (Fig. 9d), it becomes evident that barred galaxies display redder internal colours than unbarred galaxies, a trend that persists up to the extent of the bar. Here, we note that the limited size of our barred galaxy sample and the control sample of unbarred galaxies may have implications when generalising the observed results over a larger sample. Since this is a pilot study aimed at validating the methodology, we plan to confirm our findings based on a larger sample in future work.
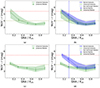 |
Fig. 9. (a) Median NUV−r values are plotted against the normalised SMA/R25 for the control sample of 8 unbarred galaxies. (b) Median NUV−r profiles for the complete sample of barred and unbarred galaxies. (c) Median profile for unbarred galaxies after excluding four internally quenched unbarred galaxies. (d) Profiles of both barred and unbarred samples, after removing the four internally quenched unbarred galaxies. The results show that the inner regions of barred galaxies are quenched within their bar length, whereas unbarred galaxies exhibit comparatively bluer profiles. |
As detailed in Sect. 2, we selected our sample by leveraging the discrepancies between two catalogues, which allowed us to identify centrally quenched galaxies. In the final selection step, we excluded emission-type galaxies, specifically, those exhibiting Hα emission in their SDSS optical spectra within the 3-arcsecond fibre aperture. The presence of Hα emission might indicate ongoing star formation in the sub-kpc nuclear regions, which we avoided in our analysis. This was mainly meant to focus on those galaxies where star formation in the central regions has completely ceased. However, it would be interesting to study these emission-type galaxies, as they can trace the final episodes of star formation. By probing the inner regions with deeper and higher resolution data, we could gain valuable insights into the processes driving star formation in these nuclear regions just before quenching occurs. Such a study will be of interest to understand different stages of bar-quenching, as observed for a small number of nearby galaxies in George et al. (2020). Moreover, to further facilitate our findings, we plan to employ an SED fitting to map the star formation history and the ages of stellar populations in centrally quenched galaxies, where bars play a crucial role in regulating star formation. Spatially resolved stellar population age maps and star formation history maps of these centrally quenched barred galaxies will also provide insights to improving our understanding of the role of bars in the radial migration of stars (Donohoe-Keyes et al. 2019; Neumann et al. 2024).
In this study, we used the spatially resolved colour-colour maps to analyse a small sample of barred galaxies in the redshift range of 0.02 – 0.06. As stated earlier, we plan to apply this method to a larger sample of SDSS galaxies classified using Galaxy Zoo. The sample will be further refined to include barred galaxies at different stages of evolution, based on their position in the SFR-M⋆ plane.
7. Summary
In this pilot study designed to investigate the role of bar in quenching star formation in barred galaxies, we selected a sample of nearly face-on centrally quenched barred galaxies, within a redshift of 0.02–0.06. We studied them using spatially resolved UV-optical colour-colour maps and analysed their NUV−r colour radial profiles to understand the age of stellar populations in these regions.
-
The sample is made up of 17 barred galaxies identified as centrally quenched galaxies, based on their location in the SFR versus stellar mass (SFR – M⋆) plot, created with parameters from the MPA-JHU and GSWLC catalogues.
-
Spatially resolved UV-optical colour-colour maps of these galaxies were used to understand the nature of UV emission in different regions of galaxies. The location of different sub-regions in the colour-colour maps and their median colours indicate UV emission from old and hot stellar populations in the bulge region and a lack of recent star formation in the bar region, along with evidence of recent star formation in the disc region.
-
All the centrally quenched barred galaxies display redder colours (NUV−r > 4 mag) in the inner regions, up to the length of the bar, indicating the age of stellar population in these regions to be older than > 1 Gyr. This suggests the role of the bar in suppressing star formation in these galaxies.
-
Most of our sample galaxies (12 out of 17 galaxies) also exhibit a transition from red to blue in the NUV−r colour profile (NUV−r < 4 mag) when moving from the inner region to the disc region, indicating star formation activity in the disc region in the last 1 Gyr.
-
Most barred galaxies in our sample host pseudo bulges and do not host AGN, indicating that the most probable reason for the internal quenching of these galaxies is the action of stellar bar.
-
The barred galaxies show redder colours (NUV−r > 4 mag) or host older population (> 1 Gyr) to a larger spatial extent compared to their unbarred counterparts, residing in a similar regime of stellar mass and redshifts.
In this paper, we highlighted the importance of spatially resolved studies of stellar populations in understanding the role of bars in internal quenching. A larger sample of barred galaxies across different redshifts can provide more insights into how bar contribute to quenching star formation.
Acknowledgments
The authors thank the anonymous referee for the constructive comments which have helped to improve the manuscript. DR also thank Sioree Ansar, Himanshu and Gaurishankar for their suggestions on improving the quality of plots. This study made use of archival Sloan Digital Sky Survey (SDSS) Data Release 7 (DR7) and Galaxy Evolution Explorer (GALEX) Medium Deep Catalogues data. Funding for the SDSS and SDSS-II was provided by the Alfred P. Sloan Foundation, the Participating Institutions, the National Science Foundation, the U.S. Department of Energy, the National Aeronautics and Space Administration, the Japanese Monbukagakusho, the Max Planck Society, and the Higher Education Funding Council for England. The SDSS was managed by the Astrophysical Research Consortium for the Participating Institutions. GALEX (Galaxy Evolution Explorer) is a NASA Small Explorer, launched in 2003 April. We gratefully acknowledge NASA’s support for construction, operation, and science analysis for the GALEX mission, developed in cooperation with the Centre National d’Etudes Spatiales of France and the Korean Ministry of Science and Technology. This study also made use of Astropy, a community-developed core Python package for Astronomy (Astropy Collaboration 2013, 2018).
References
- Abazajian, K. N., Adelman-McCarthy, J. K., Agüeros, M. A., et al. 2009, ApJS, 182, 543 [Google Scholar]
- Aguerri, J. A. L., Méndez-Abreu, J., & Corsini, E. M. 2009, A&A, 495, 491 [NASA ADS] [CrossRef] [EDP Sciences] [Google Scholar]
- Algorry, D. G., Navarro, J. F., Abadi, M. G., et al. 2017, MNRAS, 469, 1054 [Google Scholar]
- Amvrosiadis, A., Lange, S., Nightingale, J., et al. 2024, ArXiv e-prints [arXiv:2404.01918] [Google Scholar]
- Astropy Collaboration (Robitaille, T. P., et al.) 2013, A&A, 558, A33 [NASA ADS] [CrossRef] [EDP Sciences] [Google Scholar]
- Astropy Collaboration (Price-Whelan, A. M., et al.) 2018, AJ, 156, 123 [Google Scholar]
- Athanassoula, E., & Misiriotis, A. 2002, MNRAS, 330, 35 [Google Scholar]
- Athanassoula, E., Morin, S., Wozniak, H., et al. 1990, MNRAS, 245, 130 [NASA ADS] [Google Scholar]
- Athanassoula, E., Machado, R. E., & Rodionov, S. 2013, MNRAS, 429, 1949 [NASA ADS] [CrossRef] [Google Scholar]
- Baldry, I. K., Glazebrook, K., Brinkmann, J., et al. 2004, ApJ, 600, 681 [Google Scholar]
- Bell, E. F., Wolf, C., Meisenheimer, K., et al. 2004, ApJ, 608, 752 [NASA ADS] [CrossRef] [Google Scholar]
- Bluck, A. F. L., Maiolino, R., Piotrowska, J. M., et al. 2020, MNRAS, 499, 230 [NASA ADS] [CrossRef] [Google Scholar]
- Brinchmann, J., Charlot, S., White, S. D., et al. 2004, MNRAS, 351, 1151 [NASA ADS] [CrossRef] [Google Scholar]
- Cardelli, J. A., Clayton, G. C., & Mathis, J. S. 1989, ApJ, 345, 245 [Google Scholar]
- Cheung, E., Athanassoula, E., Masters, K. L., et al. 2013, ApJ, 779, 162 [NASA ADS] [CrossRef] [Google Scholar]
- Combes, F., & Gerin, M. 1985, A&A, 150, 327 [NASA ADS] [Google Scholar]
- Consolandi, G. 2016, A&A, 595, A67 [NASA ADS] [CrossRef] [EDP Sciences] [Google Scholar]
- Consolandi, G., Dotti, M., Boselli, A., Gavazzi, G., & Gargiulo, F. 2017, A&A, 598, A114 [NASA ADS] [CrossRef] [EDP Sciences] [Google Scholar]
- Cortese, L., Catinella, B., Cook, R., & Janowiecki, S. 2020, MNRAS: Letters, 494, L42 [NASA ADS] [CrossRef] [Google Scholar]
- de Vaucouleurs, G., de Vaucouleurs, A., Corwin, Jr., H. G., et al. 1991, Third Reference Catalogue of Bright Galaxies [Google Scholar]
- Dey, A., Schlegel, D. J., Lang, D., et al. 2019, AJ, 157, 168 [Google Scholar]
- Donohoe-Keyes, C. E., Martig, M., James, P. A., & Kraljic, K. 2019, MNRAS, 489, 4992 [Google Scholar]
- Durbala, A., Finn, R. A., Crone Odekon, M., et al. 2020, AJ, 160, 271 [NASA ADS] [CrossRef] [Google Scholar]
- Erwin, P. 2004, A&A, 415, 941 [NASA ADS] [CrossRef] [EDP Sciences] [Google Scholar]
- Erwin, P. 2005, MNRAS, 364, 283 [Google Scholar]
- Faber, S., Willmer, C., Wolf, C., et al. 2007, ApJ, 665, 265 [NASA ADS] [CrossRef] [Google Scholar]
- Fisher, D. B., & Drory, N. 2008, AJ, 136, 773 [NASA ADS] [CrossRef] [Google Scholar]
- Fisher, D. B., & Drory, N. 2010, ApJ, 716, 942 [NASA ADS] [CrossRef] [Google Scholar]
- Fragkoudi, F., Grand, R. J. J., Pakmor, R., et al. 2020, MNRAS, 494, 5936 [Google Scholar]
- Fraser-McKelvie, A., Aragón-Salamanca, A., Merrifield, M., et al. 2020a, MNRAS, 495, 4158 [Google Scholar]
- Fraser-McKelvie, A., Merrifield, M., Aragón-Salamanca, A., et al. 2020b, MNRAS, 499, 1116 [CrossRef] [Google Scholar]
- Gavazzi, G., Consolandi, G., Dotti, M., et al. 2015, A&A, 580, A116 [NASA ADS] [CrossRef] [EDP Sciences] [Google Scholar]
- George, K., & Subramanian, S. 2021, A&A, 651, A107 [NASA ADS] [CrossRef] [EDP Sciences] [Google Scholar]
- George, K., Joseph, P., Mondal, C., et al. 2019, A&A, 621, L4 [NASA ADS] [CrossRef] [EDP Sciences] [Google Scholar]
- George, K., Subramanian, S., & Paul, K. T. 2019, A&A, 628, A24 [NASA ADS] [CrossRef] [EDP Sciences] [Google Scholar]
- George, K., Joseph, P., Mondal, C., et al. 2020, A&A, 644, A79 [NASA ADS] [CrossRef] [EDP Sciences] [Google Scholar]
- Géron, T., Smethurst, R. J., Lintott, C., et al. 2021, MNRAS, 507, 4389 [CrossRef] [Google Scholar]
- González Delgado, R. M., García-Benito, R., Pérez, E., et al. 2015, A&A, 581, A103 [Google Scholar]
- Guo, K., Peng, Y., Shao, L., et al. 2018, ApJ, 870, 19 [CrossRef] [Google Scholar]
- Guo, Y., Jogee, S., Finkelstein, S. L., et al. 2023, ApJ, 945, L10 [NASA ADS] [CrossRef] [Google Scholar]
- Haywood, M., Lehnert, M., Di Matteo, P., et al. 2016, A&A, 589, A66 [NASA ADS] [CrossRef] [EDP Sciences] [Google Scholar]
- Hogarth, L. M., Saintonge, A., & Davis, T. A. 2022, MNRAS, 518, 13 [NASA ADS] [CrossRef] [Google Scholar]
- James, P. A., & Percival, S. M. 2015, MNRAS, 450, 3503 [NASA ADS] [CrossRef] [Google Scholar]
- James, P. A., & Percival, S. M. 2016, MNRAS, 457, 917 [Google Scholar]
- James, P., & Percival, S. 2018, MNRAS, 474, 3101 [NASA ADS] [CrossRef] [Google Scholar]
- James, P. A., Bretherton, C. F., & Knapen, J. H. 2009, A&A, 501, 207 [NASA ADS] [CrossRef] [EDP Sciences] [Google Scholar]
- Jedrzejewski, R. I. 1987, MNRAS, 226, 747 [Google Scholar]
- Jogee, S., Barazza, F. D., Rix, H.-W., et al. 2004, ApJ, 615, L105 [NASA ADS] [CrossRef] [Google Scholar]
- Kauffmann, G., Heckman, T. M., White, S. D., et al. 2003, MNRAS, 341, 33 [CrossRef] [Google Scholar]
- Kaviraj, S., Schawinski, K., Devriendt, J. E. G., et al. 2007, ApJS, 173, 619 [NASA ADS] [CrossRef] [Google Scholar]
- Kazantzidis, S., Bullock, J. S., Zentner, A. R., Kravtsov, A. V., & Moustakas, L. A. 2008, ApJ, 688, 254 [Google Scholar]
- Kennicutt, R. C., & Evans, N. J. 2012, ARA&A, 50, 531 [NASA ADS] [CrossRef] [Google Scholar]
- Kewley, L. J., Dopita, M. A., Sutherland, R. S., Heisler, C. A., & Trevena, J. 2001, ApJ, 556, 121 [Google Scholar]
- Khoperskov, S., Haywood, M., Di Matteo, P., Lehnert, M., & Combes, F. 2018, A&A, 609, A60 [NASA ADS] [CrossRef] [EDP Sciences] [Google Scholar]
- Kim, E., Hwang, H. S., Chung, H., et al. 2017, ApJ, 845, 93 [CrossRef] [Google Scholar]
- Kim, T., Gadotti, D. A., Querejeta, M., et al. 2024, ApJ, 968, 87 [NASA ADS] [CrossRef] [Google Scholar]
- Kraljic, K., Bournaud, F., & Martig, M. 2012, ApJ, 757, 60 [Google Scholar]
- Kruk, S. J., Lintott, C. J., Bamford, S. P., et al. 2018, MNRAS, 473, 4731 [Google Scholar]
- Le Conte, Z. A., Gadotti, D. A., Ferreira, L., et al. 2024, MNRAS, 530, 1984 [NASA ADS] [CrossRef] [Google Scholar]
- Lee, Y. H., Ann, H. B., & Park, M.-G. 2019, ApJ, 872, 97 [Google Scholar]
- Lin, L., Hsieh, B.-C., Pan, H.-A., et al. 2019, ApJ, 872, 50 [Google Scholar]
- Lintott, C. J., Schawinski, K., Slosar, A., et al. 2008, MNRAS, 389, 1179 [NASA ADS] [CrossRef] [Google Scholar]
- Maeda, F., Egusa, F., Ohta, K., Fujimoto, Y., & Habe, A. 2023, ApJ, 943, 7 [NASA ADS] [CrossRef] [Google Scholar]
- Man, A., & Belli, S. 2018, Nat. Astron., 2, 695 [NASA ADS] [CrossRef] [Google Scholar]
- Martig, M., Bournaud, F., Teyssier, R., & Dekel, A. 2009, ApJ, 707, 250 [Google Scholar]
- Martin, D. C., Fanson, J., Schiminovich, D., et al. 2005, ApJ, 619, L1 [Google Scholar]
- Masters, K. L., Nichol, R. C., Haynes, M. P., et al. 2012, MNRAS, 424, 2180 [Google Scholar]
- Menéndez-Delmestre, K., Sheth, K., Schinnerer, E., Jarrett, T. H., & Scoville, N. Z. 2007, ApJ, 657, 790 [Google Scholar]
- Morrissey, P., Conrow, T., Barlow, T. A., et al. 2007, ApJS, 173, 682 [Google Scholar]
- Morselli, L., Popesso, P., Erfanianfar, G., & Concas, A. 2017, A&A, 597, A97 [NASA ADS] [CrossRef] [EDP Sciences] [Google Scholar]
- Nair, P. B., & Abraham, R. G. 2010, ApJ, 714, L260 [Google Scholar]
- Nelson, E. J., van Dokkum, P. G., Momcheva, I. G., et al. 2016, ApJ, 817, L9 [CrossRef] [Google Scholar]
- Neumann, J., Thomas, D., Maraston, C., et al. 2024, MNRAS, 534, 2438 [NASA ADS] [Google Scholar]
- Newnham, L., Hess, K. M., Masters, K. L., et al. 2020, MNRAS, 492, 4697 [NASA ADS] [CrossRef] [Google Scholar]
- Pan, Z., Li, J., Lin, W., et al. 2015, ApJ, 804, L42 [NASA ADS] [CrossRef] [Google Scholar]
- Pan, Z., Zheng, X., Lin, W., et al. 2016, ApJ, 819, 91 [NASA ADS] [CrossRef] [Google Scholar]
- Peng, C. Y., Ho, L. C., Impey, C. D., & Rix, H.-W. 2010, AJ, 139, 2097 [Google Scholar]
- Peng, Y., Maiolino, R., & Cochrane, R. 2015, Nature, 521, 192 [Google Scholar]
- Pessa, I., Schinnerer, E., Leroy, A. K., et al. 2022, A&A, 663, A61 [NASA ADS] [CrossRef] [EDP Sciences] [Google Scholar]
- Renzini, A., & Peng, Y.-J. 2015, ApJ, 801, L29 [Google Scholar]
- Reynaud, D., & Downes, D. 1998, A&A, 337, 671 [NASA ADS] [Google Scholar]
- Romano-Díaz, E., Shlosman, I., Heller, C., & Hoffman, Y. 2009, ApJ, 702, 1250 [CrossRef] [Google Scholar]
- Romeo, A. B., Agertz, O., & Renaud, F. 2023, MNRAS, 518, 1002 [Google Scholar]
- Rosas-Guevara, Y., Bonoli, S., Dotti, M., et al. 2020, MNRAS, 491, 2547 [NASA ADS] [Google Scholar]
- Rosas-Guevara, Y., Bonoli, S., Dotti, M., et al. 2022, MNRAS, 512, 5339 [NASA ADS] [CrossRef] [Google Scholar]
- Salim, S. 2014, Serb. Astron. J., 189, 1 [NASA ADS] [CrossRef] [Google Scholar]
- Salim, S., Charlot, S., Rich, R. M., et al. 2005, ApJ, 619, L39 [Google Scholar]
- Salim, S., Rich, R. M., Charlot, S., et al. 2007, ApJS, 173, 267 [NASA ADS] [CrossRef] [Google Scholar]
- Salim, S., Lee, J. C., Janowiecki, S., et al. 2016, ApJS, 227, 2 [NASA ADS] [CrossRef] [Google Scholar]
- Salim, S., Boquien, M., & Lee, J. C. 2018, ApJ, 859, 11 [Google Scholar]
- Scaloni, L., Rodighiero, G., Enia, A., et al. 2024, A&A, 687, A255 [NASA ADS] [CrossRef] [EDP Sciences] [Google Scholar]
- Schlafly, E. F., & Finkbeiner, D. P. 2011, ApJ, 737, 103 [Google Scholar]
- Sellwood, J. A., & Wilkinson, A. 1993, Rep. Prog. Phys., 56, 173 [NASA ADS] [CrossRef] [Google Scholar]
- Skibba, R. A., Masters, K. L., Nichol, R. C., et al. 2012, MNRAS, 423, 1485 [Google Scholar]
- Spinoso, D., Bonoli, S., Dotti, M., et al. 2016, MNRAS, 465, 3729 [Google Scholar]
- Strateva, I., Ivezić, Ž., Knapp, G. R., et al. 2001, ApJ, 122, 1861 [CrossRef] [Google Scholar]
- Villa-Vargas, J., Shlosman, I., & Heller, C. 2010, ApJ, 719, 1470 [Google Scholar]
- Willett, K. W., Lintott, C. J., Bamford, S. P., et al. 2013, MNRAS, 435, 2835 [Google Scholar]
- Wozniak, H., Friedli, D., Martinet, L., Martin, P., & Bratschi, P. 1995, A&AS, 111, 115 [NASA ADS] [Google Scholar]
- Wuyts, S., Förster Schreiber, N. M., van der Wel, A., et al. 2011, ApJ, 742, 96 [NASA ADS] [CrossRef] [Google Scholar]
- Yi, S. K., Lee, J., Sheen, Y.-K., et al. 2011, ApJS, 195, 22 [Google Scholar]
- Yu, S.-Y., & Ho, L. C. 2020, ApJ, 900, 150 [NASA ADS] [CrossRef] [Google Scholar]
- Zhang, C., Peng, Y., Ho, L. C., et al. 2019, ApJ, 884, L52 [NASA ADS] [CrossRef] [Google Scholar]
- Zhang, C., Peng, Y., Ho, L. C., et al. 2021, ApJ, 911, 57 [NASA ADS] [CrossRef] [Google Scholar]
Appendix A: The NUV−r radial profiles of sample galaxies
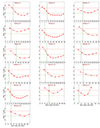 |
Fig. A.1. NUV-r colour radial profile for each sample galaxy is shown (the profile of galaxy no. 6 is already shown in Fig. 5e). The red and yellow dashed horizontal lines reference NUV-r = 5.4 and NUV-r = 4 mag, while the vertical green line represents the bar half-length. The results are discussed in Sect. 5. |
Appendix B: Structural parameters of the control sample of unbarred galaxies.
Information on the control sample of unbarred galaxies taken from NA10 and structural parameters obtained from the GALFIT tool.
All Tables
Final sample of barred galaxies is obtained based upon the following cuts and criteria mentioned in the table below from two catalogues, K18 and NA10.
Structural parameters from K18 derived from the photometric decomposition of barred disc galaxies in five SDSS bands (u, g, r, i, and z) using the automated GALFITM tool.
Information on the control sample of unbarred galaxies taken from NA10 and structural parameters obtained from the GALFIT tool.
All Figures
|
Fig. 1. SFR-M* relation defined for the final sample of 18 barred galaxies with two different SFR indicators: MPA-JHU Value Added Catalogue and GSWLC M2 catalogue. (a) SFR-M* relation for MPA-JHU VAC (Brinchmann et al. 2004) (green contours) with red line representing SFMS−1.1 dex adopted from Bluck et al. (2020). Our sample galaxies are quenched based on MPA-JHU SFR estimates. (b) SFR-M* relation for GSWLC catalogue (Salim et al. 2018) (blue contours) with red line representing SFMS−0.6 dex taken from Guo et al. (2018). Our sample galaxies are unquenched based on GSWLC SFR estimates indicating these are non-passive systems. The discrepancy is due to the estimation of SFR using different techniques adopted for both catalogues as described in Sect. 2. |
| In the text | |
|
Fig. 2. Postage stamp of colour composite images of the final sample for 18 barred galaxies from SDSS DR7 u,g,r,i, and z bands. Each image is ∼ 1 arcmin × 1 arcmin with redshift ranging from 0.01–0.06. The SDSS id is also provided on the top of each image. More information on the sources is available in Table 2. |
| In the text | |
|
Fig. 3. FUV−NUV and NUV−r colour colour map plotted with integrated colours (green points) of final sample (18 galaxies) upto R25 scale length (radii at which surface brightness reaches 25 mag arcsec−2 in the B-band). The median value for the sample is shown in purple. This UV-Optical colour-colour map is used to distinguish UV emission coming from both young stellar population and horizontal branch old stellar population. Out of 18 galaxies, 1 galaxy lies in UV weak and close to UV upturn, while the other 17 galaxies lie in star-forming region. This signifies that the galaxies of our sample are indeed star-forming. |
| In the text | |
|
Fig. 4. (a) Radial profile of ellipticity. It rises as the radius increases, peaking at the bar length and then decreasing, matching the disc’s ellipticity, shown at the top. (b) SDSS r-band image in terms of surface brightness μr (mag arcsec−2) is shown at the bottom, along with the various apertures used to represent distinct regions, such as the bulge region (red), elliptical bar region (blue), circular bar region (brown), and annular disc region (magenta) of a galaxy. |
| In the text | |
|
Fig. 5. Steps involved in the analysis (Galaxy no. 6 in Table 2). (a) Four apertures are over plotted on the SDSS r-band degraded image same as in Fig. 4b, for distinct regions i.e. bulge region (red), elliptical bar region (blue), circular bar region (brown), and disc (magenta). Outer aperture is defined by R25 scale length. The innermost aperture is defined for bulge with a fixed diameter of 6 arcsec considering GALEX PSF resolution. The middle circular aperture covers region up to bar length; (b) and (c) Same apertures are over-plotted on GALEX FUV (degraded to NUV resolution) and GALEX NUV image where flux scale is in units of surface brightness. (d) UV-optical spatially resolved colour-colour map for all structural components. The Bulge is lying in UV upturn while the disc is in star-forming region. (e) The NUV−r colour radial profile. The red and yellow horizontal dotted lines represent NUV−r = 5.4 and 4 mag, respectively. The green vertical dashed line denotes bar half-length. The colours within the bar region are redder than the outer disc, with the transition occurring near the end of the bar. |
| In the text | |
|
Fig. 6. UV-optical spatially resolved colour-colour maps for (a) the disc component, (b) the bar circular aperture region without subtracting the bulge component, (c) the bar circular aperture after subtracting the bulge and bar components, (e) the bar elliptical aperture region without subtracting the bulge, (f) the bar elliptical aperture region after subtracting the bulge, and (g) the bulge region within 6 arcsecond diameter. The diamond symbol denotes the median values in each map. The spatial resolved two colour maps reveal that the disc regions of all galaxies are bluer (< 4 mag) indicating ongoing star formation phase, while the inner region, bar and bulge regions of these galaxies within bar circular radius, are redder (> 4 mag) reminiscent of the older stellar population with ages > 1 Gyr. |
| In the text | |
|
Fig. 7. Median NUV-r colour radial profile for the complete sample of barred galaxies. The median NUV-r values (with error bars) are plotted against normalised SMA/R25, with the shadow region representing the inter-quartile range (IQR) of the y-values within each bin, bounded by the 25th and 75th percentiles. The dashed blue line indicates the median normalised bar half-length. The red and yellow dashed horizontal lines reference NUV-r = 5.4 and NUV-r = 4 mag. |
| In the text | |
|
Fig. 8. NUV-r normalised radial profile for three barred galaxies positioned differently on the SFR-M⋆ plane is shown with corresponding colour-coded bar half-lengths. The star-forming barred galaxy (blue) lies in the star-forming region, as determined by both the MPA-JHU (Brinchmann et al. 2004) and GSWLC (Salim et al. 2018) catalogues. The quenched barred galaxy (red) is positioned in the quenched region in both catalogues, while the centrally quenched galaxy (Galaxy 9) is selected from our sample. All three galaxies share similar stellar masses around the median value (logM⋆ ∼ 10.9 M⊙), within comparable redshifts and axial ratios (b/a). The figure clearly pictures the role of bars in driving barred galaxies from the MS to the quenched region by inducing a cessation of star formation. |
| In the text | |
|
Fig. 9. (a) Median NUV−r values are plotted against the normalised SMA/R25 for the control sample of 8 unbarred galaxies. (b) Median NUV−r profiles for the complete sample of barred and unbarred galaxies. (c) Median profile for unbarred galaxies after excluding four internally quenched unbarred galaxies. (d) Profiles of both barred and unbarred samples, after removing the four internally quenched unbarred galaxies. The results show that the inner regions of barred galaxies are quenched within their bar length, whereas unbarred galaxies exhibit comparatively bluer profiles. |
| In the text | |
|
Fig. A.1. NUV-r colour radial profile for each sample galaxy is shown (the profile of galaxy no. 6 is already shown in Fig. 5e). The red and yellow dashed horizontal lines reference NUV-r = 5.4 and NUV-r = 4 mag, while the vertical green line represents the bar half-length. The results are discussed in Sect. 5. |
| In the text | |
Current usage metrics show cumulative count of Article Views (full-text article views including HTML views, PDF and ePub downloads, according to the available data) and Abstracts Views on Vision4Press platform.
Data correspond to usage on the plateform after 2015. The current usage metrics is available 48-96 hours after online publication and is updated daily on week days.
Initial download of the metrics may take a while.