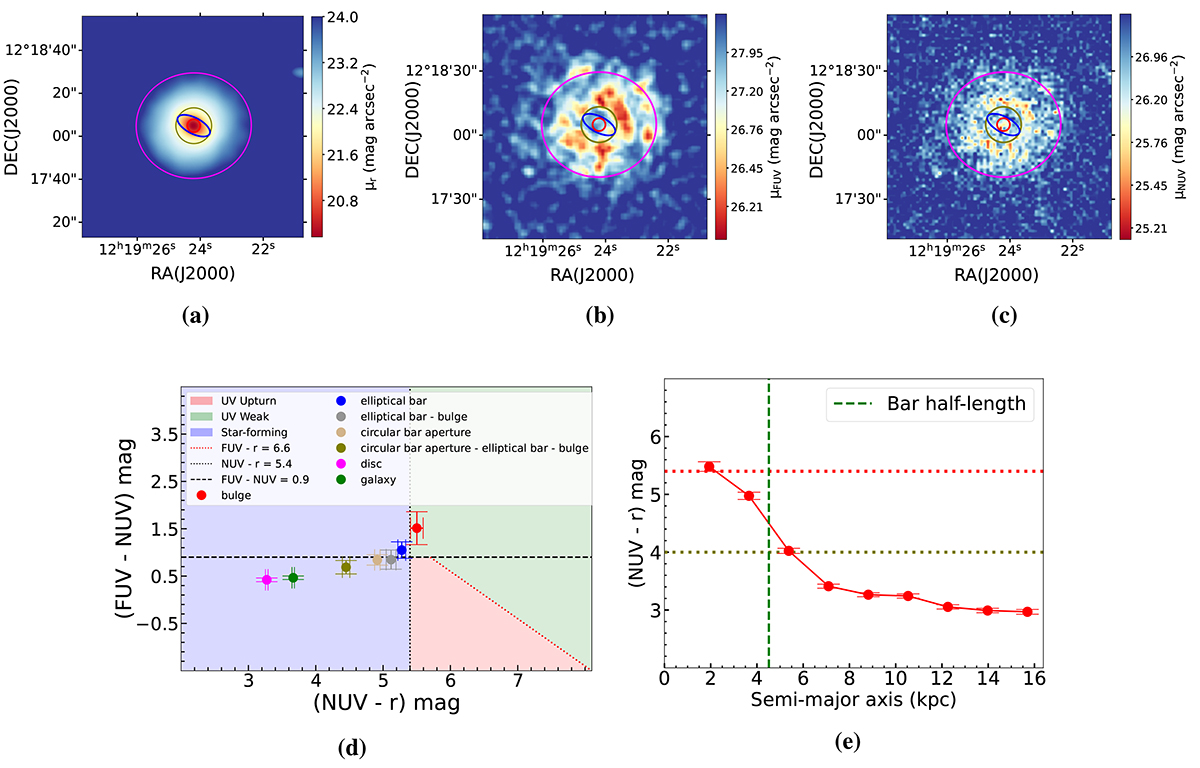
Fig. 5.
Download original image
Steps involved in the analysis (Galaxy no. 6 in Table 2). (a) Four apertures are over plotted on the SDSS r-band degraded image same as in Fig. 4b, for distinct regions i.e. bulge region (red), elliptical bar region (blue), circular bar region (brown), and disc (magenta). Outer aperture is defined by R25 scale length. The innermost aperture is defined for bulge with a fixed diameter of 6 arcsec considering GALEX PSF resolution. The middle circular aperture covers region up to bar length; (b) and (c) Same apertures are over-plotted on GALEX FUV (degraded to NUV resolution) and GALEX NUV image where flux scale is in units of surface brightness. (d) UV-optical spatially resolved colour-colour map for all structural components. The Bulge is lying in UV upturn while the disc is in star-forming region. (e) The NUV−r colour radial profile. The red and yellow horizontal dotted lines represent NUV−r = 5.4 and 4 mag, respectively. The green vertical dashed line denotes bar half-length. The colours within the bar region are redder than the outer disc, with the transition occurring near the end of the bar.
Current usage metrics show cumulative count of Article Views (full-text article views including HTML views, PDF and ePub downloads, according to the available data) and Abstracts Views on Vision4Press platform.
Data correspond to usage on the plateform after 2015. The current usage metrics is available 48-96 hours after online publication and is updated daily on week days.
Initial download of the metrics may take a while.