Fig. 7
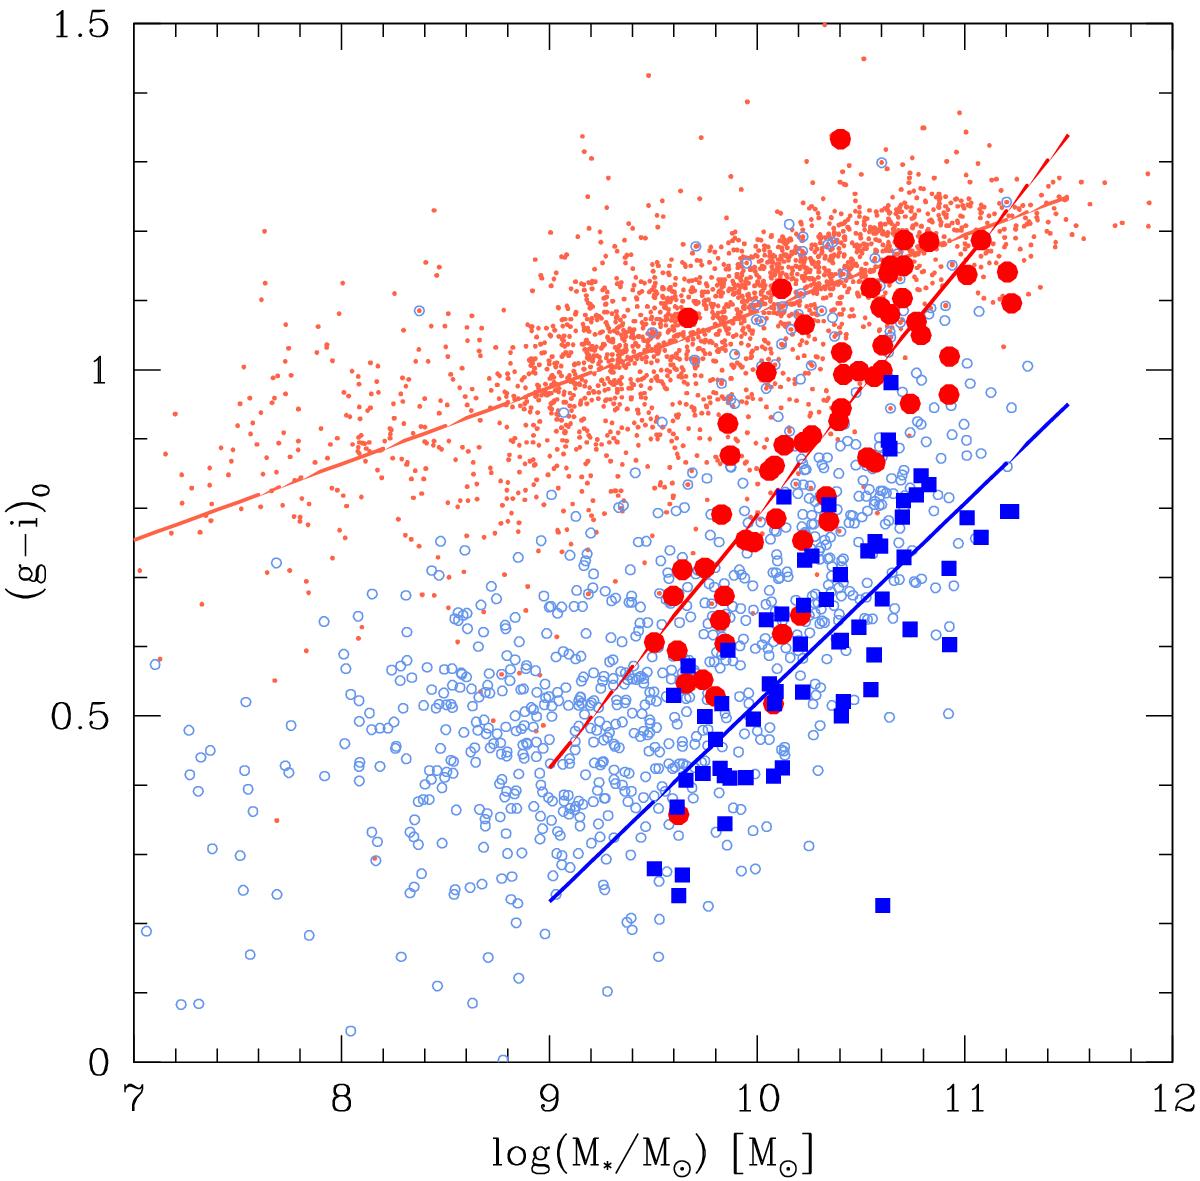
Color-mass diagram obtained with the g − i color (corrected for extinction in the Milky Way and for internal extinction). ETGs in the Coma and Local superclusters (small red points) are also shown for comparison. The LTGs are subdivided into galaxies with disks without a bulge or a bar (including dIrr and other blue dwarfs, light blues symbols) and galaxies that we classified as containing a strong bar. The colors of the latter are separately displayed as large red symbols within the corotation radius and with large blue squares outside the corotation radius. Fits to the colors of the inner and outer regions of barred galaxies (as well as for ETGs) are shown in the figure.
Current usage metrics show cumulative count of Article Views (full-text article views including HTML views, PDF and ePub downloads, according to the available data) and Abstracts Views on Vision4Press platform.
Data correspond to usage on the plateform after 2015. The current usage metrics is available 48-96 hours after online publication and is updated daily on week days.
Initial download of the metrics may take a while.