Fig. 4
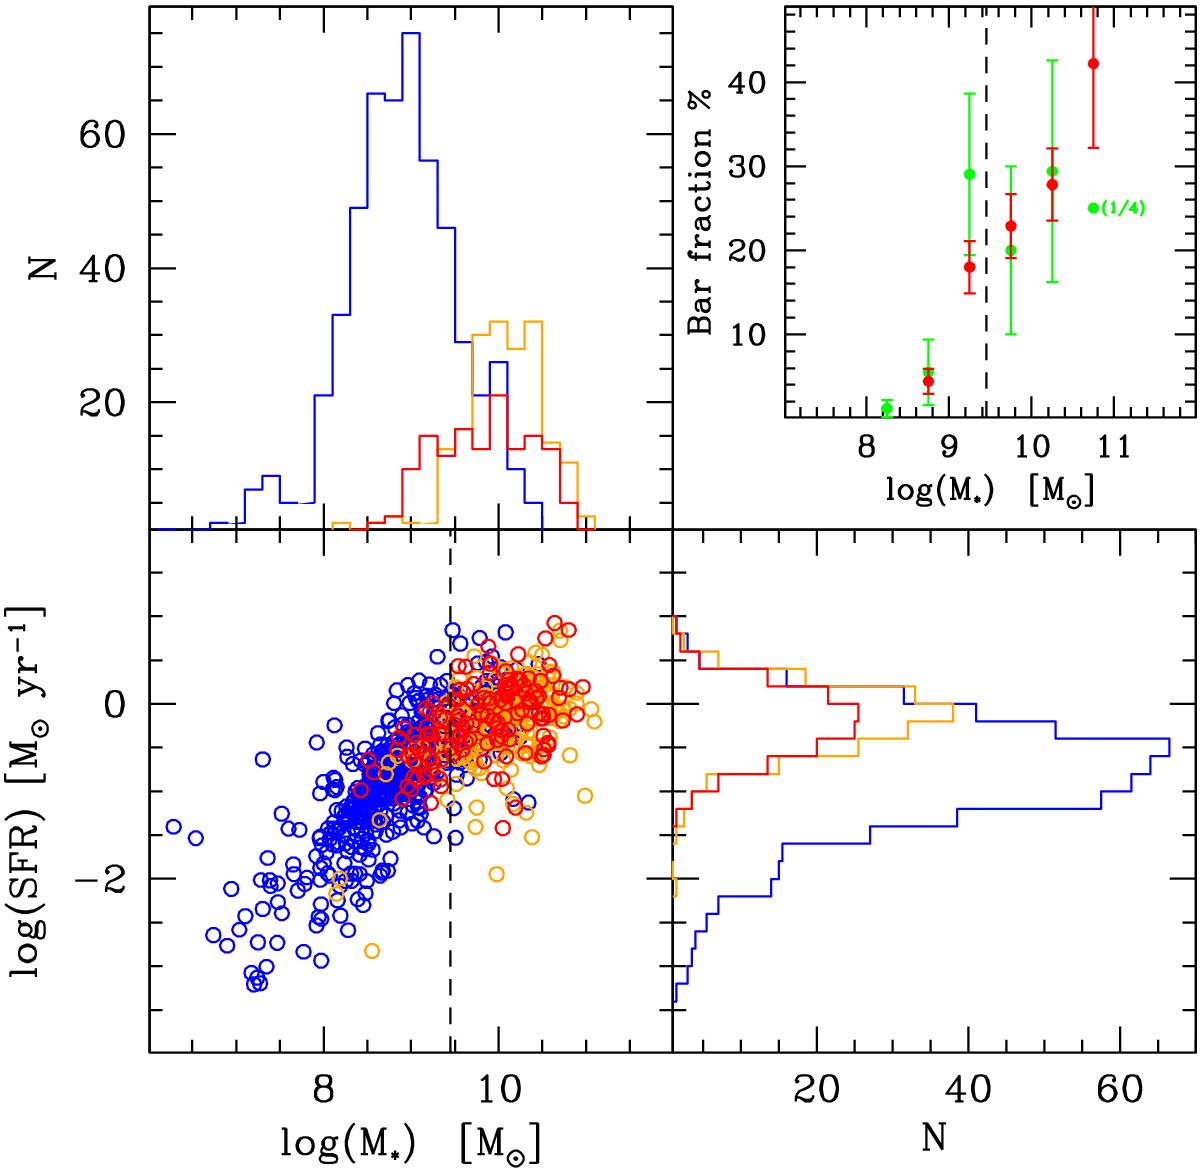
SFR versus stellar mass for the local sample in Fig. 1, but with symbols corresponding to the visual morphology: disks without bulge or bar (blue), barred disks (red), and unbarred disks with a bulge (orange). The vertical dashed line indicates Mknee at z = 0. Within the same categories, distributions in bins of stellar mass and SFR are given in the top and right histograms. The top right panel gives the fraction of visually classified strong bars as a function of stellar mass, given separately for the whole sample (red), and for the local sample (within the distance of 40 Mpc, green). Owing to the small sampled volume, the third subsample lacks statistical weight at high mass (one barred galaxy over 4 objects in the highest mass bin), while the point at the low-mass end has the highest statistical significance (one barred galaxy over 85 targets).
Current usage metrics show cumulative count of Article Views (full-text article views including HTML views, PDF and ePub downloads, according to the available data) and Abstracts Views on Vision4Press platform.
Data correspond to usage on the plateform after 2015. The current usage metrics is available 48-96 hours after online publication and is updated daily on week days.
Initial download of the metrics may take a while.