Fig. 2
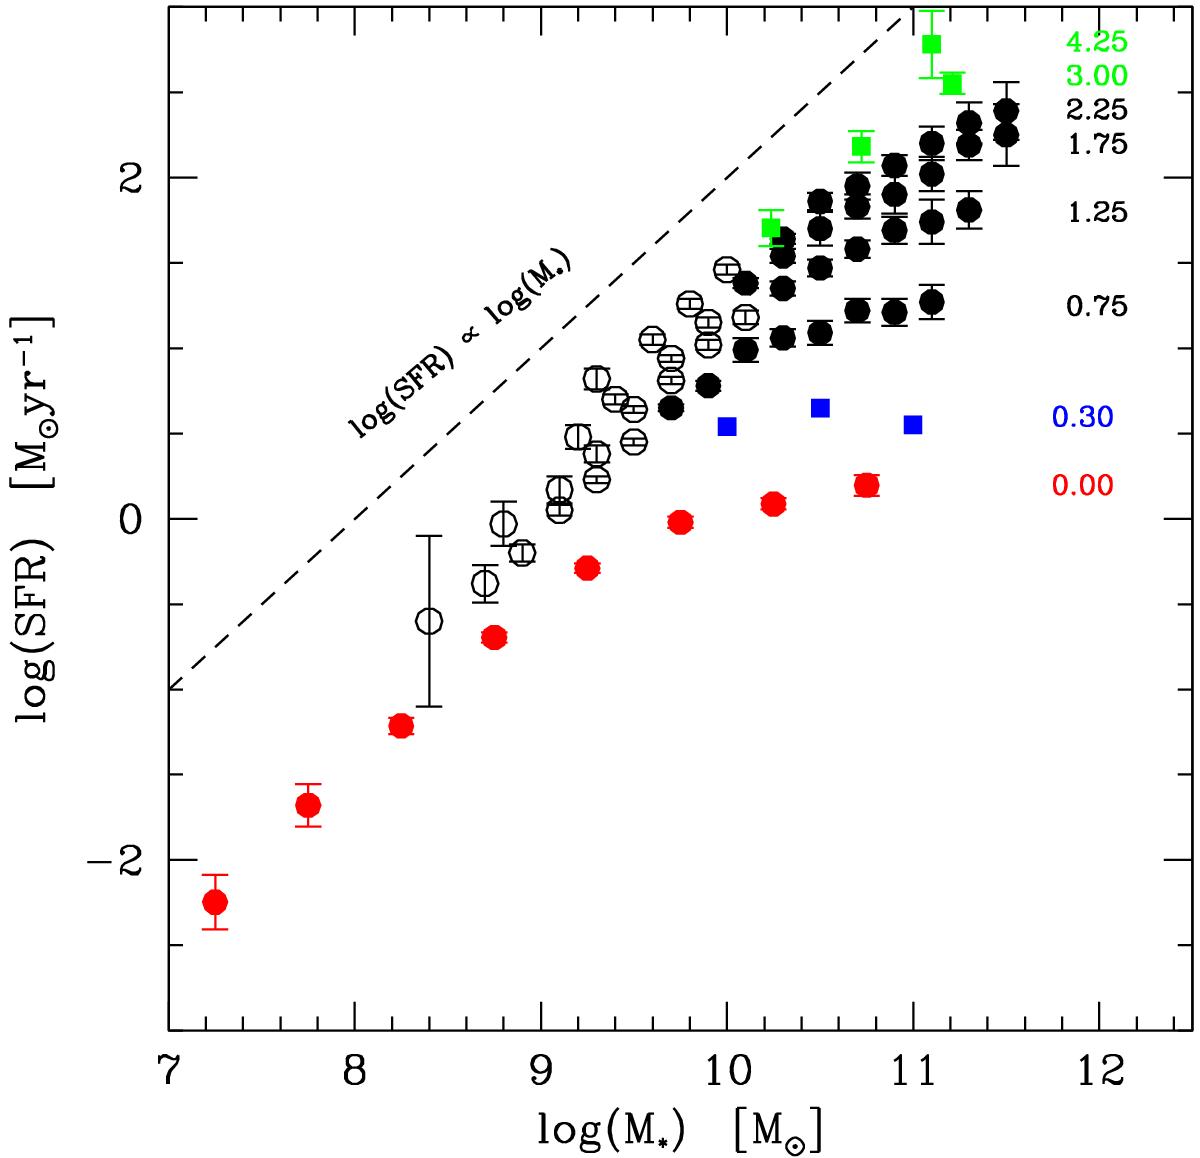
Star formation rate as a function of stellar mass in bins of redshift. Data at z = 0 (red) are from this work (red symbols in Fig. 1). Data at z = 0.3 (blue) are from Bauer et al. (2013). Measurements in the interval 0.75 <z< 2.25 (black) are from Whitaker et al. (2014) (empty circles are for mass bins where individual galaxies were stacked when deriving IR luminosities); the points at z = 3 and z = 4.25 (green) are from Schreiber et al. (2015). Whitaker et al. (2014) and Schreiber et al. (2015) data are plotted above their respective completeness limit.
Current usage metrics show cumulative count of Article Views (full-text article views including HTML views, PDF and ePub downloads, according to the available data) and Abstracts Views on Vision4Press platform.
Data correspond to usage on the plateform after 2015. The current usage metrics is available 48-96 hours after online publication and is updated daily on week days.
Initial download of the metrics may take a while.