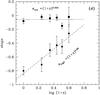
Fig. 3
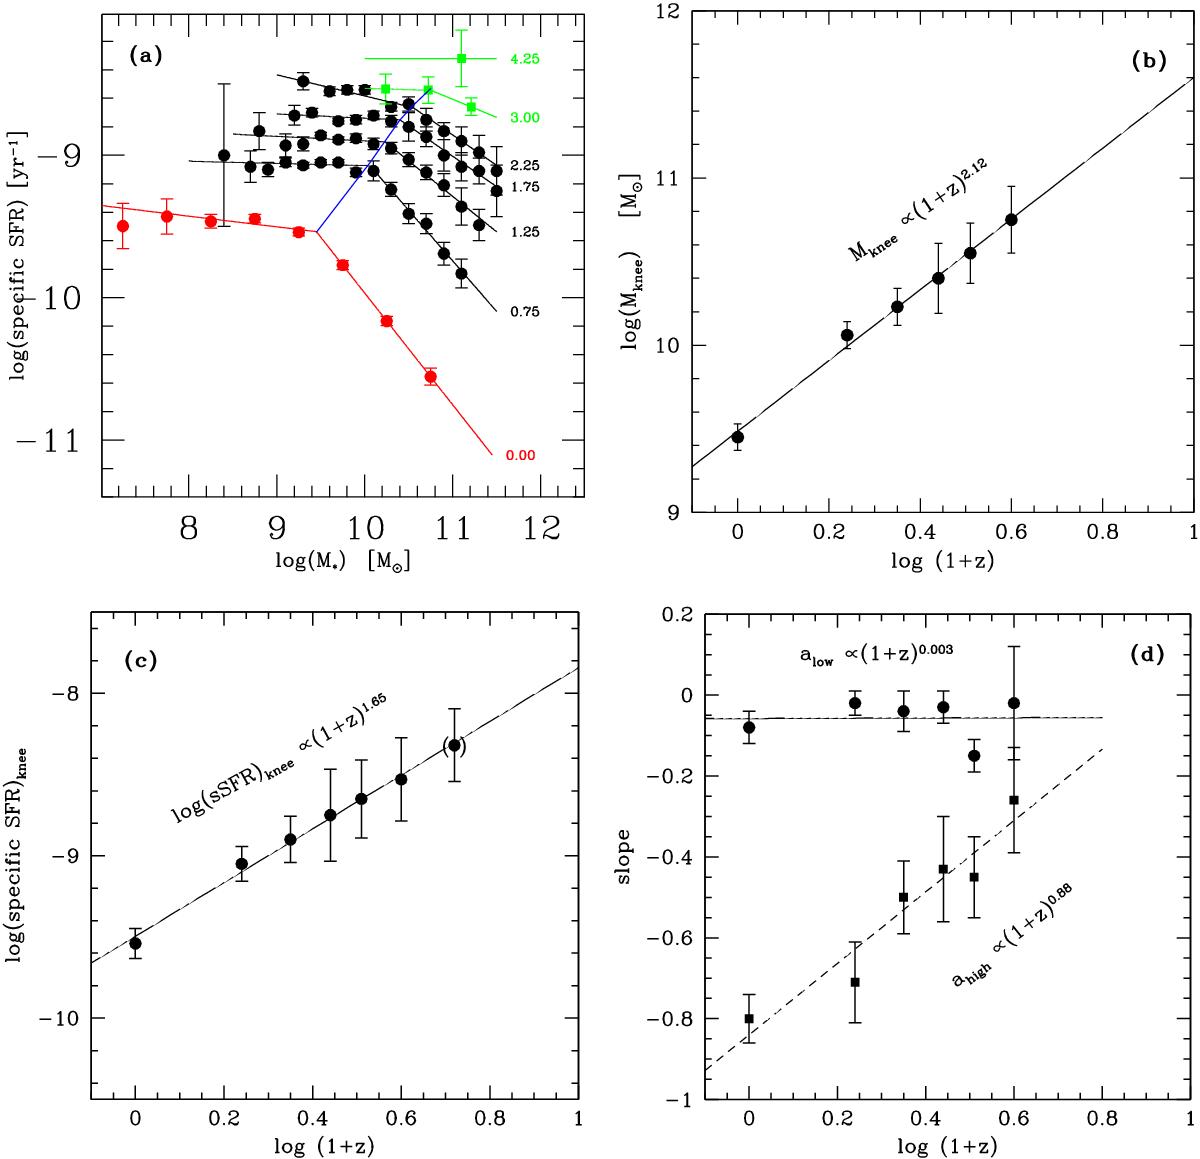
Panel a) specific star formation rate as a function of stellar mass in bins of redshift. For all redshift bins the data are fitted with a broken power law with slope alow, holding below a critical mass (Mknee), and ahigh holding above Mknee (see Table 2). The blue line connects the loci of Mknee for the various redshifts. Panel b) position of the Mknee as a function of log (1 + z). Panel c) specific star formation at Mknee. Panel d) slope below and above Mknee (alow and ahigh). The position of Mknee and the specific SFR at Mknee increase approximately as (1 + z)2, while the mass quenching (given by ahigh) becomes less efficient with increasing redshift.
Current usage metrics show cumulative count of Article Views (full-text article views including HTML views, PDF and ePub downloads, according to the available data) and Abstracts Views on Vision4Press platform.
Data correspond to usage on the plateform after 2015. The current usage metrics is available 48-96 hours after online publication and is updated daily on week days.
Initial download of the metrics may take a while.