| Issue |
A&A
Volume 578, June 2015
|
|
|---|---|---|
| Article Number | A4 | |
| Number of page(s) | 41 | |
| Section | Galactic structure, stellar clusters and populations | |
| DOI | https://doi.org/10.1051/0004-6361/201424132 | |
| Published online | 22 May 2015 | |
Circumstellar discs in Galactic centre clusters: Disc-bearing B-type stars in the Quintuplet and Arches clusters⋆,⋆⋆,⋆⋆⋆
1
Argelander Institut für Astronomie, Universität Bonn,
Auf dem Hügel 71,
53121
Bonn,
Germany
e-mail: This email address is being protected from spambots. You need JavaScript enabled to view it.
2
Astronomisches Recheninstitut, Universität
Heidelberg, Mönchhofstr.
12-14, 69120
Heidelberg,
Germany
3
Max-Planck-Institut für Astronomie, Königstuhl 17, 69117
Heidelberg,
Germany
4
Max-Planck-Institut für extraterrestrische Physik,
Giessenbachstrasse 1,
85748
Garching,
Germany
5
Division of Astronomy and Astrophysics, UCLA, Los Angeles, CA
90095-1547,
USA
6
Institute for Astronomy, University of Hawaii,
2680 Woodlawn Drive,
Honolulu, HI
96822,
USA
7
Department of Natural Sciences, University of
Michigan-Dearborn, 125 Science
Building, 4901 Evergreen Road, Dearborn, MI
48128,
USA
8
Space Telescope Science Institute, 3700 San Martin Drive, Baltimore, MD
21218,
USA
Received:
5
May
2014
Accepted:
28
January
2015
Abstract
We investigate the circumstellar disc fraction as determined from L-band excess observations of the young, massive Arches and Quintuplet clusters residing in the central molecular zone of the Milky Way. The Quintuplet cluster was searched for L-band excess sources for the first time. We find a total of 26 excess sources in the Quintuplet cluster, and 21 sources with L-band excesses in the Arches cluster, of which 13 are new detections. With the aid of proper motion membership samples, the disc fraction of the Quintuplet cluster could be derived for the first time to be 4.0 ± 0.7%. There is no evidence for a radially varying disc fraction in this cluster. In the case of the Arches cluster, a disc fraction of 9.2 ± 1.2% approximately out to the cluster’s predicted tidal radius, r< 1.5 pc, is observed. This excess fraction is consistent with our previously found disc fraction in the cluster in the radial range 0.3 <r< 0.8 pc. In both clusters, the host star mass range covers late A- to early B-type stars, 2 <M< 15 M⊙, as derived from J-band photospheric magnitudes. We discuss the unexpected finding of dusty circumstellar discs in these UV intense environments in the context of primordial disc survival and formation scenarios of secondary discs. We consider the possibility that the L-band excess sources in the Arches and Quintuplet clusters could be the high-mass counterparts to T Tauri pre-transitional discs. As such a scenario requires a long pre-transitional disc lifetime in a UV intense environment, we suggest that mass transfer discs in binary systems are a likely formation mechanism for the B-star discs observed in these starburst clusters.
Key words: techniques: high angular resolution / open clusters and associations: individual: Quintuplet / circumstellar matter / open clusters and associations: individual: Arches / astrometry / proper motions
Based on data obtained at the ESO VLT under programme IDs 085.D-0446, 089.D-0121 (PI: Stolte), 081.D-0572 (PI: Brandner), 087.D-0720, 089.D-0430 (PI: Olzcak), 071.C-0344 (PI: Eisenhauer), 60.A-9026 (NAOS/CONICA science verification), as well as Hubble Space Telescope observations under programmes 11671 (PI: Ghez).
Appendices are available in electronic form at http://www.aanda.org
The photometric catalogue is only available at the CDS via anonymous ftp to cdsarc.u-strasbg.fr (130.79.128.5) or via http://cdsarc.u-strasbg.fr/viz-bin/qcat?J/A+A/578/A4
© ESO, 2015
1. Introduction
In view of the short lifetimes of primordial circumstellar discs around B-type stars in dense environments, the detection of circumstellar discs in the UV-rich environment of the Galactic centre Arches cluster came as a surprise (Stolte et al. 2010). This detection raised the question of whether discs can also be found in the more evolved Quintuplet cluster, and whether these discs can have their origin in massive primordial discs sustained over the clusters’ lifetimes of several million years (Myr). In particular, the nature of the disc sources in the Arches cluster has remained unsolved (see the discussion in Stolte et al. 2010). In the past five years, we have extended our disc search to larger radii in the Arches cluster and have encompassed the Quintuplet cluster. With the aim of shedding light on the nature of the L-band excess sources found in both starburst clusters, we compare their physical properties to pre-transitional discs and discuss secondary mass transfer discs as a possible origin of the circumstellar material.
1.1. Circumstellar disc survival
The survival of primordial circumstellar discs in young star clusters is known to be a steep function of cluster age (Haisch et al. 2001; Hernández et al. 2005). For discs around low-mass stars, M ~ 1 M⊙, planet formation theories suggest that dust agglomeration causes a period of grain growth, while at the same time the dense gas of the primordial disc is evaporated by the central star (Cieza et al. 2012; Williams & Cieza 2011; Owen et al. 2011). In consequence, the thermal excess of evolved discs is dominated by increasingly longer wavelength emission, while the near-infrared contribution decreases and vanishes with time (e.g. Espaillat et al. 2012). The disc survival timescale in young stellar clusters is observed to be 3–10 Myr for intermediate-mass stars, 2 <M< 10 M⊙ (Hernández et al. 2005), albeit with lower disc fractions at any given age than clusters dominated by their lower-mass T Tauri counterparts (see Stolte et al. 2010 for a detailed discussion). Hernández et al. (2005) suggest that settling in the disc might depend on the stellar mass, such that the stellar radiation could penetrate discs around higher mass stars more rapidly, which might accelerate the destruction by UV radiation from the central star even further. This mass-dependent process would decrease the rate of survival of the hot inner disc as observed through near-infrared excess emission around high-mass stars. For Herbig Ae/Be stars in nearby OB associations, Hernández et al. find intermediate-mass disc fractions of only 2–5% at ages 3–10 Myr. In particular in the dense environment of starburst clusters such as the Arches and Quintuplet clusters near the Galactic centre, star-disc interactions (Olczak et al. 2012) and the external UV radiation field (Anderson et al. 2013; Fatuzzo & Adams 2008; Adams et al. 2004; Scally & Clarke 2001; Richling & Yorke 2000; Johnstone et al. 1998) might contribute to an even more rapid depletion of circumstellar material.
Until recently, circumstellar discs in young star clusters were mostly identified by their K- and L-band near-infrared excess emission. This definition distinguishes primordial discs with dense, hot inner rims from disc-less stars or stars with evolved transitional discs. The near- to mid-infrared capabilities of the recent Spitzer space mission enabled the detection and definition of more subtle classes of discs. Transitional discs were traditionally defined as objects lacking near-infrared emission, yet displaying strong mid- or far-infrared excesses (see Espaillat et al. 2012 for a summary, and references therein). With larger sample sizes and improved spatial resolution, several of the proposed transition objects reveal significant substructure in their spectral energy distributions (SEDs), with small but significant near-infrared excess contributions as a tracer for optically thick inner discs. In contrast to primordial discs, their near-infrared emission is accompanied by mid-infrared dips, suggestive of disc gaps. These objects are defined as pre-transitional discs by Espaillat et al. (2012), and can also be identified with the near-infrared bright subclass of the so-called warm debris discs detected with the AKARI mission by Fujiwara et al. (2013). Although debris discs are typically found around stars with older ages of more than 10 Myr, the ages of these near-infrared bright discs are not known. While transitional discs are by definition absent from the classical L-band excess searches for primordial circumstellar discs, pre-transitional discs could contribute to the disc fractions observed in young, massive star clusters, if they are common around main-sequence B-type as well as T Tauri stars.
1.2. The Arches and Quintuplet clusters
The Arches and Quintuplet clusters are young, massive star clusters located at a projected distance of ~30 pc from the Galactic centre (GC). Both clusters are host to a rich population of more than 100 massive O- and B-type stars (Liermann et al. 2009; Martins et al. 2008). From the extrapolation of the observed stellar mass function, they have estimated photometric masses of about 104M⊙ (Habibi et al. 2013; Hußmann et al. 2012). According to dynamical simulations, the underlying stellar mass is suggested to be as high as 4 × 10⁴M⊙ for the Arches cluster (Harfst et al. 2010). Spectroscopic age dating of the evolved population of Wolf-Rayet (WR) and giant or supergiant stars suggests an age of 2.5 ± 0.5 Myr (Najarro et al. 2004), with a possible upper age limit for the Arches cluster of 4 Myr obtained from supergiant member stars. For the Quintuplet cluster the situation is not as clear. Earlier studies have suggested an age of 4 ± 1 Myr from spectral fitting to the evolved population (Figer et al. 1999). A newer Very Large Telescope (VLT) SINFONI spectral analysis finds ages of ~4 Myr for the OB stars (Liermann et al. 2012) and suggests ages as young as 2−3 Myr for the WN stars (Liermann et al. 2010), but these objects in particular may be affected by binary mass transfer evolution and the corresponding rejuvenation (Schneider et al. 2014). For the purposes of this paper, we adopt an age of 2.5 ± 0.5 Myr for the Arches cluster, and 4 ± 1 Myr for the Quintuplet, as these ages are consistent with the isochrones we adopt for stellar mass derivations (see Hußmann et al. 2012; Habibi et al. 2013).
1.3. Discs in the Arches cluster
In the Arches cluster, a population of disc-bearing stars was found from near-infrared excesses using high-resolution Keck/NIRC2 adaptive optics observations in the dense cluster core (Stolte et al. 2010). From L′-band excesses, we derived the fraction of disc-bearing B-type main-sequence stars to be 6 ± 2% at radii r< 0.8 pc from the cluster centre. A radial increase in the disc fraction from 3% for r< 0.1 pc to 10% for 0.3 <r< 0.8 pc suggested that circumstellar discs are prone to destruction by UV radiation or gravitational interactions in the dense cluster environment (e.g. Olczak et al. 2012). Of 24 detected excess sources, all 21 sources with reliable proper motion measurements proved to be genuine members of the Arches cluster. The detection of CO 2.3 μm bandhead emission in VLT/SINFONI K-band spectra available for three sources provided additional evidence that the L-band excess originates from hot circumstellar material in a disc geometry. For the Arches sources presented in Stolte et al. (2010), we estimated a host star mass range of 3−10 M⊙ based on H-band luminosities which showed little to no infrared excess emission. One of the remaining mysteries was the apparently old age of 2.5 Myr for circumstellar material around B-type stars. Previous observational studies of Herbig Ae/Be stars suggested that photoevaporation destroys primordial discs around high-mass stars within less than 1 Myr (Hillenbrand et al. 1998; Hernández et al. 2005; Alonso-Albi et al. 2009; Gorti et al. 2009). A short survival timescale of less than 1–3 Myr in UV-rich clusters is confirmed by numerical simulations of disc survival (Anderson et al. 2013, and references therein). When FUV, EUV, and X-ray luminosities are taken into account, stars with M< 3 M⊙ have simulated disc lifetimes of several 106 years. The survival timescale plummets for higher-mass stars and already reaches less than 106 years for a 10 M⊙ central star (Gorti et al. 2009, see their Fig. 12). Thus, the survival of primordial discs around B-type stars, even at a low rate, was unexpected. The arguments leading to early disc destruction should be even more valid for the older Quintuplet cluster.
Here, we investigate VLT high-resolution adaptive optics KsL′ observations in combination with HST/WFC3 JH photometry to extend the cluster area covered in the Arches out to r = 1.5 pc, close to the cluster’s predicted tidal radius (Habibi et al. 2013), and to detect disc candidates in the more evolved Quintuplet cluster for the first time. Proper motion membership from two-epoch adaptive optics Ks data is employed to confirm the cluster origin and hence the youth of the discovered L-band excess sources.
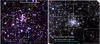 |
Fig. 1 WFC3 JH colour composite of the Quintuplet cluster (left panel) and Arches cluster (right panel) covered with both HST/WFC3 and NACO observations. The NACO fields are shown as boxes. L-band excess sources detected in both clusters are overlaid as circles. Previously detected excess sources in the Arches are shown as smaller cyan circles. Excess sources in the cluster centres are circumscribed in blue for clarity. |
Towards the end of this contribution, we provide a detailed discussion of the origin of the L-band emission (Sect. 5), and compare the expected location of the hot dust with the dust sublimation and inner disc radii. We compare our findings to studies of transition discs with near- to mid-infrared emission recently discovered by the Spitzer and AKARI surveys (e.g. Fujiwara et al. 2013; Maaskant et al. 2013; Espaillat et al. 2010, 2011; Muzerolle et al. 2010; Teixeira et al. 2012; Furlan et al. 2009) to investigate the evolutionary state of the disc candidates in the Arches and Quintuplet clusters. The problem of the disc lifetime is addressed, and secondary disc formation will be proposed as a possible scenario to explain the Arches and Quintuplet near-infrared excess sources and their apparent expanded lifetime compared to primordial discs around Herbig Be stars.
In Sect. 2, we present the VLT and HST observations, and the photometric and astrometric analysis is summarised in Sect. 3. The disc fraction of the Quintuplet cluster is derived in Sect. 4.1, and new Arches disc sources are presented in Sect. 4.2. The physical properties of the L-band excess sources are discussed in Sect. 5, and we summarise our findings in Sect. 6.
VLT/NACO observations.
Photometric sensitivity limits (in calibrated magnitudes), estimated from the peak of the luminosity functions, and number of sources in matched JHKs and JHKsL′ catalogues.
HST/WFC3 observations.
2. Observations
2.1. VLT/NAOS-CONICA
For the membership campaign of the Arches and Quintuplet clusters, multi-epoch Ks imaging with time baselines of 3 to 5 years was obtained with the VLT adaptive optics system NAOS and its near- to mid-infrared camera CONICA (hereafter NACO, Lenzen et al. 2003; Rousset et al. 2003) during the time period 2002–2012. Complementary L′-band images were observed in June and August 2012. A complete list of all NACO data sets analysed in this paper is provided in Table 1.
The Ks images were obtained with the S27 camera with a pixel scale of 27.1 milliarcseconds (mas)/pixel, covering a 27′′ × 27′′ field of view. Five fields were identified in each cluster with suitable natural guide stars operating mostly with the near-infrared wavefront sensor. As a consequence of the high foreground extinction of AV ~ 25 mag, optical guide stars are rarely available along the Galactic centre line of sight, such that the unique NIR sensing capability of NAOS was extensively exploited to obtain the wide area coverage of both clusters. The Arches and Quintuplet mosaics cover maximum distances of 48′′ and 60′′ from the cluster centres, corresponding to 1.8 pc and 2.3 pc at a distance of 8.0 kpc, respectively. Arches Field 2 reaches larger distances out to 63′′ (Fig. 1), but is not part of the coherent mosaic of this cluster. For the Quintuplet cluster with evolved stars as bright as Ks = 7.3 mag, the N20C80 dichroic could be used, which distributed 80% of the light to the science camera and only 20% to the wavefront sensor for natural guiding. As the brightest sources in the Arches cluster are substantially fainter, Ks = 10.4 mag, the N90C10 dichroic had to be employed with only 10% of the light diverted to CONICA. The Arches Ks data are correspondingly shallower than the Quintuplet data sets. Detection limits are provided in Table 2.
The first epoch data were optimised for deep photometry using individual detector integration times (DITs) of up to 20 s. In all newer data sets DITs were kept short to avoid saturation of the brighter stars to establish the cluster reference frame for astrometric proper motion measurements. Because of the different setup, these DITs ranged from 2 s for the N20C80 observations to 10 s for N90C10 imaging.
The Ks observations were complemented with single-epoch L′ imaging obtained in 2012. In the case of L′, NACO offers a JHK dichroic, which passes all near-infrared light to the wavefront-sensor, and allows the full L-band channel to be diverted to the science detector. The limiting factor in L′ is the sky brightness, such that the detector saturates rapidly even in very short integration times. To avoid saturation, the exposure time was set to 0.175 s–0.2 s (the shortest feasible integration times with the CONICA detector) using the uncorrelated readout mode. Between 150 and 170 individual DITs were coadded to a total integration time of ~30 s per science image. The L27 camera was used with a pixel scale of 27.1 mas/pix to provide the same spatial coverage as for the Ks-band observations. The data were obtained in dither mode for both filters with dither offsets between 30 and 70 pixels (0.8′′ to 2′′) to allow for sky subtraction and the removal of hot pixels, which are of particular concern in infrared detectors. The dither offset was chosen to be less than 1/10 of the field size in the astrometry-oriented epochs (2008 and onwards) to minimise the impact of optical distortions and to optimise the relative astrometric performance between proper motion epochs.
In order to monitor sky variations, separate sets of sky images were observed in Ks after, and in L′ interleaved with, the science images. Sky fields are observed in open-loop mode without adaptive optics correction with NACO, such that residual starlight is spread out across the detector and leads to a biased sky level in the combined master sky. As it is difficult to find star-free fields in the vicinity of the clusters because of the high stellar density along the GC line of sight, all sky fields contained some residual star light. Given these complications, three different procedures were attempted especially for the L′-band data, where the sky is the most limiting factor on sensitivity (Sect. 3.1).
2.2. HST/WFC3
Hubble Space Telescope (HST) images were obtained with the wide-field camera WFC3 in the near-infrared channel in the medium-band WFC3 F127M and F153M filters, corresponding approximately to the J and H broadband filters in the ground-based near-infrared system, in August, 2010, under programme ID 11671 (PI: Ghez). The integration times were 600 s and 350 s in F127M and F153M per individual frame, and a total of 12 and 21 single images lead to combined image integration times of 120 min in each filter (see Table 3). WFC3 offers a field of view of 2.2′ × 2.0′, which was also the approximate size of the drizzled image, such that each cluster is covered with a single pointing (Fig. 1). Images were dithered with small positioning offsets between 0.6 and 10 pixels (0.08′′−1.2′′) to allow for image reconstruction and bad pixel removal. While the reduced, distortion-corrected and pre-combined Arches images were obtained from the MAST archive, the Quintuplet images were obtained before the final version of the distortion solution was integrated into the standard WFC3 pipeline. These images were processed using the multidrizzle algorithm (Koekemoer et al. 2002; Fruchter et al. 2009) with the most recent distortion solution applied. Prior to image combination, the image shifts were adjusted with the pyraf tweakshifts routine provided for WFC3 pipeline reduction (see the WFC3 Data Reduction Handbook for details)1.
3. Analysis
3.1. VLT/NACO
3.1.1. Data reduction
The data reduction for the VLT/NACO Ks and L′ images was carried out with a custom-made reduction pipeline based on python/pyraf and IDL routines. The basic steps in Ks included dark subtraction, flat fielding, the removal of cosmic ray hits and hot pixels, and the subtraction of a master sky. Twilight flat fields were observed with decreasing brightness, such that the pixel sensitivity could be obtained as the slope of the brightness variation in each pixel. Bad pixels were identified during the combination of the master flat field as pixels where the sensitivity deviated significantly from the mean. In addition to this universal bad pixel mask for each data set, individual bad pixel masks were created using the iraf task cosmicrays to identify positive, spatially confined flux peaks. Where possible, the sky image for each science set was derived from the adjacent sky exposures at an off-cluster position without adaptive optics correction. As these images frequently contained residual star flux, the best sky subtraction was in some data sets achieved by median-combining both dithered sky and science images to create a flat thermal background image free of residual stellar light. The choice of the sky subtraction procedure depended on the individual dataset.
In L′, no master darks are provided by ESO, hence the basic reduction steps consisted of flat fielding and sky subtraction. The thermal background is the dominant source of uncertainty at 3.8 μm. For most of the L′ data sets several attempts at sky subtraction had to be made: i) one master sky was median-combined from all science and interleaved sky images; ii) one master sky was median-combined from the sky images only; and iii) individual skies were created from the images closest in time to the considered science frame. After each of these master skies was subtracted from the science images, the final image with the least background noise and the highest contrast and sensitivity was selected for photometric analysis.
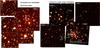 |
Fig. 2 NACO Ks mosaic of fields in the Quintuplet (left) and Arches (right) clusters. The same fields are approximately covered in L′. In the Arches cluster, Field 2 is not shown and is located to the lower right of the cluster (see Fig. 1). Disc candidates are indicated in both clusters as white circles. Yellow circles in the Quintuplet mark disc candidates fainter than the completeness limit of J = 22 mag in the left panel. Previously known disc candidates in the Arches detected in our earlier higher-resolution Keck/NIRC2 observations are included for comparison as smaller cyan circles in the right panel (Stolte et al. 2010). The star serving as coordinate reference for all catalogues is indicated by the arrow. |
Both Ks and L′ images were combined into one deep exposure with the drizzle task (Fruchter & Hook 2002). The routines precor, crosscorr, and shiftfind were employed to derive the positional offsets. For these adaptive optics data, the precor task, which allows masking of background patterns, aided the identification of the true spatial shifts from the cross-correlation image. Finally, the individual bad pixel masks were applied to each image during the image combination process. We note here that no distortion correction was applied during drizzling. Despite continued efforts to characterise the optical distortions in NACO, the distortion correction still bears large uncertainties, especially for the median-field camera S27 (see e.g. Trippe et al. 2008; Fritz et al. 2010). We interpret this as an effect of anisoplanatism, which depends on the nightly conditions and causes additional point source image distortions. As these distortions depend on the isoplanatic angle and the adaptive optics correction during the time of the observations, the natural guide star distance from the field centre, and the brightness of the NGS, they add a strong random component to each source position, such that no uniform instrument distortion solution could be derived (see Sect. 2.3 in Habibi 2014 for details)2. During the NACO observations, the influence of optical distortions on the relative astrometric uncertainty is minimised by conducting a small-scale dither pattern to avoid large image shifts, and by using the same observational setup and positioning in each field during each epoch (see also Ghez et al. 2008; Yelda et al. 2010).
3.1.2. Photometry and astrometry
The crowded nature of the GC cluster fields required point spread function (PSF) fitting to perform the photometry and astrometry on each image. At a field size of 27′′, the NACO images are severely influenced by anisoplanatism. As shown in Hußmann et al. (2012), a constant PSF across the field yields reliable astrometric measurements only in the area near the natural guide star, which is typically (but not always) located near the field centre. While we restricted the analysis of the stellar mass function of the Quintuplet cluster in this previous paper to a radius of r< 500 pixels or 13′′, the purpose of the present disc study is to cover the cluster areas as completely as possible. Therefore, the IRAF daophot package (Stetson 1992) was employed to obtain PSF fitting photometry and astrometric positions of all stars. Quadratically varying PSF functions were used to minimise the spatially varying effects of source elongation due to anisoplanatism on the derived astrometry and photometry as much as possible.
In the deep Quintuplet central field of the 2003 observations obtained exclusively with single-frame integration times of 20 s, a quadratic variation provided unsatisfactory results. In particular in the deep exposure, stars within ~5′′ from the edge of the drizzled image were rejected during the PSF fitting procedure as a consequence of their irregular shape. Therefore, the long-exposure combined image (see Table 1) was split into four quadrants for which individual PSFs were created and subtracted. After the quadrants were separated, a linearly varying function was sufficient to obtain a good fitting performance across each quadrant. In the overlap regions, the standard deviations in x and y residuals between astrometric measurements were below 0.2 pixels, which is the expected variable PSF fitting accuracy in these performance-limited data sets. The individual quadrant photometric lists were then recombined using the offset shifts applied earlier when splitting the images.
The Ks photometry of the Arches cluster was calibrated with respect to Espinoza et al. (2009). Fields 3-5 were calibrated from overlap areas with the central field and calibrations were cross-checked in each overlap region. Field 2 has no overlap with any of the previous observations and the remainder of the Arches fields, and was calibrated against the UKIDSS Ks Galactic Plane Survey (Lucas et al. 2008, spatial resolution 1′′). The Quintuplet Ks photometry was calibrated with respect to the UKIDSS GPS survey as well, although in a two-step procedure, which helped overcome the resolution differences. First, VLT/ISAAC observations3 taken under excellent conditions were calibrated over a 2.4 arcmin field of view with respect to UKIDSS Ks. No colour terms were found, and a zeropoint offset was applied. The NACO Ks high-resolution photometry with a spatial resolution of ~0.1′′ was calibrated with respect to the seeing-limited ISAAC Ks photometry with a spatial resolution of ~0.4′′ in a second step. Details can be found in Hußmann (2014).
The L′ photometry was zeropointed with respect to 3.8 μm IRAC photometry obtained with the Spitzer GLIMPSE survey (Benjamin et al. 2003; Churchwell et al. 2009). Because of the large number of detections missing from the source catalogues, photometry on the IRAC 3.8 μm images was rederived using daophot PSF fitting. The large area coverage of the images allowed for a robust calibration against the downloaded Spitzer catalogues. For the cluster fields, however, the low resolution of the Spitzer data implied that only a few sources (4-6) were available as references, even in the PSF fitting photometry source lists. In the J − H, Ks − L′ colour–colour diagrams, the uncertain L-band calibration manifested itself as offsets from the reddening path. We therefore checked the J − H, H − Ks colour–colour diagrams for consistency with the reddening path (Nishiyama et al. 2009). Any remaining offsets in L′ were adjusted in the JHKsL′ colour–colour diagram such that the Ks − L′ colour was also consistent with the reddening path.
3.1.3. Photometric and astrometric uncertainties
Photometric and astrometric uncertainties were derived by independent repeated measurements of the photometry of each star. We combined three subsets of each individual image stack to perform these measurements. In one data set, the number of frames and the image quality were compromised, such that only two subsets could reasonably be obtained. To ensure that the data quality of each subset image is comparable to that in the deep image, care was taken that each auxiliary image created from a single subset contained frames over the full range of spatial resolutions and photometric sensitivities as contributed to the deep image. For this purpose, the range in performance was measured as the full width at half maximum (FWHM) of the PSF on each individual image, and each subset list contained images over the entire range of FWHM values. Daophot was then run with the same PSF fitting parameters as in the respective deep image on each auxiliary image to produce repeated measurements of the photometry. Each star that entered the final source catalogues was required to be detected in at least two auxiliary images in addition to the deep science frame. The photometric and astrometric uncertainties were then calculated either as the standard error given as the standard deviation from the mean divided by sqrt(3) if a star was detected in all three auxiliary images, or as the deviation from the mean of the two measurements if the star was only detected in two auxiliary frames. This was mostly the case for faint stars, but could also be caused by incomplete area coverage of the subset images in comparison to the complete deep image. In the data set where only two auxiliary images could be obtained, the uncertainties are always given as the deviation from the mean, and all stars are again required to be detected in both auxiliary images.
Photometric uncertainties are shown in Fig. 3 for the Quintuplet and in Fig. 4 for the Arches cluster. All uncertainties are accordingly quoted in the final source catalogue along with the magnitude and positional measurements of the deep science image4.
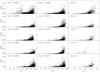 |
Fig. 3 Photometric uncertainties of the NACO Ks and L′ observations of the Quintuplet cluster for Fields 1 through 5 (top to bottom). The left panels show the first epoch and the middle panels the second epoch Ks uncertainties for the two epochs from which proper motions were derived. The Ks photometry in Field 1 was combined from short and long exposures, with a saturation transition at Ks = 14 mag. The transition is marked by the prominent improvement in photometric performance in the long exposure data. L′ photometric uncertainties (right panels) indicate the large differences in performance in the L′ observations due to thermal background variations. While Fields 2, 3, and 5 show comparable sensitivities, Field 4 is compromised by background fluctuations. Field 1 features significantly deeper photometry, such that the L′ selection was truncated at L′< 15 mag to obtain the excess fraction consistently across the entire cluster area. |
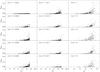 |
Fig. 4 Photometric uncertainties of the NACO Ks and L′ observations of the Arches cluster for Fields 1 through 5 (top to bottom). The left panels show the first epoch and the middle panels the second epoch Ks uncertainty for the two epochs from which proper motions were derived. The photometric uncertainties of the first epoch are daophot PSF fitting uncertainties, and are not derived from multiple measurements. As in the case of the Quintuplet cluster, L′ photometric uncertainties (right panels) indicate the differences in performance in the L′ observations due to thermal background variations. The sensitivity limits show more consistency than in the Quintuplet, with a detection threshold of L′ ~ 14.5−15.0 mag. The larger scatter in Fields 3 and 5 is caused by background fluctuations. |
3.1.4. Geometric transformations
For both the Arches and Quintuplet clusters, we derived membership information for all fields out to a radius of ~1.5 pc. For this purpose, we have combined at least two epochs of Ks NACO observations to construct the proper motion diagram for each cluster and field.
Proper motions are derived via the matching of two epochs of imaging observations separated by a time baseline of 3 to 5 years. The positions of each star have to be transformed to one epoch that serves as the reference epoch for the respective field. The geometric transformation between both epochs was derived for bright stars with Ks< 17.5 mag. The IRAF task geomap provided residual rotation, image shifts, and relative distortions by fitting a second-order polynomial to the x and y positional differences for all stars in each field. In general, the earlier epochs provided deeper images with a higher spatial resolution as a result of the degradation in adaptive optics performance of the NAOS system over time. Hence, the first epoch was used as the reference epoch in all cases, and the positions measured in later epoch images were converted to the first epoch using the geomap geometric solutions. After a first transformation, cluster candidate stars were selected from the proper motion plane as stars located close to the origin in the cluster reference frame (i.e. with zero relative motion with respect to the mean cluster motion). These cluster member candidates were iteratively used to generate the final geometric transformation solution. This procedure ensures that the mix between rapidly moving field stars and slowly moving cluster members with respect to the cluster reference frame does not bias the transformation. It should be noted that the method implies minimisation of the relative motions between cluster stars, such that the cluster population appears more confined after the second iteration, which improves the distinction between cluster members and field stars. The uncertainties in the proper motion measurements include the individual positional uncertainties in x or y of each star as described above, added in quadrature to the residual rms uncertainties of the geometric transformation.
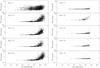 |
Fig. 5 Proper motion uncertainties of stars in the Quintuplet (left) and Arches (right) clusters for Fields 1 through 5 (top to bottom) in each cluster. The proper motion uncertainties include the astrometric uncertainties from each individual epoch in addition to the standard deviation in the geometric transformation from epoch 2 to epoch 1. The deeper Ks observations in the central Quintuplet field provide good astrometric accuracies down to Ks ~ 19 mag, while Fields 2–5 are truncated at Ks = 17.5 mag (dashed lines), beyond which astrometric accuracies degrade. The wide spread in Quintuplet Field 1 is caused by crowding. For the purposes of membership derivation, only sources with Ks< 18 mag (dashed line) are used in Field 1 for compatibility with the outer fields. In most Arches fields (right panels), the astrometric accuracies are small down to Ks ~ 18 mag, with the exception of Field 2, where proper motion derivations are limited to Ks< 17 mag. |
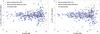 |
Fig. 6 Comparison of proper motion values derived in our 2010 disc paper of the central Arches field and in this study. Differences in the proper motion are shown individually in the right ascension (left) and declination (right) directions. The consistency between the blue and red samples reveals the similarity between the membership selection used to derive the central disc fraction in Stolte et al. (2010, red asterisks) and in this work (blue diamonds). Non-members are shown as black dots. The majority of stars in the common sample shows proper motion differences below 0.5 mas/yr, almost identical to the relative astrometric uncertainties in Arches Field 1 shown in Fig. 5. Faint stars (Ks< 16 mag) show larger motion differences, as expected from their higher astrometric uncertainties. |
The proper motion uncertainties are shown in Fig. 5. A distinct increase in the median uncertainty can be seen in all data sets towards fainter magnitudes, as expected. As the limit where reliable membership measurements can be obtained depends on the data set, we adopt limiting magnitudes of Ks< 17.5 in all outer Quintuplet fields and Ks< 18 mag in the Quintuplet central field, where both Ks epochs are equally deep, as indicated in Fig. 5. In the central field, we also include in the source catalogue an indication of membership for fainter stars, in which case we mark the membership information as uncertain. In contrast to Hußmann et al. (2012), the source catalogue of the central field (Field 1, F1) in the search for disc candidates presented here includes the full 40′′ × 40′′ dithered field of view.
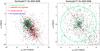 |
Fig. 7 Proper motion diagram of the central field of the Quintuplet cluster. The circle around the origin indicates the selection of cluster members. L-band detected proper motion members are shown in green, while non-members are shown in red. Black sources are not detected in L′. Those sources are cluster members if located inside the green circle. L′ excess sources are marked as red diamonds, while Wolf-Rayet candidates are shown in blue (see Sect. 4.1). The right panel displays a zoom on the cluster selection and the median astrometric uncertainty for L-band detected members in the lower left corner. |
A realistic estimate of the uncertainties in the proper motion measurement of each star can also be obtained from the comparison of the derived proper motion values with our earlier NACO-NIRC2 member selection in the Arches cluster (Stolte et al. 2010). Substantial differences between the motion samples might introduce uncertainties in the main-sequence member selection, and hence in the disc fractions.
In Fig. 6, the astrometry presented here is compared to our earlier results obtained with Keck/NIRC2 and VLT/NACO over a time baseline of 4 to 5 years (Stolte et al. 2010). Proper motions in Stolte et al. (2010) were derived from Keck/NIRC2 astrometry with respect to the NACO 2002 central field also used as reference for Field 1 in this study. The area that could be matched covers the central 13′′ of the cluster, and is dominated by the crowding-limited cluster core. The characteristic deviations in proper motions both in the right ascension and declination directions are ± 0.5 mas/yr for the majority of cluster members. This uncertainty is very similar to the absolute motion uncertainties in Arches Field 1 as derived from multiple astrometric measurements (Fig. 5, top right panel), suggesting that the repeated PSF fitting on the shallower auxiliary subsets yields realistic motion uncertainties. The relatively large differences originate from the fact that all earlier observations with Keck/NIRC2 and VLT/NACO were taken under excellent conditions, resulting in higher spatial resolutions of 60–80 mas, closer to the Keck and VLT diffraction limits than the more recent VLT data sets covering the full cluster area presented here. The comparison is restricted to the area of the earlier data sets in the cluster centre, and hence proper motion deviations are induced by crowding. No systematic bias is observed in both proper motion directions, confirming the robustness of our transformation method.
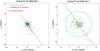 |
Fig. 8 Proper motion diagram of the central field of the Arches cluster. The circle denotes the selection limit for cluster members. Members with L′ detections are highlighted in green, while L′-detected non-members are shown in red. As already found in Stolte et al. (2010), all excess sources recovered in the cluster centre are proper motion members of the Arches. The right panel displays a zoom on the cluster selection and the median astrometric uncertainty for L-band detected members in the lower left corner. |
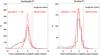 |
Fig. 9 Proper motion histogram of stars in the central fields of the Quintuplet (left) and Arches (right) clusters. The motion parallel to the Galactic plane (black) shows a pronounced tail of field sources, as indicated in the proper motion diagram (Figs. 7 and 8), while the motion perpendicular to the plane (red histograms) is dominated by the velocity dispersion. The Gaussian fit to the latitude motion (red solid lines) in Field 1 provides the 3σ criterion for selecting cluster members in both central fields. In the case of the Arches cluster, the same membership criterion is imposed in all outer fields. |
As can be seen from Fig. 6, the membership selection is barely affected by the proper motion uncertainties. Stars previously selected as cluster members in Stolte et al. (2010) are shown as red asterisks, while stars selected as members in the new NACO data set are shown as blue diamonds. Out of 442 stars matched between both samples, 309 were chosen to be members from the NIRC2-NACO astrometry, and 332 are chosen to be members from the NACO-NACO astrometry presented here, with 299 stars being common members in both samples. Only ten stars chosen as members in our previous study are not recovered as members here, and six of these have substantial proper motion deviations, suggesting that their motions are uncertain. An additional 33 stars are detected as members in this work, probably because the rms scatter in the motion plot is larger and the corresponding member selection needs to be wider than chosen before (1.50 mas/yr as compared to 1.30 mas/yr in Stolte et al. 2010). Hence, a total of 43 stars or 10% of the comparison sample have deviating membership designations, which represents the uncertainty in the derived main-sequence reference samples due to the proper motion membership selection alone.
As a consequence of the field size limitations in our earlier observations, this comparison only covers the crowding-limited cluster core. We expect less deviation in the individual motions for stars at larger radii, including both stars in the outer fields of the Arches cluster as well as in the Quintuplet cluster where stellar densities are lower. Therefore, a maximum deviation in the main-sequence number count of 10% is expected in the Arches cluster core, while the deviation will be even smaller for all other main-sequence reference samples.
3.2. Membership derivation
The resulting proper motion diagrams of the central Quintuplet and Arches fields are presented in Figs. 7 and 8, while the outer fields are presented in Figs. A.1 and A.2. A confined cluster population is observed at the origin, as expected after transforming to the cluster reference frame. The field star population is elongated along the orientation of the Galactic plane (dashed line in Fig. 7), indicative of a wide range of orbital parameters for field stars in the GC (see also Stolte et al. 2008 for a discussion). The histograms of motion in the Galactic longitude and latitude directions are shown in Fig. 9 for the central Arches and Quintuplet fields. The peak of cluster member candidates (hereafter cluster members) stands out clearly in longitudal motion (motion along the plane), followed by the extended tail of field stars. In the latitude direction, the peak is dominated by the positional uncertainties. The Gaussian fits of the latitudinal motion in the central fields provides the 2σ selection criterion for cluster members. As the outer fields of the Arches cluster are dominated by field stars, the cluster peak is not pronounced and the same selection criterion as for the central Arches field is used (μ< 1.5 mas/yr). For the Quintuplet outer fields, Fields 2 to 5, membership probabilities are available from our mass function campaign (Hußmann 2014). In these fields exclusively, we use the membership probabilities to discern cluster members from field stars (see Hußmann 2014 for details).
There is one major difference in the derivation of membership probabilities compared to earlier membership studies in nearby clusters. The combination of the large cluster distance and the small time baseline did not allow the use of the classical membership likelihood as the cluster member selection criterion. Instead, the criterion for a star to be considered a cluster member was constrained using Monte Carlo simulations of the distribution of field and cluster stars in the proper motion plane (see Sects. 4.2.2.1 to 4.2.2.3 in Hußmann 2014 for details). In these models, two artificial Gaussian distributions were populated with stars to represent the cluster and the field, respectively. The properties of these distributions were modelled after the observed proper motion measurements. Each artificial star was assigned a proper motion uncertainty drawn randomly from the observed distribution of astrometric errors, and as in the real observational data, these uncertainties were used to weight the probability for each star to belong to the cluster or the field. The simulated cluster and field distributions were then fitted with an expectation-maximisation algorithm as described in Hußmann (2014). For these simulated cluster/field distributions, the recovery fractions of cluster stars were compared to the inserted number of simulated cluster stars. Because of the overlap between the cluster and field ellipses, the distinction cannot be perfectly made. A trade-off probability value was derived for which the maximum number of cluster stars is recovered, while the minimum number of field interlopers contaminates the sample. This probability represents the likelihood of finding each star at a certain location in the proper motion plane, and is weighted by each star’s respective proper motion uncertainty (Eq. (4.11) in Hußmann 2014). These membership indicators are included in Table E.1 for reference. Extensive simulations of Field 2, which has the largest number of cluster stars outside the central field and hence facilitates statistical modelling, suggested that cluster stars are most efficiently separated from field stars using a formal probability threshold of 0.4. Stars above this threshold are likely cluster members, while stars below this limit are likely field stars.
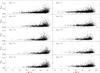 |
Fig. 10 Photometric uncertainties of the WFC3 J and H photometry for each Quintuplet field after matching with NACO Ks. The apparent differences in the detection limits reflect the different Ks sensitivities of the first epoch NACO observations. |
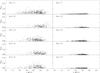 |
Fig. 11 Photometric uncertainties of the WFC3 J and H photometry for each Arches field after matching with NACO Ks. The apparent differences in the detection limits reflect the different Ks sensitivities of the NACO observations in each field which determine the depth of the J,J − Ks CMDs. |
As will be discussed further below, neither the 2σ membership selection nor the probability method allow a perfect distinction between cluster and field stars. Some stars will unavoidably move on orbits similar to the cluster motion, even if their motions are extreme compared to circular orbits of stars and clouds in the inner bulge (Stolte et al. 2008). Some of these stars will be bulge stars with elongated or high-velocity orbits located at a similar distance as the clusters. This population is dominated by bulge giants and red clump stars and has the red colours of evolved stars with substantial extinction. In addition, a number of foreground stars move on characteristic Galactic disc orbits with lateral velocities in the range of ~200 km s-1 along the Galactic centre line of sight, similar to the cluster orbital velocity (Stolte et al. 2008; Clarkson et al. 2012). Galactic disc stars significantly nearer to the Sun can be discriminated from cluster stars as their proper motion will appear larger than the cluster velocities. However, Galactic disc stars at larger distances are not easily distinguished on the basis of their proper motion alone. The Galactic disc population is concentrated along the spiral arms, and is predominantly composed of main-sequence stars with blue colours and a lower foreground extinction. Both the bulge and Galactic disc contaminants are distinct in the colour–magnitude diagram on the basis of their colours, which are different from the reddened cluster main sequence. The colour information therefore provides an additional tool with which to improve the membership selection and obtain an almost genuine cluster member sample, and will be employed to derive the main-sequence reference samples for the disc fractions in Sects. 4.1 and 4.2.
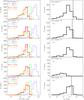 |
Fig. 12 Quintuplet luminosity functions of all filters (left: JHKs, right: L′). All JHKs luminosity functions are shown for the combined sample used for the main-sequence source counts. These luminosity functions therefore indicate the limitations of the source counts in the final JHKs and JHKsL′ catalogues relevant for the main-sequence and excess samples here, and not the true detection limits in each filter. The Ks luminosity functions are shown for both proper motion epochs used for membership derivation. Likewise, the L′ luminosity functions are derived from the matched JHKsL′ source lists used for further analysis. The dashed line in the L′ luminosity function in Field 1 indicates the truncation imposed when combining F1 with the outer fields. The dashed lines in the L′ luminosity functions in Fields 2 and 5 indicate the faintest L-excess source in each field. Except for Field 4, all L′ data sets extend towards or beyond a sensitivity of L′ = 15.0 mag. |
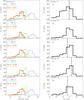 |
Fig. 13 Arches luminosity functions of all filters (left: JHKs, right: L′). The Ks luminosity functions are shown for both proper motion epochs used for membership derivation. The detection limits in the WFC3 JH observations are comparable to those obtained in the Quintuplet, yet the absolute number of sources matched with Ks is limited by the shallower Arches NACO photometry caused by the fainter guide stars and required adaptive optics observing mode. The dashed lines in the L′ luminosity functions indicate the faintest L′-excess source in each field. In Arches Field 2, no cluster member with circumstellar disc emission is detected. All L′ data sets show a sensitivity limit close to L′ = 15.0 mag, fainter than the faintest detected excess source in each field. |
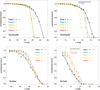 |
Fig. 14 Incompleteness fractions and fitted polynomials for the main-sequence reference samples (left panels) are shown vs. the J-band magnitude. Artificial stars were matched in JHKs prior to the derivation of the displayed completeness fractions. For the excess source populations (right panels), incompleteness fractions and fits are shown vs. the L′-band magnitude for all artificial stars recovered in JHKs and L′ simultaneously. The top panels show the completeness fractions in the Quintuplet cluster, while the bottom panels refer to the Arches observations. Thick bars in the top of the L-band panels represent the range of L′ magnitudes observed in the excess sources in each field. |
3.3. HST/WFC3
As adaptive optics observations suffer from marginal adaptive optics corrections at shorter wavelengths, we employed the WFC3 J and H images to derive JHKs photometry of each source. In the case of the HST/WFC3 observations, either the pre-reduced images (Quintuplet) or the combined drizzled image (Arches) were downloaded from the HST MAST archive. The drizzled images provided the basis for the photometric analysis. The observational properties are summarised in Table 3.
3.4. Photometry
After applying the most recent distortion solution, starfinder PSF fitting with a constant, empirically extracted PSF across the field was applied to the Quintuplet images. For the Arches, the reduced JH images were, at the time of processing, not optimised for astrometry, and daophot photometry with a quadratically varying penny or moffat function provided the lowest photometric residuals, and was hence used on both the J and H images.
Photometric uncertainties were established for all datasets as described above. Auxiliary images were either created or consecutive data sets were used to obtain independent measurements, and the PSF fitting was repeated in the same way as for the deep drizzled images. As in the case of the NACO data, the uncertainties were calculated as the standard error or the deviation from the mean (Figs. 10 and 11).
The JH photometry lists were combined into a single catalogue, which was calibrated with respect to UKIDSS (Lawrence et al. 2007). The UKIDSS resolution of 1′′ implies an improvement of a factor of two compared to the 2MASS catalogues, which is particularly crucial in these crowding-limited cluster fields. We used a version of data release 6 (DR6) of the UKIDSS Galactic Plane Survey (GPS, Lucas et al. 2008), which we corrected with respect to 2MASS for foreground extinction effects (see also Hodgkin et al. 2009 for details on the UKIDSS calibration). This correction proved necessary in the GC fields, as the automatic pipeline zeropointing is based on Schlegel maps (Schlegel et al. 1998), which suffer from low resolution and provide extinction values that are a factor of 3 too high in the GC region. Only sources detected in both J and H are included in the final catalogue to allow for colour term correction. Colour terms were derived directly with respect to the corrected UKIDSS catalogue in the case of the Arches cluster. As in the case of the Quintuplet Ks calibration (Sect. 3.1.2), the Quintuplet WFC3 photometry was calibrated with respect to ISAAC JsHKs photometry, and the colour terms were derived accordingly. The ISAAC photometry was calibrated over the full ISAAC field of view of 2.5 arcmin with respect to UKIDSS, which facilitated the selection of isolated calibration stars. The NACO photometry was then calibrated in a second step with respect to this ISAAC photometry (see also Hußmann (2014) for details).
The colour conversions are derived to be  in the Quintuplet field with respect to ISAAC JsH, and to be
  in the Arches field with respect to UKIDSS \begin{lxirformule}$JH$\end{lxirformule}. The colour terms of the WFC3 F127M and F153M filters found with respect to the ground-based ISAAC and UKIDSS JH filters are consistent within their uncertainties. In the Quintuplet field, because of the different calibration procedures, the offset term was not fit independently of the instrumental zeropoints ZPTJ,WFC3 = 1.31 ± 0.06 and ZPTH,WFC3 = 1.96 ± 0.07, such that they are not directly comparable to the absolute offsets derived in the Arches field after a preliminary calibration offset had been applied. After colour terms were removed, the Arches JH photometry was adjusted to match the photometry by Espinoza et al. (2009) in the cluster centre, as in the case of the Ks observations (Sect. 3.1.2).
Finally, the combined JH WFC3 catalogue with calibrated, colour-term corrected magnitudes was transformed to each Ks reference epoch image and matched with the Ks and KsL′ photometry lists separately. Source counts and sensitivity limits for these combined catalogues are provided in Table 2. The sensitivity limits are derived from the peak of the luminosity functions (Figs. 12 and 13) as a first indication of the completeness of each data set in each filter after matching JH with Ks, and L′ with JHKs in the case of the L′ luminosity function exclusively. A rigorous incompleteness treatment, including the effects of catalogue matching, is presented in the next section.
3.5. Incompleteness simulations
There are two major limitations to the sample of excess sources and detected main-sequence members of the Arches and Quintuplet clusters. Stars with main-sequence colours are mostly limited by detection in the bluest filter, WFC3 J. This limitation arises from the high foreground extinction towards both clusters and the GC in general. In addition, the lower resolution of HST/WFC3 of 220 mas compared to the NACO Ks-band resolution of typically 80–120 mas (see Table 1) prohibited the detection of J and H counterparts for Ks sources in areas with high stellar densities. Especially in the crowding-limited core of the Arches cluster, the loss of one neighbour in close pairs is common. Sources with L-band excess, on the other hand, are additionally limited by the L-band completeness limit at L′ ~ 14.5 mag. As all L-band sources are also matched with the JH source list to reveal the excess in the two-colour plane, the detection of excess sources is limited by the constraints in both J and L.
With the aim of quantifying the losses and deriving completeness-corrected disc fractions, we have performed artificial star experiments. For both clusters, artificial stars were inserted in the WFC3 J and H images, and photometry was performed with starfinder (Quintuplet) or daophot (Arches) as on the original images. The J and H catalogues of recovered artificial stars were matched to account for matching losses. For the NACO KS epochs, the less sensitive and hence more limiting proper motion epoch was used to derive recovery fractions. Artificial stars were inserted in the same physical location in each filter. The magnitudes and colours of each artificial star were chosen to represent a typical main-sequence star in each field, with a range of 4.2 <J − Ks< 4.8 mag in the Quintuplet and 4.3 <J − Ks< 6.2 mag in the Arches. The Ks − L′ colour was chosen to be 2.4 mag in the Quintuplet and 2.5 mag in the Arches for all excess source simulations, in accordance with the observed characteristic colour of the excess sources in each cluster. As for the real photometry, the Ks and JH artificial source lists were combined with the same matching parameters. In the real source lists, a limit of Ks< 17.5 mag was imposed to allow for proper motion member selection, and the same selection limit is applied for the calculation of all completeness fractions. The JHKs artificial star lists are employed to calculate the completeness fraction of main-sequence stars. The JHKs catalogues are then combined with the L′ artificial star lists to derive the completeness fraction of the excess samples.
The JH images are mainly limited by crowding effects, as WFC3 provides uniform photometric performance across the field. The NACO Ks and L′ epochs and fields, on the other hand, are influenced by the adaptive optics correction (Strehl ratio, sensitivity, and anisoplanatism) as well as fluctuations in the thermal background especially in L′. These effects cause each field to display different completeness curves. In Fig. 14, the completeness fractions are fitted with fourth-order polynomials. In the Quintuplet simulations, the drop in completeness with fainter magnitudes is significantly steeper than in the more crowding-limited Arches simulations. Two separate polynomials were fitted in the shallow parts of the incompleteness curves at brighter magnitudes and the steep parts of the curves towards faint magnitudes in the Quintuplet simulations. Polynomial fitting provides the advantage that a completeness correction can be calculated for each star’s observed magnitude without binning into magnitude bins. The completeness-corrected star counts are used in Sects. 4.1 and 4.2 to obtain corrected excess samples and main-sequence reference samples in each field.
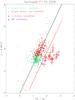 |
Fig. 15 J − H,Ks − L′ colour–colour diagram of the central field of the Quintuplet cluster. The solid black line depicts the extinction vector (Nishiyama et al. 2009), and the red line is offset by 3 × the standard deviation of main-sequence cluster members without excess sources (green points). All L′ excess candidates are labelled (diamonds), with Wolf-Rayet candidates shown in blue (Ks< 12 mag), while fainter excess sources marked in red are candidates for circumstellar disc emission. Non-cluster members are shown in red, and black symbols depict sources with unknown membership status. The J − H,Ks − L′ colour–colour diagrams of the outer fields can be found in Appendix (B.1). |
4. Results
4.1. Disc candidates in the Quintuplet cluster
A robust estimate of the cluster disc fraction, especially at cluster ages above 1–2 Myr, can be obtained from the fraction of L-band excess sources with respect to the main-sequence reference sample (Haisch et al. 2001). To derive L-band excess fractions in each field and in the entire cluster, we combine the L′ photometry with the JHKs source lists. The J − H,Ks − L′ colour–colour diagram of the central Quintuplet field is presented in Fig. 15, while the outer fields are included in the Appendix (Fig. B.1). Excess candidates are selected if their colours are redder than 3σ with respect to the reddening vector, where σ is calculated as the standard deviation of the Ks − L′ colour of all cluster members with Ks< 17.5 mag. In the central field, the deeper sensitivity allowed for a member selection down to stars with Ks ~ 20 mag, such that only a proper motion accuracy limit was imposed in Field 1 exclusively. As Wolf-Rayet stars also display infrared excesses due to their strong envelope emission, only stars fainter than Ks> 12 mag are considered to be disc candidates. The WR candidates are shown in blue in all colour–colour and colour–magnitude diagrams. The astrometric accuracy of these sources is frequently compromised by non-linearity in the PSF core, limiting the value of the membership criterion, yet they display colours and brightnesses consistent with Wolf-Rayet stars belonging to the Quintuplet population (see Figs. 16 and 17). Although the combined JHKsL′ catalogue contains the most reliable photometric sources, not all sources measured in all four filters have proper motion membership information. A few sources are too faint in the less sensitive second epoch observations or happen to fall close to equally bright or brighter neighbours, such that the astrometric uncertainties are too large for these sources to derive membership information (black sources in the colour–colour diagrams). In most Quintuplet fields, there is characteristically one non-cluster member in the excess sample, and one source where the membership situation is unclear (see Figs. 15 and B.1). This is particularly striking in Field 3, where no cluster member excess source is found, yet one source without membership and one non-member show L′ excess emission. A similar situation is observed in Fields 1 and 5, while all excess sources observed in Field 2 are cluster members. Only one faint excess source is observed in Field 4 owing to the shallow sensitivity of the L′ photometry in this field. The formally derived low excess fraction in Field 4 is therefore not representative for the remainder of the cluster. With just two epochs of proper motion measurements, the motion of each star has to be derived as the difference in the positions between both epochs, and no linear fit to the motion can be obtained. Likewise, the likelihood that each star belongs to the cluster or the field does not provide an absolute distinction between cluster members and non-members. More accurate motions, obtained from multiple proper motion epochs, are required to definitively conclude whether the apparent non-member excess sources might belong to the cluster as well. It is therefore too early to discuss their possible origin and the nature of their excess, and we exclude them from the member sample in the following analysis.
L-band excess sources in the Quintuplet cluster.
L′ excess fractions in the Quintuplet cluster.
A total of 24 cluster members with L′ excess emission is found distributed across three of the Quintuplet fields (Figs. 1 and 2). Two sources are detected in the overlap regions of two fields, providing independent confirmations of their Ks − L′ excesses. Two additional excess sources do not have membership information, such that a maximum of 26 excess sources is currently observed in the Quintuplet cluster. The positions and photometry of these sources are provided in Table 4, and a summary of the observed number counts is included in Table 5. Most L-band excess sources in the Quintuplet are detected in the central field, at radii r< 1 pc from the cluster centre. The central field harbours 16 excess sources with J< 22.0 mag, while a total of 18 excess members plus one star with unknown membership are detected down to J = 22.8 mag. In contrast to the central field, the outer fields only feature between 0 and 4 members with L′ excess, which suggests that the outer regions of the Quintuplet cluster harbour very few disc candidates. The limiting factor in the detection of L-band excess sources is the L′ sensitivity itself. The strong thermal background emission at 3.8 μm, which is a combination of sky brightness and dust emission from optical elements such as telescope mirrors, leads to substantial noise in each L-band image. In the outer fields, all detected L′ excess sources are brighter than L′ = 15.0 mag. All L-band excess sources are included in the source catalogue, yet for the derivation of the global excess fraction, only sources brighter than L = 15.0 mag and J = 22.0 mag are considered.
In order to derive the L-band excess fraction and hence the potential fraction of circumstellar discs in the Quintuplet cluster, a main-sequence reference sample has to be defined. This sample has to contain membership information to distinguish cluster stars from field interlopers, and it has to cover the colour range expected for main-sequence sources belonging to the Quintuplet. A problem arises from the fact that disc sources are easier to detect in L′ than main-sequence stars because of their infrared brightness enhancement. Hence, the JHKs source lists are used to derive the reference sample instead of the JHKsL′ combined catalogue (see Stolte et al. 2010). We use the J-band brightness as an indicator of the stellar photospheric luminosity and the stellar mass, as the excess from circumstellar disc emission is expected to be weak at bluer wavelengths. The limiting J-band magnitude in the excess sample can therefore be used to define the main-sequence reference sample in each field. The J,J − Ks colour–magnitude diagrams (Figs. 16 and B.3) reveal that almost all disc candidates with L′< 15 mag are brighter than J = 22.0 mag, and only three sources between 22.0 <J< 22.8 mag are found in the central field. The deeper member/non-member distinction in this field allowed us to include these sources, imposing the same L′< 15 mag limit as in the outer fields, in the full sample of disc candidates. The main sequence was selected down to J = 22.8 mag accordingly. The characteristic main-sequence colour of J − Ks ~ 4.5 mag implies that a limiting magnitude of Ks = 17.5 mag used for the membership samples in the outer fields corresponds to J = 22.0 mag as well. We therefore use J = 22.0 mag as the faint limit to define the main-sequence samples in all outer fields.
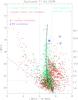 |
Fig. 16 J, J − Ks colour–magnitude diagram of the central field of the Quintuplet cluster. L′-excess sources derived from Fig. 15 are marked as red diamonds, while Wolf-Rayet candidates are marked in blue. Proper motion members are shown in green, while non-members are shown in red and sources with unknown membership in black. The imposed magnitude limit to allow for proper-motion member selection, Ks< 17.5 mag, is shown as a dotted line. The horizontal dashed line marks the J-band completeness limit at J = 22 mag above which the combined cluster excess fraction was derived. The vertical dashed lines indicate the main-sequence colour selection applied in addition to the proper motion membership criterion to select the main-sequence reference sample to calculate the disc fraction. The J, J − Ks colour–magnitude diagrams of the outer fields can be found in Appendix (B.3). |
The membership source lists derived from proper motions cannot exclude blue disc stars or red bulge giants which happen to move with velocities similar to the clusters (see Hußmann et al. 2012 for a detailed discussion). Hence, we apply an additional colour selection to remove these contaminants. While the blue limit of the cluster main sequence stands out clearly in the CMDs, the red limit of the cluster population is more difficult to discern. The red limit was determined from the red clump population evident in each CMD at J ~ 20 mag, and progressing towards redder colours and fainter magnitudes along a distinctive path (the reddening vector). The red limit is chosen such that the cluster main sequence is completely included in the selection while red clump stars are rejected as efficiently as possible. As a consequence of the varying extinction across the Quintuplet cluster field, the colour selection had to be adapted to the main-sequence colour spread observed in each CMD. The colour selections for main-sequence stars are included in Table 5, and are shown in Figs. 16 and B.3 as dashed vertical lines. In summary, the following constraints define the main-sequence reference samples: i) J< 22.0 mag; ii) 3.7 − 4.0 <J − Ks< 4.5 − 5.5 mag (see Table 5), and iii) source is a proper motion member. To estimate the unavoidable biases imposed by the main-sequence colour selection, the red boundary was shifted by ± 0.2 mag to derive upper and lower limits of the excess fractions in each field individually. These uncertainties are included in Table 5. Both the main-sequence samples and the excess source counts are corrected for incompleteness using individual completeness values for each star as outlined in Sect. 3.5. In Table 5, we include the observed and incompleteness corrected disc fractions for each field. In the two bottom rows, the cluster disc fractions are calculated from the full area coverage of all fields. Table 5 also provides a lower and an upper limit on the true excess fraction, fex = nex/nms, where nex is the number of excess sources and nms the number of stars in the main-sequence reference sample. The upper limit originates from including each of the three fields with excess source populations. Here, the main-sequence reference samples are derived from Fields 1, 2, and 5 exclusively, and fex is correspondingly large as a result of the small main-sequence number count nms. A lower limit to the total disc fraction is derived when including all fields in the main-sequence reference sample. In this case, Fields 3 and 4, which feature 0 and 1 excess cluster members with Ks> 12 mag, are also included, such that the cluster main-sequence population can be considered more complete. The real situation is slightly more difficult to assess, as the varying extinction particularly affects the detection of faint cluster stars in Field 4, where the L-band sensitivity is also compromised. Here, the maximum number of presently known Quintuplet members is used as the main-sequence reference sample, increasing nms and minimising fex. For the combined excess fraction in the Quintuplet cluster, a J-band limit of 22 mag is imposed in all fields (F1-F5) on the main-sequence reference samples.
The values for all fields and all main-sequence reference samples are in the range 3–5% (again with the exception of Field 4). Combining all excess source members, we find an upper limit to the incompleteness-corrected excess fraction of 4.1% and a lower limit of 3.7% for the full cluster area. Including the three excess sources without membership information in the excess number count increases the upper limit to 4.3%. Employing these upper and lower limits as uncertainties, we conclude that the excess fraction in the Quintuplet cluster at its present age of 4 Myr is 4.0 ± 0.3%.
Although the Quintuplet cluster has a lower density than the core of the Arches cluster, a maximum uncertainty in the disc fraction can be derived by assuming the same 10% membership selection uncertainty as found in the Arches core (Sect. 3.1.4). A number count error of ± 10% in either the Field 1+2+5 main-sequence sample or in the full main-sequence sample changes the respective combined excess fraction by ± 0.4%. If we additionally assume the propagated uncertainty in incompleteness-corrected number counts is 10% as well, the corresponding uncertainty in the corrected disc fraction is found to be ± 0.5%. Taking into account the uncertainty imposed by the colour selection (the higher value of σfex,low and σfex,high in Table 5), and assuming that both uncertainties are independent, the disc fraction in the Quintuplet cluster is found to be 4.0 ± 0.7%.
The stellar masses of the host stars of these circumstellar disc candidates can be estimated from their J-band brightness, which is presumed to represent the stellar photosphere. This assumption is validated by the fact that most of our sample sources show little to no near-IR excess emission in the 2.2 μm Ks band. The mean extinction towards each field was assumed in the conversion of J-band magnitudes into stellar masses. Our imposed J-band limit of 22.0 mag corresponds to a lower mass limit of 2.2 M⊙ for both a 4 and 5 Myr Geneva main-sequence isochrone (Lejeune & Schaerer 2001). The brightest source with mid-infrared excess emission has J = 19.6 mag, which corresponds to a stellar mass of 14.2 M⊙ for the 4 Myr isochrone. Effective temperatures covered by these stellar masses in the Geneva models range from 10 500 to 29 300 K. Following the recent compilation of Currie et al. 2010 (see their Table 7) for main-sequence stars with solar metallicity, these temperatures suggest that the disc candidates in the Quintuplet cluster are found around B9.5V to B0V stars.
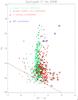 |
Fig. 17 Ks, Ks − L′ colour–magnitude diagram of the Quintuplet cluster centre. All sources are labelled as in Fig. 16. One faint L′ detection has no membership information, but is consistent with the remainder of the excess sources regarding its Ks − L′ colour. The Ks, Ks − L′ colour–magnitude diagrams of the outer fields can be found in Appendix (B.5) |
 |
Fig. 18 J − H,Ks − L′ colour–colour diagram of the central field of the Arches cluster. The solid black line depicts the extinction vector (Nishiyama et al. 2009), and the red line is offset by 3 × the standard deviation of main-sequence cluster members (green points) without excess sources. Excess sources fainter than Ks = 12 mag marked as red diamonds are candidates for circumstellar disc emission. Non-cluster members are shown in red; black symbols depict sources with unknown membership status. As many of the excess sources in the cluster centre are located close to brighter stars because of the high stellar density in the cluster core, only 7 of the 23 L-band excess sources found in our Keck investigation (Stolte et al. 2010) are detected in the lower-resolution NACO images (green asterisks). At larger radii, the fraction of excess sources is expected to be more complete owing to the less severe crowding effects. The J − H,Ks − L′ colour–colour diagrams of the outer fields can be found in Appendix (B.2). |
Currently, it is unclear whether the fraction of excess sources increases towards lower-mass stars; the sample statistics are not sufficient to provide excess fractions in various mass bins. From these data alone, we can therefore not conclude that stars with lower or higher masses are more likely to exhibit L-band excess emission. Given the UV-intense environment of this massive cluster, one might not expect to find disc candidates at an age of 4 Myr at all. The implications of this finding and possible explanations for an elevated disc fraction, especially in a more evolved, massive young cluster, are discussed in Sect. 5.
Despite the large range of radial distances from the cluster centre covered by the different pointings, the excess fractions derived individually for Fields 1, 2, and 5 are identical within their uncertainties. Hence, we find no indication for a radial variation of the disc fraction in the Quintuplet cluster. This finding contrasts with our earlier detection of a significant variation in the disc fraction of the Arches cluster, where a radial increase from 3% to 10% was observed (Stolte et al. 2010). The radial variation in the Arches cluster might be caused by disc destruction in the dense cluster core, where UV radiation from neighbouring sources and dynamic interactions could affect disc survival (Olczak et al. 2012). These disc destruction mechanisms might not be effective at the lower central density of the Quintuplet cluster, such that disc sources are equally distributed at all radii. Alternatively, the generally lower disc fractions in the Quintuplet cluster of ~4% might mask the radial dependence, as radial variations of ± 0.5% would remain undetected given the main-sequence selection uncertainties. We therefore conclude that, within these uncertainties, the disc fraction in the Quintuplet cluster shows no radial variation.
L-band excess sources in the Arches cluster.
L′ excess fractions in the Arches cluster.
4.2. Disc candidates in the Arches cluster
In the Arches cluster, a total of 28 candidates with 3σL′ excess emission is found, of which 20 are proper motion members of the cluster, 6 are non-members, and for 2 excess sources in the central field the membership is unknown (Figs. 18 and B.2). Three excess sources detected at the edge of Field 5 are also observed in either Field 1 or Field 3. Among the proper motion members, one excess source qualifies as a Wolf-Rayet candidate with Ks = 11.2 mag and is excluded from the final disc sample. The sample of circumstellar disc candidates identified as likely cluster members therefore contains 19 sources (21 including the two sources with unknown membership). The excess source list can be found in Table 6, and the number counts in each field are summarised in Table 7. As in the Quintuplet sample selection, the main-sequence reference sample was chosen around cluster members with characteristic main-sequence colours given the extinction in each field (see Figs. 19 and B.4 and Table 7). Given the similarity in the J-band photometries and the main-sequence colour range, a limiting magnitude of J< 22 mag is applied to obtain a complete main-sequence sample. In the Arches, there are two sources in the central Field 1 and one source in Field 5 with J> 22 mag, yet the majority of excess sources are significantly brighter than this limit (Figs. 19 and B.4).
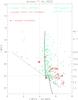 |
Fig. 19 J, J − Ks colour–magnitude diagram of the central field of the Arches cluster. L′-excess sources derived from Fig. 18 are marked as red diamonds. Proper motion members are shown in green, non-members are shown in red, and sources with unknown membership in black. The imposed magnitude limit to allow for proper-motion member selection, Ks< 17.5 mag, is shown as the dotted line. The horizontal dashed line marks the J-band completeness limit at J = 22 mag above which the combined cluster excess fraction was derived. The dashed vertical lines indicate the main-sequence colour selection applied in addition to the proper motion membership criterion to select the main-sequence reference sample to calculate the excess fraction. The location of the red diamonds near the main sequence shows most prominently that several L′-excess sources do not show excess emission at Ks. The J, J − Ks colour–magnitude diagrams of the outer fields can be found in Appendix (B.4). |
All disc fractions provided below are derived from JHKsL′ excess sources and JHKs main-sequence stars resolved with NACO and WFC3 simultaneously. Compared to our high-resolution Keck/NIRC2 study in the central 0.8 pc of the Arches cluster (Stolte et al. 2010), a more rigorous incompleteness analysis was implemented here. For both the NACO Ks as well as the WFC3 JH-band observations, the spatial resolution limits source detections especially in the crowding-limited cluster core, and has a larger effect on J and H detections than in the sparser Quintuplet cluster. Among the 12 excess sources resolved in the central field (see Fig. 2), 8 were previously known from our earlier Keck/NIRC2 investigation (Stolte et al. 2010). While 4 new sources are detected in the central field in the analysis presented here, 16 excess sources resolved with Keck/NIRC2 remain undetected in the central cluster region with WFC3. These sources are located near brighter neighbouring stars in the dense cluster centre, and are not resolved in the WFC3 images. As the same losses affect main-sequence stars near bright neighbours, and as our incompleteness simulations are calculated for the combination of NACO and WFC3, the previously known sources are not included in the following analysis. Even for stars brighter than the J-band limiting magnitude of J ~ 22, significant losses are observed as a result of the combined effects of crowding and undersampling in the WFC3 images. This limit coincides with the proper-motion imposed Ks< 17.5 mag selection especially for fainter and redder stars (J − Ks ≥ 4.5 mag), and additionally coincides with the L′ detection limits of 14–15 mag for excess sources (see Figs. 13 and 20). As a consequence, the individual correction factors can be very large with values up to ~80% for excess sources (see Fig. 14), where both a detection in J and in L′ is required simultaneously. The requirement that excess sources be detected in all four filters leads to higher correction factors than for the JHKs main-sequence reference sample, such that the disc fraction tends to increase when incompleteness corrections are taken into account (see Table 7).
The numbers of excess sources and the reference main-sequence samples, including incompleteness-corrected values, are summarised in Table 7. Excess fractions are derived for each full field to keep the covered areas comparable. Three excess sources are located in the overlap regions between Fields 1, 3, and 5, as indicated in Table 6. The combined disc fractions are corrected for redundancy. The correction implies using only the unique excess and main-sequence samples, and reducing the incompleteness corrected number counts accordingly. The total numbers in the final two rows in Table 7 are therefore not the sums of the individual field counts in Rows 1–5. The incompleteness-corrected excess fractions range from 2% in Field 4, where only one excess source is found, to 11–13% in Field 5 and the cluster centre. No excess sources are observed in Field 2, where the unusually high extinction limits the detection of J< 22 mag main-sequence cluster members to just 21, and the detection of excess sources is likely impeded by the enhanced foreground extinction. Excluding Field 2, a total incompleteness-corrected excess fraction of 9.4% is calculated for Fields 1, 3, 4, and 5, which decreases slightly to 8.9% for the full area coverage including Field 2. Including the two excess sources with unknown membership and their respective incompleteness corrections, the excess fractions increase to 10.0% and 9.6%, respectively.
As shown in Sect. 3.1.4, individual astrometric uncertainties can induce an error in the membership selection of at most 10%. Assuming this uncertainty in the main-sequence samples as a conservative estimate leads to an uncertainty of ± 0.5% in the overall uncorrected disc fraction. The additional assumption that such an error also imposes a 10% uncertainty in the incompleteness-corrected main-sequence number counts (a 10% variation in nms,corr in Table 7), provides an estimate of the maximum uncertainty in the incompleteness-corrected disc fractions. This uncertainty in the membership selection supercedes the uncertainties by the main-sequence colour selection when the global disc fraction is derived. Allowing for this 10% variation in the corrected main-sequence number counts and taking into account the uncertainty imposed by the field coverage (inclusion or exclusion of Field 2, see Table 7), the global disc fraction in the Arches cluster is found to be between 8.1% and 10.4%, or 9.2 ± 1.2%.
In our previous study, we found that the excess fraction increases from 3% in the immediate cluster core (r< 0.2 pc), which is not well resolved in the NACO and WFC3 data presented here, to 10% at r> 0.3 pc (Stolte et al. 2010, see their Fig. 11). The fraction of 10% is larger than the total excess fraction of 6 ± 2% found in the central area of the cluster previously (Stolte et al. 2010), but is consistent with fex = 10% found for stars at larger radii, r> 0.3 pc. This consistency is expected as the NACO/WFC3 sample is dominated by stars outside the cluster core (see Fig. 2). With the increased area coverage, the total disc fraction in the Arches cluster has therefore increased from 6 ± 2% (r< 0.8 pc) to 9.2 ± 1.2% including stars with radii out to r< 1.5 pc. Here, the uncertainty is estimated from the variation in the excess fraction due to different choices of the main-sequence reference sample and the inclusion of the two excess sources with unknown membership (Table 7).
In addition to the area coverage, there is one striking difference with our earlier Keck/NIRC2 study. Given the limiting spatial resolution of ~200 mas with HST/WFC3 compared to ~60 mas with Keck/NIRC2, high incompleteness corrections are applied to each star in the cluster core. The large incompleteness-corrected number of excess sources, nex,corr = 66, extrapolated from just ten excess proper motion members detected in the central field, is a consequence of the large completeness factors that had to be applied. This correction bears a high level of uncertainty, and might over-extrapolate the true number of excess sources located in the core. As excess sources are more prone to incompleteness because of their faint JH magnitudes, the corrected disc fraction of 12–13% in Field 1 has to be considered an upper limit. A lower limit to the central disc fraction is obtained when only the observed excess sources and main-sequence members, without incompleteness corrections, are taken into account. The total observed disc fraction is then found to be 4.8 ± 0.5% in the central field only, which is dominated by sources in the inner 0.4 pc. Although several central excess sources are not resolved here, this excess fraction compares well with the disc fraction of 6 ± 2% found for the inner cluster in the higher-resolution Keck/NIRC2 data (Stolte et al. 2010).
Consistent with the findings for the Quintuplet fields above, there are one or two excess candidates qualifying as field interlopers in each 27′′ × 27′′ NACO field. The lower data quality and less confined proper motion plane derived from the Arches images, however, does not allow for a final conclusion on the apparent non-members among the excess sample. The large scatter observed in the proper motion diagrams (Figs. 8 and A.2) indicates that cluster stars might have scattered into the field distribution. A third proper motion epoch would be required to fit each star’s motion with a linear fitting function, which might lead to an even more reliable and extended member sample among both the excess sources and the main-sequence reference sample.
Comparing J-band magnitudes to a 2.5 Myr Geneva isochrone results in a mass range of 2.1 <M< 17.5 M⊙ (9500 <Teff< 32 200 K), corresponding to A1V to O9V stars (Currie et al. 2010), similar to the mass range of disc host stars observed in the Quintuplet cluster.
In summary, a fraction of 9.2 ± 1.2% of early A- to early B-type stars are found to display L-band excesses in the Arches cluster when individual, local incompleteness corrections are taken into account.
5. Discussion
A fraction of 4.0% of the Quintuplet and 4.8% of the Arches cluster members are observed to display L-band excess emission, which is here interpreted as evidence of circumstellar discs. Incompleteness-corrected excess and main-sequence samples result in disc fractions of 4.0 ± 0.7% in the Quintuplet and 9.2 ± 1.2% in the Arches cluster. The disc host stars are dominated by B-type main-sequence stars with a mean mass of ~6 M⊙ in the Quintuplet and of ~7 M⊙ in the Arches cluster. Disc survival in the UV radiation field of B-type main-sequence stars (Herbig Be stars) for time periods exceeding 2.5–4 Myr is unexpected. Such a long lifetime would argue against primordial discs, and raises the question whether the circumstellar material can have formed recently from secondary processes. This hypothesis is discussed below in the context of transition discs and binary mass transfer.
In this section, we first discuss the survival of discs in the Arches and Quintuplet clusters compared to young star clusters outside the GC region (Sect. 5.1). We proceed to discuss the possible nature of the L-band excess sources. In Sect. 5.2, we provide estimates of the physical properties of the observed L-band excess population, and compare the derived size scales and masses to known circumstellar, pre-transitional, and transitional discs. The origin of the circumstellar dust emission is discussed in the context of primordial disc survival vs. a possible secondary origin of dusty discs from binary interactions (Sect. 5.3).
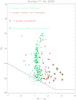 |
Fig. 20 Ks, Ks − L′ colour–magnitude diagram of the central field of the Arches cluster. All sources are labelled as in Fig. 19. A pronounced cluster main sequence composed of proper motion members (green) is seen in this central field. The Ks, Ks − L′ colour–magnitude diagrams of the outer fields can be found in Appendix (B.5). |
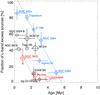 |
Fig. 21 Disc fraction as a function of cluster age, extracted from Haisch et al. (2001) (NGC 2024, Trapezium, IC 348, NGC 2264, NGC 2362, Taurus, Chamaeleon I), Hernández et al. (2007) (σ Ori), Hoffmeister et al. (2006) (M 17: NGC 6618), Maercker & Burton (2005) (30 Dor region), and Maercker et al. (2006) (NGC 3576: RCW 57). All disc fractions are derived from L-band excesses with the exception of σ Ori, where IRAC SED slopes were used to select optically thick discs. Symbols are scaled to the logarithm of the cluster mass, from the least massive with ~ 200 M⊙ in stars (NGC 2024, IC 348, σ Ori), to the most massive with > 30 000 M⊙ (30 Dor, see Stolte et al. 2010 for details). Black and red circles mark disc fractions derived from high-mass stars of types OBA only, while blue (light grey) circles mark populations dominated by low-mass stars. The three starburst clusters Arches, Quintuplet, and NGC 3603 are highlighted in red. The 30 Dor disc fraction covers the extended HII region, including star-forming ridges harbouring YSO candidates, but does not resolve the central cluster, and is therefore an upper limit to the disc fraction in this environment. The dash-dotted line corresponds to the linear decrease in disc fraction vs. cluster age suggested by Haisch et al. (lighter circles only). The dotted line represents the same relation, shifted to lower ages and disc fractions, indicating that disc depletion progresses more rapidly in the most massive clusters. The error bars in the disc fraction represent radial variations in those clusters where a radial dependence is observed (see also Stolte et al. 2010). In the case of the Arches and NGC 3603, the downward arrow indicates the radial decrease in the fraction of discs from larger radii toward the cluster core (NGC 3603 outer cluster region: Stolte et al. 2004; resolved core: Harayama et al. 2008). |
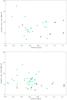 |
Fig. 22 Radial distribution of disc host star masses, as derived from the J-band luminosity and a 2.5 Myr (Arches, top panel) and 4 Myr (Quintuplet, bottom panel) Geneva isochrone. Green symbols mark proper motion members, red symbols non-members, and black symbols represent stars without membership information. |
5.1. Disc survival in young star clusters
A detailed discussion of the low disc fractions observed in the Arches cluster was presented in Stolte et al. (2010). The updated Haisch diagram including the data point of the Quintuplet cluster is shown in Fig. 21. From a statistical viewpoint, the Arches cluster has a disc fraction substantially lower than expected from nearby young populations, while the older age of the Quintuplet cluster renders the disc frequency more consistent with the expected time evolution. In dense star clusters, gravitational interactions accelerate disc disruption, especially for sources near the cluster core. Olczak et al. (2012) showed that in the dense core of the Arches cluster, a rapid removal of 30% of all discs is expected from dynamical interactions alone during its 2.5 Myr lifetime. As expected, disc mass loss is shown to be most efficient in the cluster core in their simulations, yet a strong dependence with host star mass is also found. Olczak et al. (2012) suggest that survival is most likely around B-type stars. Discs around lower-mass stars are more rapidly depleted by numerous encounters, while discs around the highest mass stars are most affected by close encounters with lower-mass stars during gravitational focusing events.
In a cluster as dense as the Arches core, and presumably the Quintuplet at a younger age, gravitational interactions would affect primordial and secondary discs alike. If interactions were the dominant source of disc depletion, we would expect only relatively massive stars to retain their discs in the dense cluster core, including high-mass binaries with substantial amounts of mass transfer. For stars with lower presumed disc masses, the chances of disc survival are higher at larger cluster radii. Investigating the radial distribution of disc host star masses as derived from the J-band luminosity above (Fig. 22), we do not observe a prominent radial decrease in the host star mass. Nevertheless, the 2–3 most massive disc-bearing stars, with M> 12 M⊙, are found in both clusters near the core at r< 0.5 pc. This finding provides weak evidence that gravitational interactions play a rôle in disc depletion, as mass segregation also causes the most massive stars to sink to the cluster centre. Deeper observations detecting discs around lower mass host stars will shed more light on the dominant disc destruction mechanism in these massive, young Galactic centre clusters.
5.2. The nature of the excess sources
At a wavelength of 3.8 μm, it is assumed that the L-band emission originates from hot material at the inner rim of a circumstellar disc (Espaillat et al. 2011; see Alonso-Albi et al. 2009 especially for Herbig Be stars). Here, we provide an estimate of the distance of the material from the central star and the disc mass, and compare this to the observed properties of debris and transition discs detected around lower-mass stars.
5.2.1. Distance of the dust from the star
A first approximation of the distance of the hot dust from the star can be deduced assuming radiative equilibrium. The radiation from the central star hitting a dust particle with radius a and area πa2 is given by  where
where  is the stellar luminosity, Rstar is the radius and Tstar the effective temperature of the central star, adust is the radius of a dust particle, A is the albedo of the dust, σSB is the Stefan-Boltzmann constant, and F(D) is the flux that reaches the particle at distance D from the star. A low albedo implies that the entire flux is absorbed by the dust, while a high albedo means total reflectivity.
At the same time, the particle emits radiation at the characteristic dust temperature Tdust: 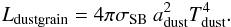 (5)In equilibrium, the radiation absorbed and re-emitted by dust particles at the dust temperature has to be the same, Labs = Ldustgrain, which leads to
 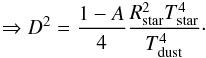 Using Wien’s law with the wavelength of the NACO L′ filter, λL′ = 3.8 μm, yields an emission temperature of Tdust = 763 K. However, from the observation of an L-band excess alone the wavelength of the peak emission of the dust is unknown.
A minimum distance of the dust to the star can be estimated from the maximum possible temperature in the absence of a K-band excess, as observed in more than half of the excess sources. We note that even in the presence of a K-band excess, the K-band excess has to be smaller than the L-band excess for a strong Ks − L′ excess to be observed, as equal excesses in both filters would cancel each other. With characteristic colour uncertainties of 0.2 mag, less than 20% of the ~1 mag Ks − L′ excess should be present at 2.2 μm. The temperature of a black body with 20% of the radiation at 2.2 μm corresponds to 1220 K and the peak will occur between the Ks and L′ bands at 2.4 μm. A lower limit to the temperature is not as strictly defined, as we have no knowledge of the longer-wavelength emission. If the discs are evolved, consisting of substantial amounts of larger grains, a radiation maximum in the mid-infrared can be expected. Under the assumption that the observed L-band emission at 3.8 μm represents only 20% of the total disc emission, the black-body temperature corresponds to 704 K with a peak wavelength of 4.1 μm, shortly beyond L′.
With a characteristic B2V 10 M⊙ star for our excess sources, we assume a main-sequence temperature of Tstar = 22 000 K, stellar luminosity of 5770 L⊙, and from Stefan-Boltzmann’s Law a radius of 5.2 R⊙.
Allowing for disc temperatures between 704 K and 1220 K, the distance of dust from the star under the black-body approximation is estimated to be 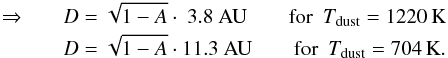 In the case of complete light absorption, a maximum of the distance of the irradiated matter from the central star is derived:
  With the more moderate assumption that half of the stellar radiation is absorbed by the dust, lower minimum and maximum radii are obtained,
  where the minimum represents the case where 20% of the radiation is emitted at Ks and the maximum represents the case where 20% of the emission is emitted at L′. The simplified assumption of black-body radiation provides only a very approximate range of likely dust radii. Detailed dust distribution calculations would be required to obtain a more realistic radial distribution of the dust disc; however, the single excess value at L-band does not provide firm observational constraints for such models, and such an effort would be beyond the scope of this paper.
For a B2V 10 M⊙ star we expect a dust distance of 3–11 AU in the limiting cases that between 60% and 20% of the dust radiation are emitted at L′, respectively. Distances in the range of several AU suggest that dust in the inner disc is destroyed, consistent with evolution models of discs around high-mass stars. The fact that only weak K-band emission is detected in most of the excess sources also suggests that the inner, and hotter, part of the dusty disc component is depleted.
5.2.2. Limits to disc masses
A lower limit to the disc mass can be obtained when assuming the disc is optically thin at the observed wavelength. Following the derivation in Hartmann 2000 (pp. 113–114), we can estimate the disc mass from 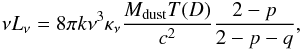 (6)where Mdust is the desired dust mass, ν is the frequency where the luminosity Lν is measured, κν is the dust opacity, T(D) is the temperature in the disc at the distance D from the star, p and q are the exponents of the radial density and temperature profiles of the disc, k is the Boltzmann constant, and c is the speed of light. Typical values for the exponents of the radial and temperature profiles are p = q = 0.75, hence
  .
.
For the dust opacity, following Eq. (6.13) in Hartmann (2000), we assume  at a frequency ν = 1014 Hz. This value is consistent with the dust opacity observed by Indebetouw et al. (2005), κλ(4.5 μm) = 0.9 m2 kg-1.
With νLν = 4πd2νFν = 4πd2λFλ, and λFλ inserted from Appendix D, we find  . Using the temperature limits derived in the previous section, 704 K and 1220 K, the lower limit to the dust mass is calculated to be
  where we have assumed that the L-band excess stems entirely from the dust emission. If the discs are still gas-rich, the frequently used gas-to-dust ratio of 100:1 would imply the total disc mass to be higher by a factor of 100. We note here that the entire calculation is based solely on the brightness of a B2V star and the assumption of an L-band excess of 1 magnitude above the stellar photosphere.
This disc mass estimation implies several assumptions originally derived for optically thin discs at long wavelength radiation (1.3 mm, Beckwith et al. 1990). Both the density and the temperature profiles of the disc are assumed to be power laws (Hartmann 2000; Beckwith et al. 1990). However, the structure of our excess objects cannot be deduced from L′ observations alone. In addition, the Planck function determining Lν is represented by the Rayleigh-Jeans approximation in the long-wavelength tail, and T(D) represents the temperature at the outer boundary of the disc. This is not true in our estimation above. Here we have assumed that the radiation at L′ is the dominating dust radiation component, such that Wien’s law can be used to obtain the dust temperature. As the dust is heated most intensely at the inner rim, the radius corresponds to the inner disc radius rather than the outer boundary. Beckwith et al. (1990) argue that the mass estimate depends only weekly on the outer boundary in the case of optically thin discs. In the above calculation, we have made the assumption that all dust particles are located at the inner dust sublimation radius derived to be on the order of 10 AU in the previous section. However, a lower temperature T(D) at the outer boundary decreases the disc mass estimate. If the temperature follows the assumed power law profile T(D) = T0(r/r0)-0.75 (see also Hartmann 2000; Beckwith et al. 1990), T(D) could be as low as 140 K at an outer radius of 100 AU, and the disc mass would be lower by a factor of 5.
While this mass estimation reflects the standard derivation of disc masses in the literature, which are mostly obtained from millimetre radiation, some of the uncertain assumptions above can be avoided. Here, we start from the total luminosity of the dust grains as given in Eq. (5), Ldust = Ndust × Ldustgrain, where Ndust is the total number of dust grains in the disc contributing to the total dust luminosity Ldust. The value of Ndust can be expressed in terms of the standard dust grain size distribution derived for interstellar dust, n(a) ∝ a-3.5 (Mathis et al. 1977)  (7)where a is the grain size with minimum and maximum grain radii of amin and amax, and cdust represents an unknown normalisation factor.
Inserting Ldustgrain from Eq. (5) yields  (8)The total disc mass can then be calculated from the mass of the individual dust grains by integration over the assumed size distribution. The mass of each individual grain is given by
  assuming a mean density of ρgrain to be constant for all dust grains in the disc. Integrating over all grains assuming the same grain size distribution, n(a) ∝ a-3.5, yields the total dust mass in the disc:
 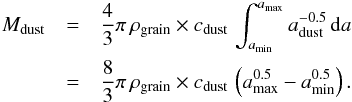 (9)The normalisation factor cdust is derived from the known L-band excess emission of the disc using Eq. (8). For the order of magnitude estimate desired here, we use a characteristic L-band excess of 1 mag above the stellar photosphere as before, and the corresponding total dust luminosity of Ldust = 3.4 × 1026 kg m2 s-3 (Appendix D). Using the normalisation factor cdust to derive the dust mass, a minimum and maximum grain size of 0.025 and 0.250 μm, and assuming a grain density of ρgrain ~ 2.3 g cm-3 adequate for carbon grains, yields a total dust mass of
  for a temperature of 704 K. Using the upper limit to the dust temperature, 1220 K, the dust mass decreases to
  two to three orders of magnitude smaller than the disc mass estimated above. The lower mass estimate is a direct consequence of the assumed steep grain size distribution, n(a) ∝ a-3.5. This distribution, which is used as the standard size distribution in protostellar discs, implies that most of the dust particles are in the small spatial regime, adust ≪ λobs, and are small compared to the wavelength of the observation. While this might be a good approximation for early, primordial dust discs, the particles in evolved discs are expected to have undergone grain growth. At the same time, the grain size distribution in mass transfer discs is entirely unknown. Even if the discs are of primordial origin, a flatter grain size distribution with more particles at larger size scales or a maximum grain size larger than the classical value of amax = 0.250 μm (Mathis et al. 1977) would give rise to a higher dust mass in the disc.
In this estimate, we again had to make the assumption that all dust contributing to the total dust luminosity in L-band and hence the observed infrared excess emission was distributed near the dust sublimation radius at a dust temperature between 704 and 1220 K.
These disc masses are strict lower limits for two reasons.
-
1.
We only derive the mass from the contribution of warm dust thatis heated by the stellar flux to temperaturesaround 800 K. This dust is locatedat a distance of ~10 AU, and is likely only a small fraction of the total dust mass in the disc. Any colder dust at larger radii is not accounted for.
-
2.
We have assumed an optically thin disc in the first estimate, which might be reasonable for transition discs, where dust and gas are already clumpy and partially depleted. However, the inner rim of the disc, where the L-band excess is emitted, is hot and likely partially optically thick. The optically thick portion of the disc cannot be penetrated and is not included in the mass estimate.
Both aspects of these considerations lead to an underestimate of the disc mass. We therefore conclude that the observed excess originates from circumstellar discs at least as massive as 10-10MJup, and likely as massive as 10-7MJup. If the discs contained a large fraction of gas close to the primordial gas-to-dust ratio of 100:1, the total disc mass could be as large as 10-5MJup. These low masses support the suggestion that we are indeed observing either mass transfer or transition discs with large L-band excesses, as discussed in Sects. 5.2.3 and 5.3.
5.2.3. Comparison to pre-transitional discs
The discs in the Arches and Quintuplet clusters are detected because of their Ks − L′ colour excess. The prerequisite for such a colour excess is that L-band emission exceeds both photospheric levels as well as any excess emission in K-band. While primordial discs around very young Herbig Be stars (<1 Myr) feature prominent near-infrared excesses to wavelengths as short as 2 μm, a weak or absent K-band excess in combination with a substantial L-band excess indicates a later stage of disc evolution. For high-mass stars, this implies the formation of an inner hole leading to a larger radius for the hot, inner rim observed at 2–4 μm (e.g. Alonso-Albi et al. 2009). As discussed in Sect. 1.1, a survival timescale of more than 2 Myr is also not expected for primordial discs around B-type stars because of their strong UV radiation field. Transitional or debris discs, on the other hand, are already depleted in L-band emission, such that the excess sources in the Arches and Quintuplet clusters display properties between primordial and transitional discs. If the observed discs in the Arches and Quintuplet clusters at ages 2.5–4 Myr around B-type stars have evolved from primordial discs, they could be the counterparts to the recently found near-infrared bright evolved F star discs (Fujiwara et al. 2013), yet around higher-mass host stars. In order to conclude whether the observed L-band emission might originate from pre-transitional discs, the inner (sublimation) disc radius and the amount of the L-band excess emission are compared to the physical properties of the pre-transitional discs in the sample of Fujiwara et al. (2013) displaying L-band excesses.
Recently, Fujiwara et al. (2013) presented a survey of 18 AKARI sources in the transition phase from protoplanetary to debris objects. They defined their sample from nearby (d< 120 pc) spectrally classified main-sequence A-M stars with AKARI 18 μm detections, which were cross-correlated with the 2MASS JHKs data base. WISE 3.4 and 4.6 μm photometry was obtained to cover the mid-infrared region of the SEDs. In their sample, four sources show clear indications of mid-infrared excess down to 3.4 μm (L-band) (namely, HD165014, HD166191, HD167905, HD176137; compare to Fig. 3 in Fujiwara et al. 2013). The mid-IR excess emission is measured in their sample around low-mass G and F main-sequence stars, and they find inner disc radii of 0.7–1.4 AU with maximum temperatures of 400–500 K for the spectrum of a 1.4 M⊙ star.
Following their procedure, we can use the luminosity of our B2V template star as an example to calculate the inner disc radius, 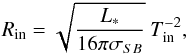 (10)where L∗ is the stellar luminosity, Tin the inner disc temperature, and σSB the Boltzmann constant (see Eq. (3) in Fujiwara et al. 2013). With an absolute luminosity of 5770 L⊙ for a B2V star, and an inner disc temperature between 704 and 1220 K (Sect. 5.2.1), the inner disc radius of a 10 M⊙L-band excess source is expected to be in the range 4 − 12 AU, such that the inner disc of a B-type star is depleted to substantially larger radii than the FG discs, as expected. The same authors also provide the ratio of the dust to stellar luminosity, Ldust/L∗, from which the expected L-band excess for these transition discs can be derived. For a 1.4 M⊙ main-sequence star, a stellar luminosity of Lbol = 3.47 L⊙ is assumed. As the ages of the transition discs in the Fujiwara et al. (2013) sample are not known, the L-band magnitude is adopted from the 2.5 Myr Geneva isochrone used above to derive the masses of our disc host stars. For a 1.4 M⊙ star, these isochrones suggest ML = 2.54 mag, such that we find for the stellar flux
  Converting to the standard distance of 10pc to obtain the absolute luminosity, L1.4,L = 2.3 × 1024 W, and using Lbol = 3.47 L⊙, we derive L1.4,L = 6 × 10⁻³L⊙ = 1.7 × 10⁻³L1.4, ∗ as the expected photospheric luminosity of the disc host stars in a standard L-band filter. From the dust-luminosity-to-star ratio provided in Table 13 of Fujiwara et al. (2013), the excess emission fraction from the discs for the four strong emission sources can be estimated. With Ldust/L∗ = 6 × 10-3,9 × 10-3,2 × 10-2,5 × 10-2, and using L1.4,L = 1.7 × 10⁻³L1.4, ∗, the excess factor of the luminosity above the stellar photosphere in L-band caused by the dust contribution is calculated to be
  , where again Ldust/L∗ is the dust luminosity in terms of the total luminosity of a 1.4 M⊙ host star, and L1.4,L/L∗ is the photospheric L-band contribution. These relative fractions correspond to L-band excesses of ΔLdust = 1.4,1.8,2.7,3.7 mag. These values are comparable to, and even slightly larger than, the L-band excesses measured in the Arches and Quintuplet excess sources.
In summary, under the assumption that the central stars are B2V stars, the hot dust emission likely occurs at large radii of 3 − 12 AU. As expected, the inner dust rim is further from the central star as in the case of F-type stars with dust sublimation radii of 0.7–1.4 AU. The L-band excess emission derived from the dust luminosity of these lower-mass stars, however, is consistent with the observed L-band excesses in the dusty Arches and Quintuplet sources. The question remains whether primordial discs could have survived for a sufficiently long time to evolve into pre-transitional discs, or whether the discs formed later as a result of mass transfer. If the host star masses were lower than estimated, towards the low end of our J-band magnitude range (3 M⊙), a survival of primordial discs as observed around F-stars yet with dust at larger radii would be more likely.
5.3. A secondary disc origin
Espaillat et al. (2012) recently suggested a physically motivated distinction between primordial, pre-transitional, and transitional discs. Following their definition, a disc is only transitional when a near-infrared excess is no longer present, which is interpreted as transitional discs being discs with inner holes (optically thin inner discs). A pre-transitional disc, on the other hand, is composed of an optically thick inner disc at a few AU from the central star leading to near-infrared excesses, a lack of mid-infrared emission corresponding to a radial gap, and strong far-infrared excess emission. As our sources show weak Ks excess, yet substantial L′ excesses, they would formally qualify as pre-transitional discs from their near-infrared properties alone. Without knowledge of their far-infrared SEDs, other possibilities have to be considered as well.
In addition to the detection of the pre-transitional/transitional discs in Fujiwara et al. (2013) discussed above, Moór et al. (2011) detected an unexpectedly massive CO gas component in young debris discs with ages up to 30 Myr. For their two A1V and A3IV-V stars having strong CO emission, line profile modelling suggests an inner radius for the dust disc of ~60 AU with a dust temperature of 60–80 K. This radius is even more extended than the L-band emission region estimated for the Arches and Quintuplet sources of ~10 AU above. Moór et al. (2011) argue that UV radiation from both the central star and the interstellar radiation field is capable of destroying the molecular gas component on very short timescales, as shielding becomes inefficient within 500 years at every location in their modelled transition disc. They therefore argue that the gas discs are of secondary origin. In K-band spectra available for three of the Arches excess sources, strong CO bandheads at 2.3 μm are detected, indicating that the Arches discs contain a gaseous component as well (Stolte et al. 2010). At the higher central stellar masses and the stronger ambient radiation field of our B-type cluster stars, rapid gas depletion is even more expected (Hollenbach et al. 1994; Alexander et al. 2006; Cesaroni et al. 2007), such that a secondary origin of the CO emission observed in the three spectroscopically identified Arches excess sources might provide an explanation of the Arches and Quintuplet excess sources alike.
Two scenarios have been discussed to explain secondary discs around lower-mass stars. Both are related to the B[e] and Be phenomena. In single Be stars, equatorial mass loss due to rapid rotation close to the critical rotation velocity removes angular momentum from the surface of the star (Granada et al. 2013). Although absolute numbers of expected rapid rotators with optically thick discs are not known, theoretical models predict a fraction of a few per cent at cluster ages of a few Myr (Granada et al. 2013, see their Fig. 2), which would be consistent with the disc fractions observed in the Arches and Quintuplet clusters. The simulations naturally predict denser, more extended, and more massive discs around higher-mass stars, which could explain why our sample is dominated by mid- to late B-type stars. For rapidly rotating stars in the mass range 2 − 9 M⊙, Granada et al. (2013) find modelled disc extents of 10–30 AU and disc masses of 10-8 − 10-11M⊙ reaching the same order of magnitude as our lower disc mass limit (Mgas + dust ~ 10-8M⊙) estimated for the Arches and Quintuplet excess emission sources (Sect. 5.2.2).
However, the predicted number ratios are sensitive to the initial conditions, and these models generate classical Be stars only towards the end of the main-sequence phase, which takes more than 10 Myr for all stars considered in their models (Mmax = 9 M⊙). As a consequence of the initial rotation profile, an early adjustment phase prohibits the generation of critically rotating stellar surfaces during the early main-sequence phase (see Granada et al. 2013 for details), as would be required to explain the very young B-star disc population in the GC clusters.
An additional caveat arises from the fact that Be stars, by definition, show strong Balmer emission lines. Their discs are thought to be gaseous with little or no dust, in stark contrast to primordial, pre-transitional or transitional discs (e.g. Silaj et al. 2010). Near-IR spectra available for three of the Arches excess sources display strong CO bandhead emission (Stolte et al. 2010), such that these sources host both optically thick molecular gas as well as hot dust contributing the L-band excess emission. However, all three excess sources show no evidence for hydrogen emission (or absorption) at the wavelength of the near-infrared Brackett γ line. Given both the substantial presence of dust and the absence of hydrogen-line emission in these three Arches sources, we conclude that classical Be stars – or stars with similar circumstellar properties – are unlikely candidates for the origin of the discs around these sources.
The second scenario for a secondary disc origin is related to binary evolution. In this scenario, the mass ejection by the primary in a close binary system leads to the formation of a circumbinary disc. Such a scenario is suggested for the young, evolved B[e] supergiants GG Carinae (Kraus et al. 2013) and HD 327083 (Wheelwright et al. 2012). Both objects host high-mass ~25 M⊙ primaries, and disc models indicate an inner rim of gaseous CO emission at 3 AU at a temperature of Tgas ~ 1700 K. These gaseous discs are located inside the dust emitting region, which has an inner radius of 5 AU (Wheelwright et al. 2012), in reasonable agreement with the radii estimated for the L-excess origin above. Both sources lack dust close to the central star (inner holes), and the modelled inner radii are larger than the binary separation, arguing for circumbinary discs. The study of GG Car reveals that standard Roche lobe overflow from the primary to the secondary is unlikely, as the primary has not filled its expected Roche lobe given its evolutionary state (Kraus et al. 2013). The same authors argue that the primary was in a classical Be phase towards the end of its main-sequence evolution, such that matter from an equatorial decretion disc could have overflowed the Roche surface of the binary and streamed into circumbinary orbits. In the case of the Arches and Quintuplet main-sequence excess sources, such a decretion disc had to evolve at an earlier stage in the stellar lifetime. Such a scenario would argue for tight binary systems, where the smaller common Roche surface could be filled by mass loss from a high-mass primary, possibly enforced by rotation.
A secondary disc origin in a binary system appears even more likely as primordial discs in close binary systems disperse on timescales of less than 1–2 Myr, while the survival time for discs around low-mass single stars is found to be longer, with a mean of 3–5 Myr (Kraus et al. 2012). Given the strong UV radiation fields and the added tidal torques, close, high-mass binaries can be expected to deplete their primordial discs even faster than their lower-mass counterparts. A binary origin of a secondary disc is intriguing in view of the recent suggestion that most high-mass stars undergo binary interactions during their lifetime. For Galactic O-type stars, Sana et al. (2012) find a fraction of 70% to be affected by binary evolution, with 50% of all high-mass stars in their sample undergoing envelope stripping, accretion, or common envelope evolution. Combining their observations with binary evolution models, they suggest that 26% of O-star binaries have a high likelihood of being affected by mass transfer events already on the main sequence. While this ratio might be smaller for the B-type disc host stars investigated here, a significant fraction of B-type main-sequence cluster members is expected to be located in a binary system. Reviewing recent studies of B-star binary properties, Duchêne & Kraus (2013) suggest 60% as a lower limit for the binary fraction of B6 to B2 main-sequence stars. However, they also find that the fraction decreases towards lower masses, with 30–45% found for late B- to early A-type stars. If a few per cent of the ~700 main-sequence stars found in the Quintuplet reference sample and of the ~400 main-sequence stars observed in the Arches are affected by binary interaction at the present epoch, the formation of secondary circumbinary discs with molecular gas and hot inner rims at this level might be expected from binary mass transfer alone. Such a scenario would naturally explain the similarity of the disc extent and properties with B[e] supergiants, although the mass transfer would happen at a much earlier stage during the main-sequence evolution of the primary component, and the material is provided by the wind mass loss of the high-mass star.
Whether the circumstellar discs in the Arches and Quintuplet clusters are of a primordial or a secondary origin cannot be distinguished with the current observations. High-resolution spectra delivering rotational velocities, mass loss rates, and abundance ratios of the disc host stars are required to definitively answer the question of the disc origin. For instance, for equatorial discs of rapidly rotating stars, the N/C abundance ratios should be enhanced compared to non-rapid rotators of the same population, and a high rotational velocity is maintained in initially rapid rotators over the entire main-sequence lifetime (Granada et al. 2013). For pre-transitional discs, the study of the mid-infrared SED would provide the same distinction mechanism used to define this subclass. While MIR surveys such as Spitzer do not provide the spatial resolution to construct NIR to MIR SEDs for the GC cluster disc sources, the veiling in NIR spectra as suggested by Espaillat et al. (2012) can confirm the existence of thick inner discs as proposed here from the L-band excess emission. The characteristics of secondary binary mass transfer discs are not well constrained, as there are no high-mass transfer disc models so far. The first step towards constraining the nature of the discs would therefore be to probe the sample for spectroscopic binaries, especially as only tight binaries show mass transfer already during their main-sequence evolution. Confirming the binary nature of the disc candidates and hence catching these objects in the act of mass-transfer would imply that a very special phase of high-mass stellar evolution can be observationally analysed in detail for the first time.
In summary, we conclude that the discs observed in the Arches and Quintuplet clusters have either originated from massive primordial discs that are in a warm, pre-transitional phase or, more likely, that they are composed of secondary discs caused by binary mass transfer.
6. Summary
We investigate deep VLT/NACO KsL′ in combination with HST/WFC3 JH imaging of the Arches and Quintuplet clusters to derive disc fractions from L-band excess emission. Multi-epoch NACO Ks observations are used to derive proper motion membership for L-band excess sources and the main-sequence reference samples. The results are summarised for each cluster below.
Circumstellar disc candidates in the Quintuplet cluster:
-
1.
A total of 26 L-band excess sources as candidates of circumstellar discs are discovered in the Quintuplet cluster.
-
2.
The L-band excess fraction in the Quintuplet is observed to be 4.0 ± 0.7%, where the uncertainty originates from the selection of the main-sequence reference sample. This fraction is consistent in all three fields where excess sources are detected, and – in contrast to earlier results in the Arches cluster (Stolte et al. 2010) – no trend of a varying excess fraction with radius is found. While several excess sources are found out to a radius of 1.2 pc, by far most of the excess sources are found in the central r< 0.8 pc.
-
3.
The lack of excess sources in Quintuplet Fields 3 and 4 and at larger radii in Fields 2 and 5 indicates a rapid decline of the cluster profile at the largest radii, r> 1.5 pc, covered by our member survey. The detection of only three non-proper motion members featuring an L-band excess suggests that the fraction of field excess sources is very low. This conclusion is supported by the sparsity of excess sources in Arches Fields 2 and 4. Circumstellar disc candidates in the Arches cluster:
-
4.
We find a mean disc fraction of 9.2 ± 1.2% out to the predicted tidal radius, r< 1.5 pc, in the Arches cluster, which is slightly larger than the mean disc fraction of 6 ± 2% detected previously in the cluster centre (Stolte et al. 2010).
-
5.
In contrast to our earlier study of the Arches core, no trend of the disc fraction with radius is found in either cluster at the larger radii investigated here, suggesting that the dominant disc destruction mechanism predominantly acts in the densest part of the cluster core.
-
6.
A total of 21 excess sources are detected over the entire cluster area at the NACO L′ sensitivity and spatial resolution. Of these, 8 excess sources in the cluster centre were previously known. Combining the newly detected 13 disc sources with the previously known 24 excess sources resolved with Keck/NIRC2 in the cluster centre increases the total number of discs in the Arches cluster to 37.
Properties and disc origin:
The stellar mass range of the disc host stars is approximated to be 2.2 − 17 M⊙ in both clusters, with a mean mass of 6 − 7 M⊙, corresponding to early A to early B main-sequence stars. The inner radius of the dust emission region is estimated to be in the range 3–12 AU. For a B2V host star, we estimate the minimum dust mass in the discs to be on the order of 10-10 to 10-7MJup. Comparing the fractional L-band flux to observed evolved discs indicates that our disc sources could be the higher-mass counterparts to the recently identified class of pre-transitional discs. As these arguments ignore the effects of UV evaporation expected to severely influence the disc lifetime of B-type stars, we discuss the possibility of a secondary disc origin. We conclude that mass transfer discs in interacting high-mass binary systems provide a likely origin of the L-band excess emission. As mass transfer from the primary donor to the secondary companion alters the chemical composition on the surface of the acceptor, these two different disc mechanisms need to be investigated further with high-resolution spectroscopy to obtain abundance ratios in order to reach a final conclusion on the disc origin of B-type main-sequence stars in the Arches and Quintuplet clusters.
Online material
Appendix A: Proper motion diagrams of the outer cluster fields
As a consequence of the variation in stellar density across the wide-field coverage of the cluster images, the proper motion
diagrams are populated with varying levels of source density. In order to avoid confusion, especially given the dense environment in the cluster centres, the proper motion diagrams of the individual data sets are shown here.
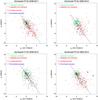 |
Fig. A.1 Proper motion diagrams of the Quintuplet fields beyond the cluster centre. L-band excess sources are marked as red diamonds, while Wolf-Rayet candidates are shown in blue. The criterion for cluster member selection (circle) depends on the astrometric quality of each data set and on the corresponding dispersion in the cluster population around the origin. For the outer Quintuplet fields exclusively, membership probabilities were used to distinguish cluster members from field stars. The indicated membership criterion is therefore approximate, as the probabilities account for individual astrometric uncertainties and the location of each star with respect to the cluster centre. See Fig. 7 for further details. |
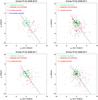 |
Fig. A.2 Proper motion diagrams of the outer Arches fields. Labels are described in Fig. A.1, and for further details see Fig. 8. The larger scatter observed in the Arches proper motion diagrams compared to the Quintuplet proper motions is a consequence of the shallower Arches NACO photometry and mitigated adaptive optics performance. The circles indicate the membership selection criterion as derived from the central field in Fig. 9. |
Appendix B: Colour–magnitude and colour–colour diagrams of the outer cluster fields
The foreground extinction towards the Galactic centre is patchy and varies widely with position. Each of the Arches and Quintuplet fields feature varying levels of foreground extinction,
such that a single extinction value could not be used for the selection of the main-sequence reference samples. The colour selection was adapted visually in each field to include the proper motion members along the observed cluster main sequence and exclude the red clump population starting at J ~ 20 mag.
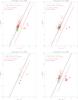 |
Fig. B.1 J − H,Ks − L′ colour–colour diagrams of the Quintuplet outer fields. Proper motion members are shown in green, while non-members are shown in red. The black line denotes the extinction vector (Nishiyama et al. 2009). The red solid line shifted parallel to the reddening vector marks the 3σ selection criterion for L-band excess sources (red diamonds). Wolf-Rayet candidates (Ks< 12 mag) are marked in blue, while fainter excess sources marked as red diamonds are candidates for circumstellar disc emission. The J − H,Ks − L′ diagram of the Quintuplet central field can be found in Fig. 15. |
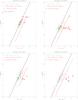 |
Fig. B.2 J − H,Ks − L′ colour–colour diagrams of the Arches outer fields. Labels are as described in Fig. B.1, and the J − H,Ks − L′ diagram of the Arches central field is shown in Fig. 18. |
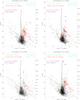 |
Fig. B.3 J, J − Ks colour–magnitude diagrams of the Quintuplet outer fields. Proper motion members are shown in green, while non-members are shown in red. Disc and Wolf-Rayet candidates are also marked. The diagonal overdensity at J ~ 20 mag marks the onset of the red clump. The dotted lines mark the Ks = 17.5 mag boundary for proper motion member selection. The horizontal dashed line indicates the J = 22 mag limit, above which the combined cluster disc fractions are derived. The main-sequence selection is indicated by vertical dashed lines. The variation in main-sequence colour between fields is caused by the locally varying extinction across the cluster area. The J, J − Ks diagram of the central Quintuplet field is shown in Fig. 16. |
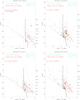 |
Fig. B.4 J, J − Ks colour–magnitude diagrams of the Arches outer fields. Labels are as described in Fig. B.3, and the J, J − Ks diagram of the Arches central field is shown in Fig. 19. The variation in main-sequence colour between fields caused by the locally varying extinction is more pronounced than in the Quintuplet fields. Notably, several L′-excess sources do not show excess emission at Ks. |
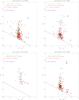 |
Fig. B.5 Ks, Ks − L′ colour–magnitude diagrams of the Quintuplet outer fields. Labels are as in the previous figures, and the Ks, Ks − L′ diagram of the central Quintuplet field can be found in Fig. 17. A distinct main sequence of cluster members can be seen in Field 2 (top left panel), while in all other fields the proper motion information is required to exhibit the rare cluster stars at these increasing radii. |
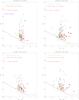 |
Fig. B.6 Ks, Ks − L′ colour–magnitude diagrams of the Arches outer fields. Labels are as in the previous figures, and the Ks, Ks − L′ diagram of the central Arches field can be found in Fig. 20. While a pronounced main sequence is observed in the central field, in all outer fields the proper motion membership provides the best evidence for the distinction between cluster and field samples. |
Appendix C: Variable stars
From our multi-epoch Ks proper motion campaign, we obtain a list of candidates for variable sources. Stars are defined as variable if the standard deviation of their magnitudes across three epochs deviates by more than 3σ from the median of the standard deviations of all stars in their respective magnitude bin. The expected (median) standard deviation is calculated in bins of ΔKs = 1 mag to account for the increase in photometric error towards fainter stars. In the case that only two epochs are available, the magnitude difference between epoch 1 and epoch 2 has to exceed 3 times the standard deviation of the magnitude differences of all stars in the respective magnitude bin of a variable candidate. With the exception of one prominent source in Arches Field 5, only stars brighter than Ks< 16 mag are searched for variability, as photometric uncertainties in the crowded cluster fields trigger many false detections beyond this limit. Two additional constraints are imposed to ensure that variable candidates are not affected by positional and/or PSF fitting uncertainties. The absolute magnitude difference or standard deviation for a star to be a variable candidate has to exceed ΔKs> 0.1 mag, and the difference in the source position in both the x and y coordinates has to be less than 0.5 pixel after the geometric transformation to the reference epoch. By imposing this astrometric consistency, incorrect matches with very close neighbouring stars are avoided. Finally, all variable candidates were inspected visually in all Ks epoch images to ensure that sources are not affected by background noise fluctuations, corrupt PSF cores, edge effects, and especially that their photometry is not compromised by the haloes of bright neighbours. As only two epochs were available in all Quintuplet fields except Field 2, no variable candidates could be identified unambiguously in the Quintuplet cluster fields. The photometry of all variable stars identified in the Arches cluster is summarised in Table C.1.
Variable candidates in the Arches cluster.
Appendix D: L-band luminosity of the discs
The L-band luminosity of the excess sources can be estimated for a central B2V star from the difference between the stellar brightness and the excess emission.
The 2.5 Myr Geneva isochrone yields an L-band brightness of L(B2V) = − 1.35 mag for a 10 M⊙ star. For our approximation here, we assume this L-band brightness to be close to the Vega system, such that LVega = 0 mag, and  Inserting the Vega flux of Tokunaga & Vacca (2005)
  leads to
 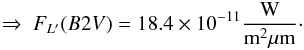 The absolute flux within the passband is given by the filter width ΔλL′ = 0.62 μm times the expected flux at the central wavelength:
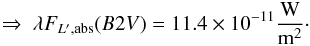
If the disc is about 1 mag brighter in L′ than the star, then ΔL = 1 mag implies a factor of 2.5 higher flux, 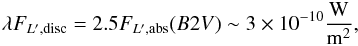 which is already the flux we expect to measure within the passband of L′ with filter width 0.62 μm. In this estimate, no assumptions about the distance have been made, as all fluxes are derived for absolute magnitudes only, hence at a standard distance of 10 pc. This flux is used to derive an order of magnitude limit of the disc masses in Sect. 5.2.2.
Appendix E: Complete source lists
The JHKs combined source lists for the Arches and Quintuplet clusters are made available at the CDS. Proper motion memberships are meant as indicator values for candidacy, and might change as further proper motion epochs become available.
JHKs sources and L′ detections in the Quintuplet cluster.
JHKs sources and L′ detections in the Arches cluster.
The Ph.D. Thesis can be requested from This email address is being protected from spambots. You need JavaScript enabled to view it.
These data were taken under Proposal ID: 67.C-0591, PI: Stolte, and are used only for calibration purposes in this analysis.
All source catalogues are available in electronic format at the CDS.
Acknowledgments
We sincerely thank the referee for the careful reading of the manuscript and especially for thoughtful comments on improvements to the discussion section. A.S., B.H., and M.H. are grateful for generous support from the DFG Emmy Noether programme under grant STO 496/3-1. We also wish to thank the Argelander Institute for its hospitality, and are indebted to Julien Girard and the NAOS-CONICA staff for their persistent and unique support with the long-term observational programmes. C.O. appreciates funding by the German Research Foundation (DFG) grant OL 350/1-1 and SFB 881. A.M.G. and M.R.M. gratefully acknowledge NSF support under grant AST-0909218. Some of the data presented in this paper were obtained from the Mikulski Archive for Space Telescopes (MAST). STScI is operated by the Association of Universities for Research in Astronomy, Inc., under NASA contract NAS5-26555.
References
- Adams, F. C., Hollenbach, D., Laughlin, G., & Gorti, U. 2004, ApJ, 611, 360 [NASA ADS] [CrossRef] [Google Scholar]
- Alexander, R. D., Clarke, C. J., & Pringle, J. E. 2006, MNRAS, 369, 229 [NASA ADS] [CrossRef] [Google Scholar]
- Alonso-Albi, T., Fuente, A., Bachiller, R., et al. 2009, A&A, 497, 117 [NASA ADS] [CrossRef] [EDP Sciences] [Google Scholar]
- Anderson, K. R., Adams, F. C., & Calvet, N. 2013, ApJ, 774, 9 [NASA ADS] [CrossRef] [Google Scholar]
- Beckwith, S. V. W., Sargent, A. I., Chini, R. S., & Guesten, R. 1990, AJ, 99, 92 [Google Scholar]
- Benjamin, R. A., Churchwell, E., Babler, B. L., et al. 2003, PASP, 115, 953 [NASA ADS] [CrossRef] [Google Scholar]
- Cesaroni, R., Galli, D., Lodato, G., Walmsley, C. M., & Zhang, Q. 2007, Protostars & Planets V, eds. B. Reipurth, D. Jewitt, & K. Keil (Tucson: University of Arizona Press), 197 [Google Scholar]
- Churchwell, E., Babler, B. L., Meade, M. R., et al. 2009, PASP, 121, 213 [NASA ADS] [CrossRef] [Google Scholar]
- Cieza, L. A., Schreiber, M. R., Romero, G. A., Williams, J. P., & Rebassa-Mansergas, A. 2012, ApJ, 750, 157 [NASA ADS] [CrossRef] [Google Scholar]
- Clarkson, W., Ghez, A. M., Morris, M., et al. 2012, ApJ, 751, 132 [NASA ADS] [CrossRef] [Google Scholar]
- Currie, T., Hernández, J., Irwin, J., Kenyon, S. J., et al. 2010, ApJS, 186, 191 [NASA ADS] [CrossRef] [MathSciNet] [Google Scholar]
- Duchêne, G., & Kraus, A. 2013, ARA&A, 51, 269 [Google Scholar]
- Espaillat, C., D’Alessio, P., Hernández, J., Nagel, E., et al. 2010, ApJ, 717, 441 [NASA ADS] [CrossRef] [Google Scholar]
- Espaillat, C., Furlan, E., D’Alessio, P., et al. 2011, ApJ, 728, 49 [NASA ADS] [CrossRef] [Google Scholar]
- Espaillat, C., Ingleby, L, Hernández, J., Furlan, E., et al. 2012, ApJ, 747, 103 [NASA ADS] [CrossRef] [Google Scholar]
- Espinoza, P., Selman, F. J., & Melnick, J. 2009, A&A, 501, 563 [NASA ADS] [CrossRef] [EDP Sciences] [Google Scholar]
- Fatuzzo, M., & Adams, F. C. 2008, ApJ, 675, 1361 [NASA ADS] [CrossRef] [Google Scholar]
- Figer, D. F., McLean, I. S., & Morris, M. 1999, ApJ, 514, 202 [NASA ADS] [CrossRef] [Google Scholar]
- Fritz, T., Gillessen, S., Trippe, S., et al. 2010, MNRAS, 401, 1177 [NASA ADS] [CrossRef] [Google Scholar]
- Fruchter, A. S., & Hook, R. N. 2002, PASP, 114, 144 [NASA ADS] [CrossRef] [Google Scholar]
- Fruchter, A., Sosey, M., Hack, W., Dressel, L., et al. 2009, The MultiDrizzle Handbook, version 3.0 (Baltimore, STScI) [Google Scholar]
- Furlan, E., Watson, D. M., McClure, M. K., et al. 2009, ApJ, 703, 1964 [NASA ADS] [CrossRef] [Google Scholar]
- Fujiwara, H., Ishihara, D., Onaka, T., Takita, S., et al. 2013, A&A, 550, A45 [NASA ADS] [CrossRef] [EDP Sciences] [Google Scholar]
- Ghez, A. M. G., Salim, S., Weinberg, N. N., et al. 2008, ApJ, 689, 1044 [NASA ADS] [CrossRef] [Google Scholar]
- Gorti, U., Dullemond, C. P., & Hollenbach, D. 2009, ApJ, 705, 1237 [NASA ADS] [CrossRef] [Google Scholar]
- Granada, A., Eckström, S., Georgy, C., Krtička, J., et al. 2013, A&A, 553, A25 [NASA ADS] [CrossRef] [EDP Sciences] [Google Scholar]
- Habibi, H. 2014, Ph.D. Thesis, University of Bonn, Germany [Google Scholar]
- Habibi, M., Stolte, A., Brandner, W., Hußmann, B., & Motohara, K. 2013, A&A, 556, A26 [NASA ADS] [CrossRef] [EDP Sciences] [Google Scholar]
- Haisch, K. E., Jr., Lada, E. A., & Lada, C. J. 2001, ApJ, 553, L153 [NASA ADS] [CrossRef] [Google Scholar]
- Harayama, Y., Eisenhauer, F., & Martins, F. 2008, ApJ, 675, 1319 [NASA ADS] [CrossRef] [Google Scholar]
- Harfst, S., Portegies Zwart, S., & Stolte, A. 2010, MNRAS, 409, 628 [NASA ADS] [CrossRef] [Google Scholar]
- Hartmann, L. 2000, Accretion Processes in Star Formation, 1st paperback edition, (New York: Cambridge University Press) [Google Scholar]
- Hernández, J., Calvet, N., Hartmann, L., Briceño, C., et al. 2005, ApJ, 652, 472 [Google Scholar]
- Hernández, J., Hartmann, L, Megeath, T., et al. 2007, ApJ, 662, 1067 [NASA ADS] [CrossRef] [Google Scholar]
- Hillenbrand, L. A., Strom, S. E., Calvet, N., et al. 1998, AJ, 116, 1816 [NASA ADS] [CrossRef] [Google Scholar]
- Hodgkin, S. T., Irwin, M. J., Hewett, P. C., & Warren, S. J. 2009, MNRAS, 394, 675 [NASA ADS] [CrossRef] [Google Scholar]
- Hoffmeister, V. H., Chini, R., Scheyda, C. M., et al. 2006, A&A, 457, L29 [NASA ADS] [CrossRef] [EDP Sciences] [Google Scholar]
- Hollenbach, D., Johnstone, D., Lizano, S., & Shu, F. 1994, ApJ, 428, 654 [NASA ADS] [CrossRef] [Google Scholar]
- Hußmann, B. 2014, Ph.D. Thesis, University of Bonn, http://hss.ulb.uni-bonn.de/2014/3485/3485.htm [Google Scholar]
- Hußmann, B., Stolte, A., Brandner, W., Gennaro, M., & Liermann, A. 2012, A&A, 540, A57 [NASA ADS] [CrossRef] [EDP Sciences] [Google Scholar]
- Indebetouw, R., Mathis, J. S., Babler, B. L., et al. 2005, ApJ, 619, 931 [NASA ADS] [CrossRef] [Google Scholar]
- Johnstone, D., Hollenbach, D., & Bally, J. 1998, ApJ, 499, 758 [NASA ADS] [CrossRef] [Google Scholar]
- Koekemoer, A., Fruchter, A., Hook, R., & Hack, W. 2002, HST Calibration Workshop, 337 [Google Scholar]
- Kraus, A. L., Ireland, M. J., Hillenbrand, L. A., & Martinache, F. 2012, ApJ, 745, 19 [NASA ADS] [CrossRef] [Google Scholar]
- Kraus, M., Oksala, M. E., Nickeler, D. H., et al. 2013, A&A, 549, A28 [NASA ADS] [CrossRef] [EDP Sciences] [Google Scholar]
- Lawrence, A., Warren, S. J., Almaini, O., et al. 2007, MNRAS, 379, 1599 [NASA ADS] [CrossRef] [MathSciNet] [Google Scholar]
- Lejeune, T., & Schaerer, D. 2001, A&A, 366, 538 [NASA ADS] [CrossRef] [EDP Sciences] [Google Scholar]
- Lenzen, R., Hartung, M., Brandner, W., et al. 2003, SPIE, 4841, 944 [Google Scholar]
- Liermann, A., Hamann, W.-R., & Oskinova, L. M. 2009, A&A, 494, 1137 [NASA ADS] [CrossRef] [EDP Sciences] [Google Scholar]
- Liermann, A., Hamann, W.-R., Oskinova, L. M., Todt, H., & Butler, K. 2010, A&A, 524, A82 [NASA ADS] [CrossRef] [EDP Sciences] [Google Scholar]
- Liermann, A., Hamann, W.-R., & Oskinova, L. M. 2012, A&A, 540, A14 [NASA ADS] [CrossRef] [EDP Sciences] [Google Scholar]
- Lucas, P. W., Hoare, M. G., Longmore, A., et al. 2008, MNRAS, 391, 136 [NASA ADS] [CrossRef] [Google Scholar]
- Maaskant, K. M., Honda, M., Waters, L. B. F. M., et al. 2013, A&A, 555, A64 [NASA ADS] [CrossRef] [EDP Sciences] [Google Scholar]
- Maercker, M., & Burton, M. G. 2005, A&A, 438, 663 [NASA ADS] [CrossRef] [EDP Sciences] [Google Scholar]
- Maercker, M., Burton, M. G., & Wright, C. M. 2006, A&A, 450, 253 [NASA ADS] [CrossRef] [EDP Sciences] [Google Scholar]
- Martins, F., Hillier, D. J., Paumard, T., et al. 2008, A&A, 478, 219 [NASA ADS] [CrossRef] [EDP Sciences] [Google Scholar]
- Mathis, J. S., Rumpl, W., & Nordsieck, K. H., 1977, ApJ, 217, 425 [NASA ADS] [CrossRef] [Google Scholar]
- Moór, A., Ábrahám, P., Juhász, A., et al. 2011, ApJ, 740, L7 [NASA ADS] [CrossRef] [Google Scholar]
- Muzerolle, J., Allen, L. E., Megeath, S. T., Hernndez, J., & Gutermuth, R. A. 2010, ApJ, 708, 1107 [NASA ADS] [CrossRef] [Google Scholar]
- Najarro, F., Figer, D. F., Hillier, D. J., & Kudritzki, R. P. 2004, ApJ, 611, L105 [NASA ADS] [CrossRef] [Google Scholar]
- Nishiyama, S., Tamura, M., Hatano, H., et al. 2009, ApJ, 696, 1407 [NASA ADS] [CrossRef] [Google Scholar]
- Olczak, C., Kaczmarek, T., Harfst, S., Pfalzner, S., & Portegies Zwart, S. 2012, ApJ, 756, 123 [NASA ADS] [CrossRef] [Google Scholar]
- Owen, J. E., Clarke, C. J., & Ercolano, B. 2011, MNRAS, 422, 1880 [Google Scholar]
- Richling, S., & Yorke, H. W. 2000, ApJ, 539, 258 [NASA ADS] [CrossRef] [Google Scholar]
- Rousset, G., Lacombe, F., Puget, P., et al. 2003, SPIE, 4839, 140 [Google Scholar]
- Sana, H., de Mink, S. E., de Koter, A., et al. 2012, Science, 337, 444 [Google Scholar]
- Scally, A., & Clarke, C. J. 2001, MNRAS, 325, 449 [Google Scholar]
- Schlegel, D. J., Finkbeiner, D. P., & Davis, M. 1998, ApJ, 500, 525 [NASA ADS] [CrossRef] [Google Scholar]
- Schneider, F. R. N., Izzard, R. G., de Mink, S. E., et al. 2014, ApJ, 780, 117 [NASA ADS] [CrossRef] [Google Scholar]
- Silaj, J., Jones, C. E., Tycner, C., Sigut, T. A. A., & Smith, A. D. 2010, ApJS, 187, 228 [NASA ADS] [CrossRef] [Google Scholar]
- Stetson, P. B. 1992, ASP Conf. Ser., 25, 297 [Google Scholar]
- Stolte, A., Grebel, E. K., Brandner, W., & Figer, D. F. 2002, A&A, 394, 459 [NASA ADS] [CrossRef] [EDP Sciences] [Google Scholar]
- Stolte, A., Brandner, W., Brandl, B., Zinnecker, H., & Grebel, E. K. 2004, AJ, 128, 765 [NASA ADS] [CrossRef] [Google Scholar]
- Stolte, A., Ghez, A. M., Morris, M., et al. 2008, ApJ, 675, 1278 [NASA ADS] [CrossRef] [Google Scholar]
- Stolte, A., Morris, M. R, Ghez, A. M., et al. 2010, ApJ, 718, 810 [NASA ADS] [CrossRef] [Google Scholar]
- Teixeira, P. S., Lada, C. J., Marengo, M., & Lada, E. A. 2012, A&A, 540, A83 [NASA ADS] [CrossRef] [EDP Sciences] [Google Scholar]
- Tokunaga, A., & Vacca, W. 2005, PASP, 117, 421 [NASA ADS] [CrossRef] [Google Scholar]
- Trippe, S., Gillessen, S., Gerhard, O. E., et al. 2008, A&A, 492, 419 [NASA ADS] [CrossRef] [EDP Sciences] [Google Scholar]
- Wheelwright, H. E., de Wit, W. J., Weigelt, G., Oudmaijer, R. D., & Ilee, J. D. 2012, A&A, 543, A77 [NASA ADS] [CrossRef] [EDP Sciences] [Google Scholar]
- Williams, J. P., & Cieza, L. A. 2011, ARA&A, 49, 67 [NASA ADS] [CrossRef] [Google Scholar]
- Yelda, S., Lu, J. R., Ghez, A. M., et al. 2010, ApJ, 725, 331 [NASA ADS] [CrossRef] [Google Scholar]
All Tables
Photometric sensitivity limits (in calibrated magnitudes), estimated from the peak of the luminosity functions, and number of sources in matched JHKs and JHKsL′ catalogues.
All Figures
|
Fig. 1 WFC3 JH colour composite of the Quintuplet cluster (left panel) and Arches cluster (right panel) covered with both HST/WFC3 and NACO observations. The NACO fields are shown as boxes. L-band excess sources detected in both clusters are overlaid as circles. Previously detected excess sources in the Arches are shown as smaller cyan circles. Excess sources in the cluster centres are circumscribed in blue for clarity. |
| In the text | |
|
Fig. 2 NACO Ks mosaic of fields in the Quintuplet (left) and Arches (right) clusters. The same fields are approximately covered in L′. In the Arches cluster, Field 2 is not shown and is located to the lower right of the cluster (see Fig. 1). Disc candidates are indicated in both clusters as white circles. Yellow circles in the Quintuplet mark disc candidates fainter than the completeness limit of J = 22 mag in the left panel. Previously known disc candidates in the Arches detected in our earlier higher-resolution Keck/NIRC2 observations are included for comparison as smaller cyan circles in the right panel (Stolte et al. 2010). The star serving as coordinate reference for all catalogues is indicated by the arrow. |
| In the text | |
|
Fig. 3 Photometric uncertainties of the NACO Ks and L′ observations of the Quintuplet cluster for Fields 1 through 5 (top to bottom). The left panels show the first epoch and the middle panels the second epoch Ks uncertainties for the two epochs from which proper motions were derived. The Ks photometry in Field 1 was combined from short and long exposures, with a saturation transition at Ks = 14 mag. The transition is marked by the prominent improvement in photometric performance in the long exposure data. L′ photometric uncertainties (right panels) indicate the large differences in performance in the L′ observations due to thermal background variations. While Fields 2, 3, and 5 show comparable sensitivities, Field 4 is compromised by background fluctuations. Field 1 features significantly deeper photometry, such that the L′ selection was truncated at L′< 15 mag to obtain the excess fraction consistently across the entire cluster area. |
| In the text | |
|
Fig. 4 Photometric uncertainties of the NACO Ks and L′ observations of the Arches cluster for Fields 1 through 5 (top to bottom). The left panels show the first epoch and the middle panels the second epoch Ks uncertainty for the two epochs from which proper motions were derived. The photometric uncertainties of the first epoch are daophot PSF fitting uncertainties, and are not derived from multiple measurements. As in the case of the Quintuplet cluster, L′ photometric uncertainties (right panels) indicate the differences in performance in the L′ observations due to thermal background variations. The sensitivity limits show more consistency than in the Quintuplet, with a detection threshold of L′ ~ 14.5−15.0 mag. The larger scatter in Fields 3 and 5 is caused by background fluctuations. |
| In the text | |
|
Fig. 5 Proper motion uncertainties of stars in the Quintuplet (left) and Arches (right) clusters for Fields 1 through 5 (top to bottom) in each cluster. The proper motion uncertainties include the astrometric uncertainties from each individual epoch in addition to the standard deviation in the geometric transformation from epoch 2 to epoch 1. The deeper Ks observations in the central Quintuplet field provide good astrometric accuracies down to Ks ~ 19 mag, while Fields 2–5 are truncated at Ks = 17.5 mag (dashed lines), beyond which astrometric accuracies degrade. The wide spread in Quintuplet Field 1 is caused by crowding. For the purposes of membership derivation, only sources with Ks< 18 mag (dashed line) are used in Field 1 for compatibility with the outer fields. In most Arches fields (right panels), the astrometric accuracies are small down to Ks ~ 18 mag, with the exception of Field 2, where proper motion derivations are limited to Ks< 17 mag. |
| In the text | |
|
Fig. 6 Comparison of proper motion values derived in our 2010 disc paper of the central Arches field and in this study. Differences in the proper motion are shown individually in the right ascension (left) and declination (right) directions. The consistency between the blue and red samples reveals the similarity between the membership selection used to derive the central disc fraction in Stolte et al. (2010, red asterisks) and in this work (blue diamonds). Non-members are shown as black dots. The majority of stars in the common sample shows proper motion differences below 0.5 mas/yr, almost identical to the relative astrometric uncertainties in Arches Field 1 shown in Fig. 5. Faint stars (Ks< 16 mag) show larger motion differences, as expected from their higher astrometric uncertainties. |
| In the text | |
|
Fig. 7 Proper motion diagram of the central field of the Quintuplet cluster. The circle around the origin indicates the selection of cluster members. L-band detected proper motion members are shown in green, while non-members are shown in red. Black sources are not detected in L′. Those sources are cluster members if located inside the green circle. L′ excess sources are marked as red diamonds, while Wolf-Rayet candidates are shown in blue (see Sect. 4.1). The right panel displays a zoom on the cluster selection and the median astrometric uncertainty for L-band detected members in the lower left corner. |
| In the text | |
|
Fig. 8 Proper motion diagram of the central field of the Arches cluster. The circle denotes the selection limit for cluster members. Members with L′ detections are highlighted in green, while L′-detected non-members are shown in red. As already found in Stolte et al. (2010), all excess sources recovered in the cluster centre are proper motion members of the Arches. The right panel displays a zoom on the cluster selection and the median astrometric uncertainty for L-band detected members in the lower left corner. |
| In the text | |
|
Fig. 9 Proper motion histogram of stars in the central fields of the Quintuplet (left) and Arches (right) clusters. The motion parallel to the Galactic plane (black) shows a pronounced tail of field sources, as indicated in the proper motion diagram (Figs. 7 and 8), while the motion perpendicular to the plane (red histograms) is dominated by the velocity dispersion. The Gaussian fit to the latitude motion (red solid lines) in Field 1 provides the 3σ criterion for selecting cluster members in both central fields. In the case of the Arches cluster, the same membership criterion is imposed in all outer fields. |
| In the text | |
|
Fig. 10 Photometric uncertainties of the WFC3 J and H photometry for each Quintuplet field after matching with NACO Ks. The apparent differences in the detection limits reflect the different Ks sensitivities of the first epoch NACO observations. |
| In the text | |
|
Fig. 11 Photometric uncertainties of the WFC3 J and H photometry for each Arches field after matching with NACO Ks. The apparent differences in the detection limits reflect the different Ks sensitivities of the NACO observations in each field which determine the depth of the J,J − Ks CMDs. |
| In the text | |
|
Fig. 12 Quintuplet luminosity functions of all filters (left: JHKs, right: L′). All JHKs luminosity functions are shown for the combined sample used for the main-sequence source counts. These luminosity functions therefore indicate the limitations of the source counts in the final JHKs and JHKsL′ catalogues relevant for the main-sequence and excess samples here, and not the true detection limits in each filter. The Ks luminosity functions are shown for both proper motion epochs used for membership derivation. Likewise, the L′ luminosity functions are derived from the matched JHKsL′ source lists used for further analysis. The dashed line in the L′ luminosity function in Field 1 indicates the truncation imposed when combining F1 with the outer fields. The dashed lines in the L′ luminosity functions in Fields 2 and 5 indicate the faintest L-excess source in each field. Except for Field 4, all L′ data sets extend towards or beyond a sensitivity of L′ = 15.0 mag. |
| In the text | |
|
Fig. 13 Arches luminosity functions of all filters (left: JHKs, right: L′). The Ks luminosity functions are shown for both proper motion epochs used for membership derivation. The detection limits in the WFC3 JH observations are comparable to those obtained in the Quintuplet, yet the absolute number of sources matched with Ks is limited by the shallower Arches NACO photometry caused by the fainter guide stars and required adaptive optics observing mode. The dashed lines in the L′ luminosity functions indicate the faintest L′-excess source in each field. In Arches Field 2, no cluster member with circumstellar disc emission is detected. All L′ data sets show a sensitivity limit close to L′ = 15.0 mag, fainter than the faintest detected excess source in each field. |
| In the text | |
|
Fig. 14 Incompleteness fractions and fitted polynomials for the main-sequence reference samples (left panels) are shown vs. the J-band magnitude. Artificial stars were matched in JHKs prior to the derivation of the displayed completeness fractions. For the excess source populations (right panels), incompleteness fractions and fits are shown vs. the L′-band magnitude for all artificial stars recovered in JHKs and L′ simultaneously. The top panels show the completeness fractions in the Quintuplet cluster, while the bottom panels refer to the Arches observations. Thick bars in the top of the L-band panels represent the range of L′ magnitudes observed in the excess sources in each field. |
| In the text | |
|
Fig. 15 J − H,Ks − L′ colour–colour diagram of the central field of the Quintuplet cluster. The solid black line depicts the extinction vector (Nishiyama et al. 2009), and the red line is offset by 3 × the standard deviation of main-sequence cluster members without excess sources (green points). All L′ excess candidates are labelled (diamonds), with Wolf-Rayet candidates shown in blue (Ks< 12 mag), while fainter excess sources marked in red are candidates for circumstellar disc emission. Non-cluster members are shown in red, and black symbols depict sources with unknown membership status. The J − H,Ks − L′ colour–colour diagrams of the outer fields can be found in Appendix (B.1). |
| In the text | |
|
Fig. 16 J, J − Ks colour–magnitude diagram of the central field of the Quintuplet cluster. L′-excess sources derived from Fig. 15 are marked as red diamonds, while Wolf-Rayet candidates are marked in blue. Proper motion members are shown in green, while non-members are shown in red and sources with unknown membership in black. The imposed magnitude limit to allow for proper-motion member selection, Ks< 17.5 mag, is shown as a dotted line. The horizontal dashed line marks the J-band completeness limit at J = 22 mag above which the combined cluster excess fraction was derived. The vertical dashed lines indicate the main-sequence colour selection applied in addition to the proper motion membership criterion to select the main-sequence reference sample to calculate the disc fraction. The J, J − Ks colour–magnitude diagrams of the outer fields can be found in Appendix (B.3). |
| In the text | |
|
Fig. 17 Ks, Ks − L′ colour–magnitude diagram of the Quintuplet cluster centre. All sources are labelled as in Fig. 16. One faint L′ detection has no membership information, but is consistent with the remainder of the excess sources regarding its Ks − L′ colour. The Ks, Ks − L′ colour–magnitude diagrams of the outer fields can be found in Appendix (B.5) |
| In the text | |
|
Fig. 18 J − H,Ks − L′ colour–colour diagram of the central field of the Arches cluster. The solid black line depicts the extinction vector (Nishiyama et al. 2009), and the red line is offset by 3 × the standard deviation of main-sequence cluster members (green points) without excess sources. Excess sources fainter than Ks = 12 mag marked as red diamonds are candidates for circumstellar disc emission. Non-cluster members are shown in red; black symbols depict sources with unknown membership status. As many of the excess sources in the cluster centre are located close to brighter stars because of the high stellar density in the cluster core, only 7 of the 23 L-band excess sources found in our Keck investigation (Stolte et al. 2010) are detected in the lower-resolution NACO images (green asterisks). At larger radii, the fraction of excess sources is expected to be more complete owing to the less severe crowding effects. The J − H,Ks − L′ colour–colour diagrams of the outer fields can be found in Appendix (B.2). |
| In the text | |
|
Fig. 19 J, J − Ks colour–magnitude diagram of the central field of the Arches cluster. L′-excess sources derived from Fig. 18 are marked as red diamonds. Proper motion members are shown in green, non-members are shown in red, and sources with unknown membership in black. The imposed magnitude limit to allow for proper-motion member selection, Ks< 17.5 mag, is shown as the dotted line. The horizontal dashed line marks the J-band completeness limit at J = 22 mag above which the combined cluster excess fraction was derived. The dashed vertical lines indicate the main-sequence colour selection applied in addition to the proper motion membership criterion to select the main-sequence reference sample to calculate the excess fraction. The location of the red diamonds near the main sequence shows most prominently that several L′-excess sources do not show excess emission at Ks. The J, J − Ks colour–magnitude diagrams of the outer fields can be found in Appendix (B.4). |
| In the text | |
|
Fig. 20 Ks, Ks − L′ colour–magnitude diagram of the central field of the Arches cluster. All sources are labelled as in Fig. 19. A pronounced cluster main sequence composed of proper motion members (green) is seen in this central field. The Ks, Ks − L′ colour–magnitude diagrams of the outer fields can be found in Appendix (B.5). |
| In the text | |
|
Fig. 21 Disc fraction as a function of cluster age, extracted from Haisch et al. (2001) (NGC 2024, Trapezium, IC 348, NGC 2264, NGC 2362, Taurus, Chamaeleon I), Hernández et al. (2007) (σ Ori), Hoffmeister et al. (2006) (M 17: NGC 6618), Maercker & Burton (2005) (30 Dor region), and Maercker et al. (2006) (NGC 3576: RCW 57). All disc fractions are derived from L-band excesses with the exception of σ Ori, where IRAC SED slopes were used to select optically thick discs. Symbols are scaled to the logarithm of the cluster mass, from the least massive with ~ 200 M⊙ in stars (NGC 2024, IC 348, σ Ori), to the most massive with > 30 000 M⊙ (30 Dor, see Stolte et al. 2010 for details). Black and red circles mark disc fractions derived from high-mass stars of types OBA only, while blue (light grey) circles mark populations dominated by low-mass stars. The three starburst clusters Arches, Quintuplet, and NGC 3603 are highlighted in red. The 30 Dor disc fraction covers the extended HII region, including star-forming ridges harbouring YSO candidates, but does not resolve the central cluster, and is therefore an upper limit to the disc fraction in this environment. The dash-dotted line corresponds to the linear decrease in disc fraction vs. cluster age suggested by Haisch et al. (lighter circles only). The dotted line represents the same relation, shifted to lower ages and disc fractions, indicating that disc depletion progresses more rapidly in the most massive clusters. The error bars in the disc fraction represent radial variations in those clusters where a radial dependence is observed (see also Stolte et al. 2010). In the case of the Arches and NGC 3603, the downward arrow indicates the radial decrease in the fraction of discs from larger radii toward the cluster core (NGC 3603 outer cluster region: Stolte et al. 2004; resolved core: Harayama et al. 2008). |
| In the text | |
|
Fig. 22 Radial distribution of disc host star masses, as derived from the J-band luminosity and a 2.5 Myr (Arches, top panel) and 4 Myr (Quintuplet, bottom panel) Geneva isochrone. Green symbols mark proper motion members, red symbols non-members, and black symbols represent stars without membership information. |
| In the text | |
|
Fig. A.1 Proper motion diagrams of the Quintuplet fields beyond the cluster centre. L-band excess sources are marked as red diamonds, while Wolf-Rayet candidates are shown in blue. The criterion for cluster member selection (circle) depends on the astrometric quality of each data set and on the corresponding dispersion in the cluster population around the origin. For the outer Quintuplet fields exclusively, membership probabilities were used to distinguish cluster members from field stars. The indicated membership criterion is therefore approximate, as the probabilities account for individual astrometric uncertainties and the location of each star with respect to the cluster centre. See Fig. 7 for further details. |
| In the text | |
|
Fig. A.2 Proper motion diagrams of the outer Arches fields. Labels are described in Fig. A.1, and for further details see Fig. 8. The larger scatter observed in the Arches proper motion diagrams compared to the Quintuplet proper motions is a consequence of the shallower Arches NACO photometry and mitigated adaptive optics performance. The circles indicate the membership selection criterion as derived from the central field in Fig. 9. |
| In the text | |
|
Fig. B.1 J − H,Ks − L′ colour–colour diagrams of the Quintuplet outer fields. Proper motion members are shown in green, while non-members are shown in red. The black line denotes the extinction vector (Nishiyama et al. 2009). The red solid line shifted parallel to the reddening vector marks the 3σ selection criterion for L-band excess sources (red diamonds). Wolf-Rayet candidates (Ks< 12 mag) are marked in blue, while fainter excess sources marked as red diamonds are candidates for circumstellar disc emission. The J − H,Ks − L′ diagram of the Quintuplet central field can be found in Fig. 15. |
| In the text | |
|
Fig. B.2 J − H,Ks − L′ colour–colour diagrams of the Arches outer fields. Labels are as described in Fig. B.1, and the J − H,Ks − L′ diagram of the Arches central field is shown in Fig. 18. |
| In the text | |
|
Fig. B.3 J, J − Ks colour–magnitude diagrams of the Quintuplet outer fields. Proper motion members are shown in green, while non-members are shown in red. Disc and Wolf-Rayet candidates are also marked. The diagonal overdensity at J ~ 20 mag marks the onset of the red clump. The dotted lines mark the Ks = 17.5 mag boundary for proper motion member selection. The horizontal dashed line indicates the J = 22 mag limit, above which the combined cluster disc fractions are derived. The main-sequence selection is indicated by vertical dashed lines. The variation in main-sequence colour between fields is caused by the locally varying extinction across the cluster area. The J, J − Ks diagram of the central Quintuplet field is shown in Fig. 16. |
| In the text | |
|
Fig. B.4 J, J − Ks colour–magnitude diagrams of the Arches outer fields. Labels are as described in Fig. B.3, and the J, J − Ks diagram of the Arches central field is shown in Fig. 19. The variation in main-sequence colour between fields caused by the locally varying extinction is more pronounced than in the Quintuplet fields. Notably, several L′-excess sources do not show excess emission at Ks. |
| In the text | |
|
Fig. B.5 Ks, Ks − L′ colour–magnitude diagrams of the Quintuplet outer fields. Labels are as in the previous figures, and the Ks, Ks − L′ diagram of the central Quintuplet field can be found in Fig. 17. A distinct main sequence of cluster members can be seen in Field 2 (top left panel), while in all other fields the proper motion information is required to exhibit the rare cluster stars at these increasing radii. |
| In the text | |
|
Fig. B.6 Ks, Ks − L′ colour–magnitude diagrams of the Arches outer fields. Labels are as in the previous figures, and the Ks, Ks − L′ diagram of the central Arches field can be found in Fig. 20. While a pronounced main sequence is observed in the central field, in all outer fields the proper motion membership provides the best evidence for the distinction between cluster and field samples. |
| In the text | |
Current usage metrics show cumulative count of Article Views (full-text article views including HTML views, PDF and ePub downloads, according to the available data) and Abstracts Views on Vision4Press platform.
Data correspond to usage on the plateform after 2015. The current usage metrics is available 48-96 hours after online publication and is updated daily on week days.
Initial download of the metrics may take a while.