Fig. 15
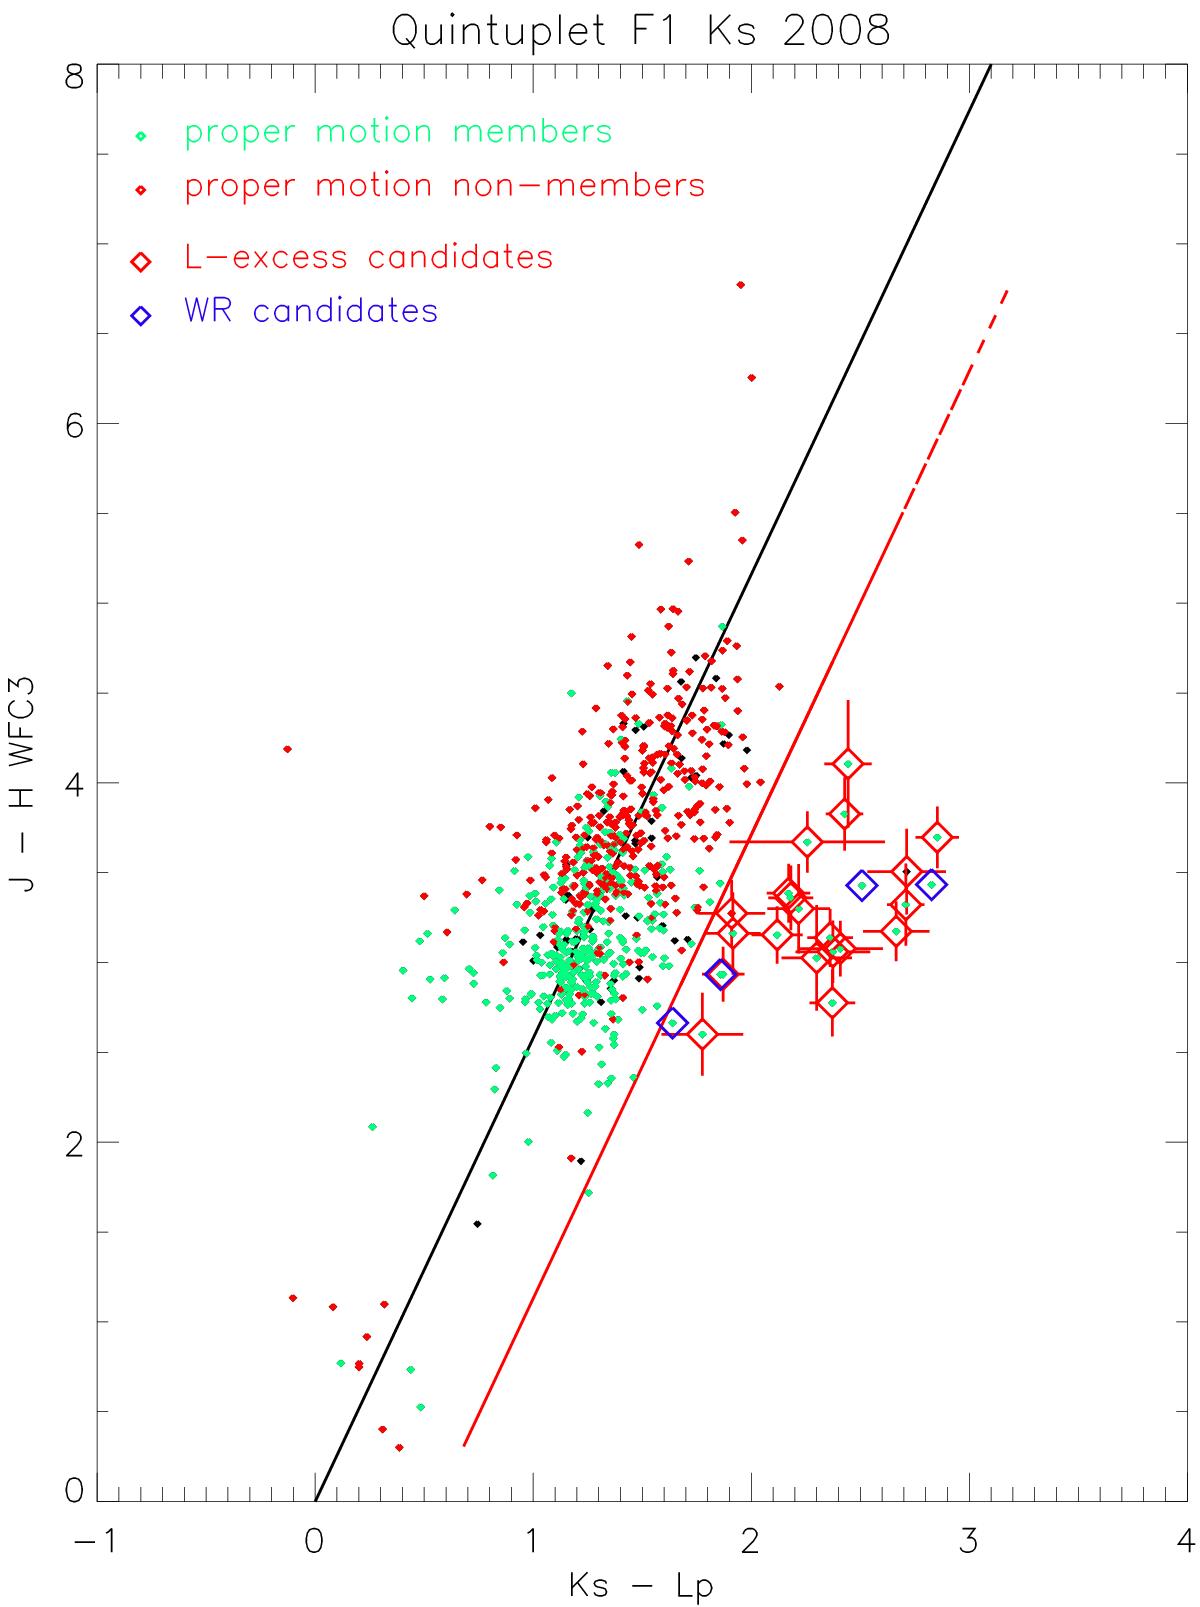
J − H,Ks − L′ colour–colour diagram of the central field of the Quintuplet cluster. The solid black line depicts the extinction vector (Nishiyama et al. 2009), and the red line is offset by 3 × the standard deviation of main-sequence cluster members without excess sources (green points). All L′ excess candidates are labelled (diamonds), with Wolf-Rayet candidates shown in blue (Ks< 12 mag), while fainter excess sources marked in red are candidates for circumstellar disc emission. Non-cluster members are shown in red, and black symbols depict sources with unknown membership status. The J − H,Ks − L′ colour–colour diagrams of the outer fields can be found in Appendix (B.1).
Current usage metrics show cumulative count of Article Views (full-text article views including HTML views, PDF and ePub downloads, according to the available data) and Abstracts Views on Vision4Press platform.
Data correspond to usage on the plateform after 2015. The current usage metrics is available 48-96 hours after online publication and is updated daily on week days.
Initial download of the metrics may take a while.