Fig. 21
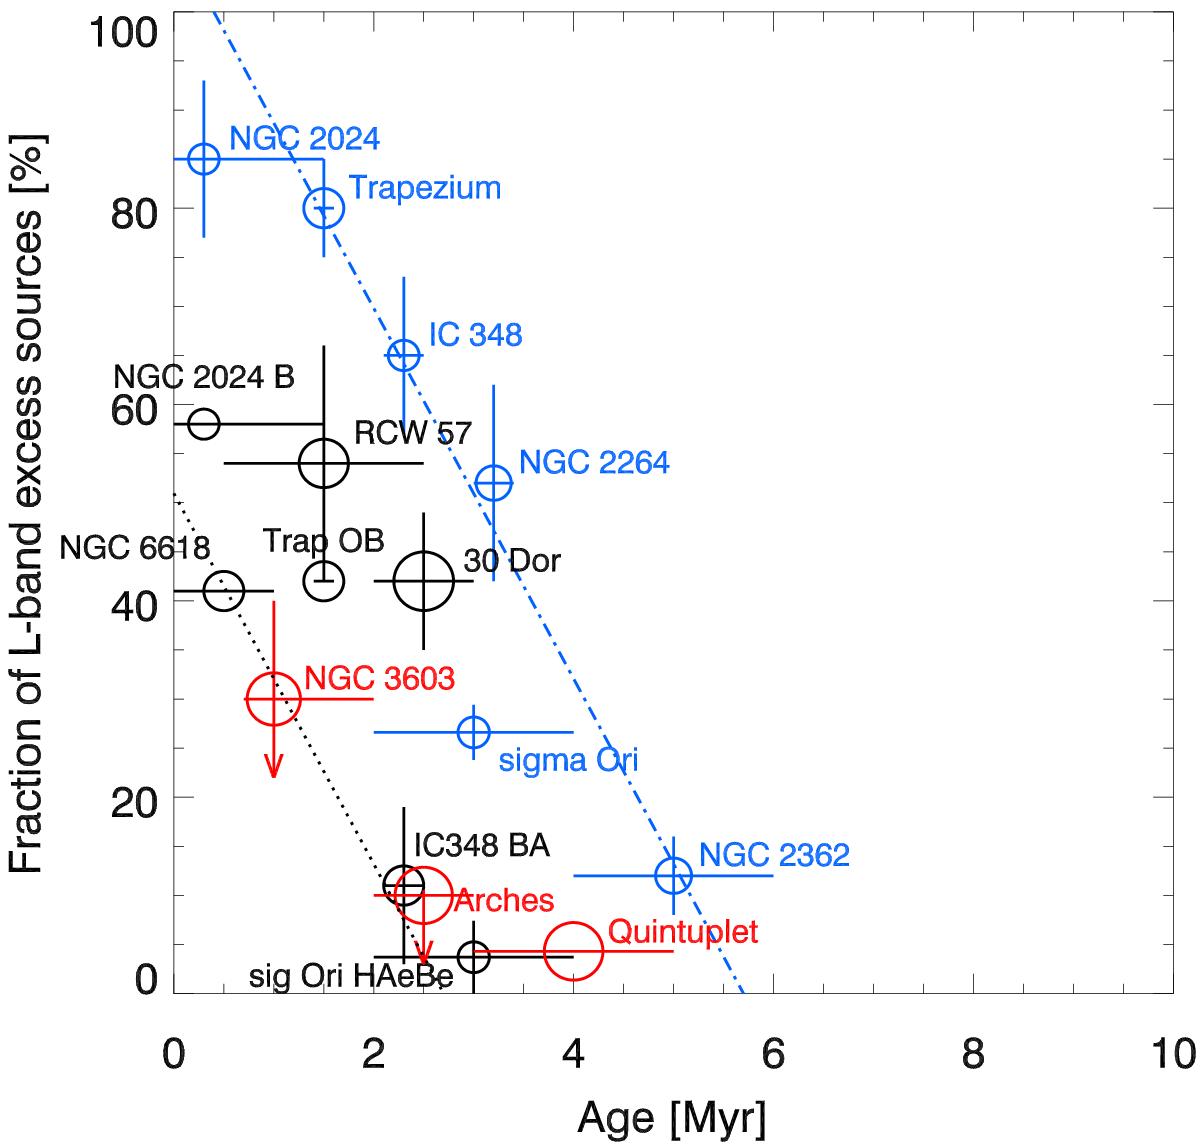
Disc fraction as a function of cluster age, extracted from Haisch et al. (2001) (NGC 2024, Trapezium, IC 348, NGC 2264, NGC 2362, Taurus, Chamaeleon I), Hernández et al. (2007) (σ Ori), Hoffmeister et al. (2006) (M 17: NGC 6618), Maercker & Burton (2005) (30 Dor region), and Maercker et al. (2006) (NGC 3576: RCW 57). All disc fractions are derived from L-band excesses with the exception of σ Ori, where IRAC SED slopes were used to select optically thick discs. Symbols are scaled to the logarithm of the cluster mass, from the least massive with ~ 200 M⊙ in stars (NGC 2024, IC 348, σ Ori), to the most massive with > 30 000 M⊙ (30 Dor, see Stolte et al. 2010 for details). Black and red circles mark disc fractions derived from high-mass stars of types OBA only, while blue (light grey) circles mark populations dominated by low-mass stars. The three starburst clusters Arches, Quintuplet, and NGC 3603 are highlighted in red. The 30 Dor disc fraction covers the extended HII region, including star-forming ridges harbouring YSO candidates, but does not resolve the central cluster, and is therefore an upper limit to the disc fraction in this environment. The dash-dotted line corresponds to the linear decrease in disc fraction vs. cluster age suggested by Haisch et al. (lighter circles only). The dotted line represents the same relation, shifted to lower ages and disc fractions, indicating that disc depletion progresses more rapidly in the most massive clusters. The error bars in the disc fraction represent radial variations in those clusters where a radial dependence is observed (see also Stolte et al. 2010). In the case of the Arches and NGC 3603, the downward arrow indicates the radial decrease in the fraction of discs from larger radii toward the cluster core (NGC 3603 outer cluster region: Stolte et al. 2004; resolved core: Harayama et al. 2008).
Current usage metrics show cumulative count of Article Views (full-text article views including HTML views, PDF and ePub downloads, according to the available data) and Abstracts Views on Vision4Press platform.
Data correspond to usage on the plateform after 2015. The current usage metrics is available 48-96 hours after online publication and is updated daily on week days.
Initial download of the metrics may take a while.