Fig. 18
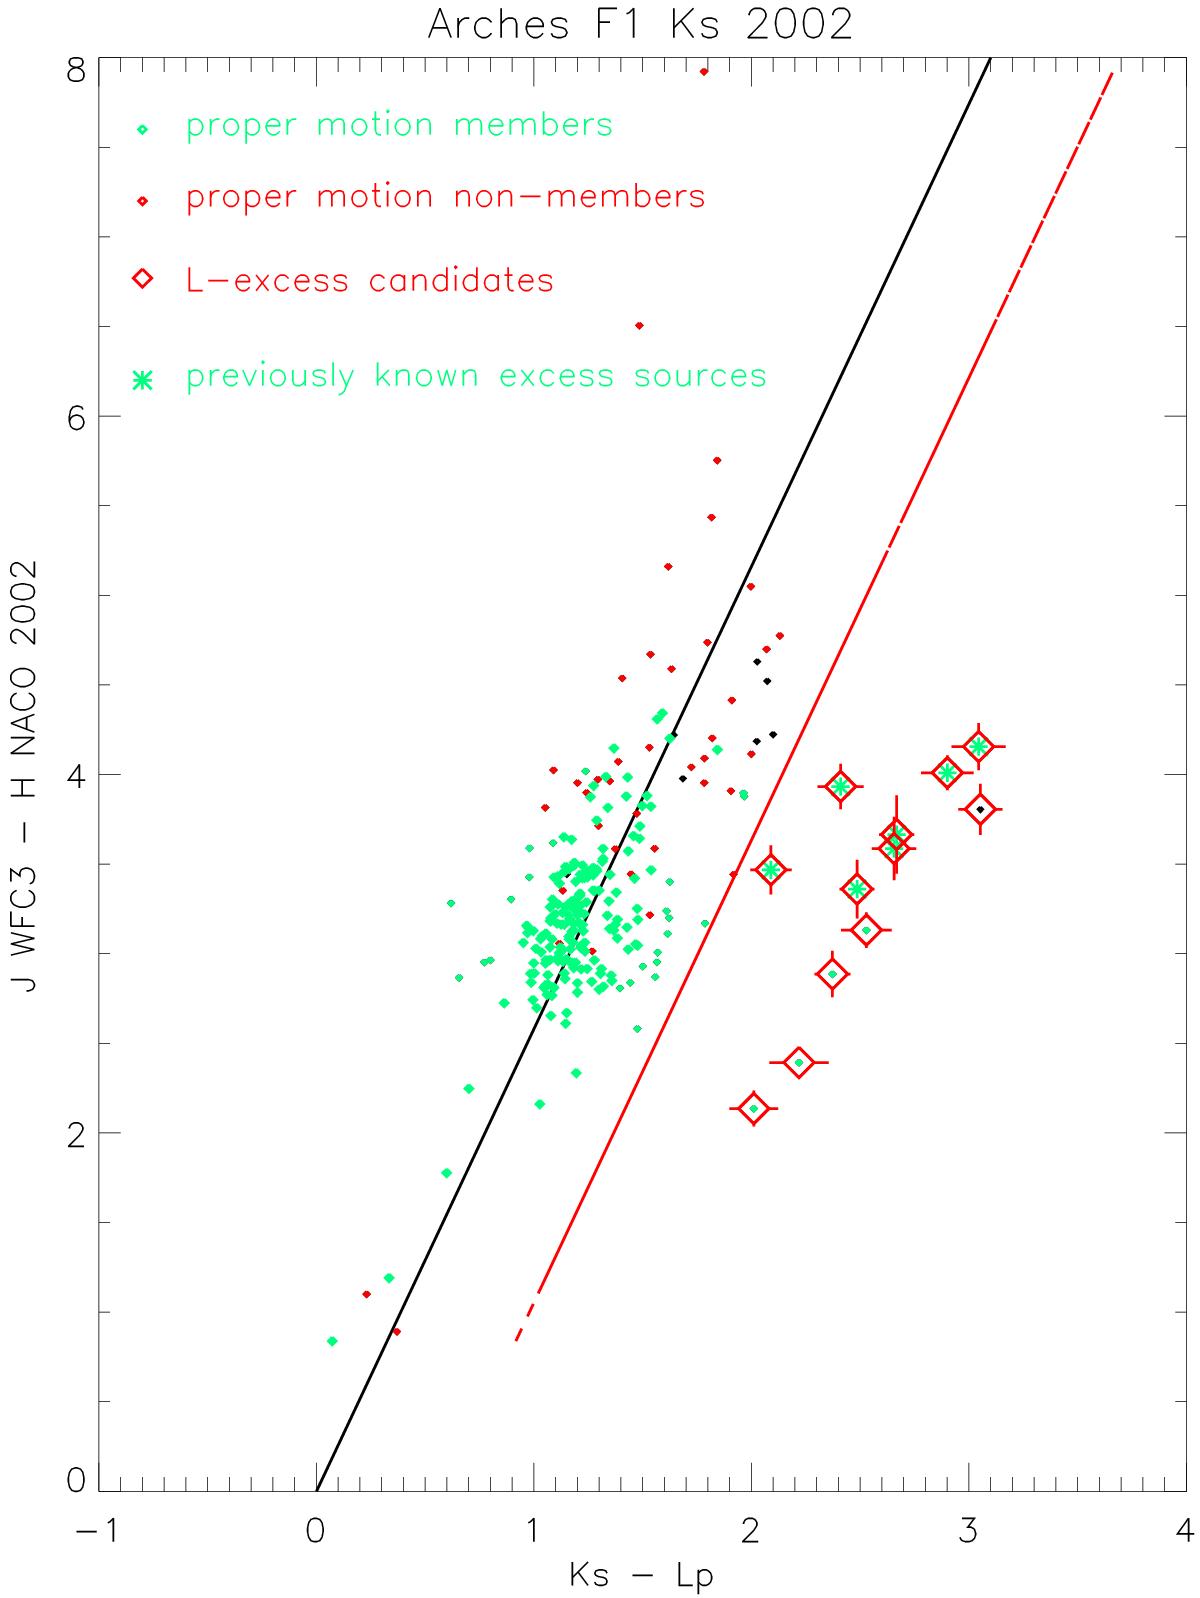
J − H,Ks − L′ colour–colour diagram of the central field of the Arches cluster. The solid black line depicts the extinction vector (Nishiyama et al. 2009), and the red line is offset by 3 × the standard deviation of main-sequence cluster members (green points) without excess sources. Excess sources fainter than Ks = 12 mag marked as red diamonds are candidates for circumstellar disc emission. Non-cluster members are shown in red; black symbols depict sources with unknown membership status. As many of the excess sources in the cluster centre are located close to brighter stars because of the high stellar density in the cluster core, only 7 of the 23 L-band excess sources found in our Keck investigation (Stolte et al. 2010) are detected in the lower-resolution NACO images (green asterisks). At larger radii, the fraction of excess sources is expected to be more complete owing to the less severe crowding effects. The J − H,Ks − L′ colour–colour diagrams of the outer fields can be found in Appendix (B.2).
Current usage metrics show cumulative count of Article Views (full-text article views including HTML views, PDF and ePub downloads, according to the available data) and Abstracts Views on Vision4Press platform.
Data correspond to usage on the plateform after 2015. The current usage metrics is available 48-96 hours after online publication and is updated daily on week days.
Initial download of the metrics may take a while.