| Issue |
A&A
Volume 574, February 2015
|
|
|---|---|---|
| Article Number | A144 | |
| Number of page(s) | 11 | |
| Section | Extragalactic astronomy | |
| DOI | https://doi.org/10.1051/0004-6361/201425086 | |
| Published online | 10 February 2015 | |
The XMM deep survey in the CDF-S
VIII. X-ray properties of the two brightest sources
1
ICREA and Institut de Ciències del Cosmos, Universitat de
Barcelona,
IEEC-UB, Martí i Franquès, 1,
08028
Barcelona,
Spain
e-mail:
This email address is being protected from spambots. You need JavaScript enabled to view it.
2
INAF – Osservatorio Astronomico di Bologna, via Ranzani,
1, 40127
Bologna,
Italy
3
Università di Bologna – Dipartimento di Astronomia,
via Ranzani, 1, 40127
Bologna,
Italy
4
Department of Astronomy and Astrophysics, The Pennsylvania State
University, 525 Davey
Lab, University
Park, PA
16802,
USA
5
Instituto de Física de Cantabria (CSIC-UC),
Avenida de los Castros,
39005
Santander,
Spain
6
University Federico II, via Cintia, Building 6, 80126
Napoli,
Italy
7
INFN Napoli, via Cintia, 80126
Napoli,
Italy
8
Dipartimento di Fisica, Università di Roma Tor
Vergata, via della Ricerca
Scientifica 1, 00133
Roma,
Italy
Received: 30 September 2014
Accepted: 11 December 2014
Abstract
We present results from the deep XMM-Newton observations of the two brightest X-ray sources in the Chandra Deep Field South (CDFS), PID 203 (z = 0.544) and PID 319 (z = 0.742). The long exposure of 2.5 Ms over a 10 year period (net 4 yr with a 6 yr gap) makes it possible to obtain high quality X-ray spectra of these two Type I AGN with X-ray luminosity of 1044 erg s-1, which is the typical luminosity for low-redshift PG quasars, and track their X-ray variability both in flux and spectral shape. Both sources showed X-ray flux variability of ~10−20% in rms, which is similar in the soft (0.5−2 keV) and hard (2−7 keV) bands. PID 203, which has evidence for optical extinction, shows modest amount of absorption (NH≤ 1 × 1021 cm-2) in the X-ray spectrum. Fe K emission is strongly detected in both objects with EW ~ 0.2 keV. The lines in both objects are moderately broad and exhibit marginal evidence for variability in shape and flux, indicating that the bulk of the line emission comes from their accretion disks rather than distant tori.
Key words: galaxies: active / X-rays: galaxies / quasars: general
© ESO, 2015
1. Introduction
X-ray spectra of active galaxies provide us with a probe of the physical conditions of the innermost part of the active nucleus. However, sufficient details of their X-ray spectra, e.g. absorption and Fe K emission, can be obtained only for nearby, bright objects with the limited sensitivity available from the X-ray telescopes currently in operation. Possible exceptions are extremely luminous quasars and objects in survey fields with very long exposures. The deep XMM-Newton observations of the Chandra Deep Field South (CDFS, Giacconi et al. 2002) with a 2.5 Ms exposure (Comastri et al. 2011) give us one of the exceptional opportunities to access to active galactic nuclei (AGN) with a moderate quasar luminosity beyond the nearby Universe. Here, we present the XMM-Newton data on the two brightest X-ray sources (fX ~ 10-13 erg s-1 cm-2) in the XMM-CDFS (Ranalli et al. 2013), PID 203 (z = 0.544) and PID 319 (z = 0.742) with the X-ray luminosities of ~1044 erg s-1 (Table 1).
These two sources are exceptionally bright among the X-ray sources in the field. In terms of source counts in the full XMM-Newton band (e.g., 0.4−10 keV) accumulated over the whole exposure, the third brightest source1 falls an order of magnitude below the other two. In order to place the two X-ray sources in context among the general AGN samples, PID 203 and PID 319 along with sources in the XMM-CDFS (Comastri et al., in prep.), Palomar-Green (PG) quasars (Piconcelli et al. 2005), Sloan Digital Sky Survey (SDSS) quasars (Strateva et al. 2005), the Catalog of AGN in the XMM-Newton Archive (CAIXA) AGN (duplicated PG quasars in Piconcelli et al. 2005 were removed; Bianchi et al. 2009) are plotted on the LX-z plane in Fig. 1. The CAIXA sample consists of bright AGN in the XMM-Newton archive, and together with the PG quasars, they represent X-ray sources with sufficient counts to warrant a reasonably constraining spectral abalysis. The SDSS quasars are another flux-limited sample of X-ray AGN. It is clear from Fig. 1 that PID 203 and PID 319 stand out from the XMM-CDFS sample, and have the typical X-ray luminosity of low- redshift (z = 0.1–0.2) PG quasars, but are located at higher redhsifts. The two sources lie in the upper envelope of the SDSS quasars, yet a detailed spectral study is still possible.
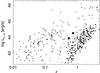 |
Fig. 1 PID 203 and PID 319 (large filled squares) are plotted along with various AGN samples on the LX–z plane: XMM-CDFS (filled squares, Comastri et al., in prep.; Ranalli et al. 2013), PG quasars (open circles, Piconcelli et al. 2005), SDSS quasars (crosses, Strateva et al. 2005), and CAIXA (filled circles, Bianchi et al. 2009). The LX is the rest-frame 2−10 keV luminosity. The monochromatic 2 keV luminosities in Strateva et al. (2005) were converted to 2−10 keV luminosities assuming a power-law spectrum of Γ = 1.8. |
Basic properties of the two XMM-CDFS sources.
Although the quality of the data does not rival that for nearby, bright AGN, it gives more than a rough spectral shape and its long-term variability, including that of their Fe K lines. The previous study of AGN Fe K line properties beyond the local Universe, in particular, resorted to a stacking analysis (e.g. Streblyanska et al. 2005; Corral et al. 2008; Iwasawa et al. 2012; Chaudhary et al. 2012; Falocco et al. 2012). These XMM-Newton data of the two CDFS sources offer reasonable quality of Fe K line data for an individual AGN at z = 0.5–0.7. The 4 Ms data of the CDFS obtained with the Chandra X-ray Observatory (Xue et al. 2011) were added for investigating the X-ray flux and Fe K line variability.
The cosmology adopted here is H0 = 70 km s-1 Mpc-1, ΩΛ = 0.72, ΩM = 0.28.
2. Observations
The CDFS was observed with XMM-Newton with 33 exposures in 2001−2002 and 2008−2010. Full details of the observations are found in Ranalli et al. (2013). We used the data taken from the three EPIC cameras (pn, MOS1 and MOS2) after the standard filtering of background flaring intervals. The net exposures, integrated counts, mean fluxes, and luminosities for the two sources are listed in Table 2.
Because of the visibility of the field, observations were performed in either summer (July−August) or winter (January−February) periods. In order to obtain sufficient quality for a spectral study, the 33 exposures were grouped into six XMM-intervals (X1-X6 in Table 3), which give a half-yr sampling of timescale in the 2008−2010 period.
The two bright X-ray sources in the field have the source identification numbers PID 203 and PID 319 in the XMM-CDFS source catalogue (Ranalli et al. 2013), for which basic information and the Chandra counterparts are listed in Table 1.
We used data from the three EPIC cameras jointly in the analysis presented below unless stated otherwise. In the pn camera, the sources fall in the chip gap in a few observations, which resulted in a shorter exposure time than the full exposure of the field. PID 203 was always observed with the two MOS cameras. After 2009, one CCD chip of the MOS1 camera lost sensitivity. PID 319 fell on that CCD chip during a few observations, reducing the exposure time. The background fraction of the total (net source + background) counts accumulated for both sources during the observations is 8−9% in the 0.5−7 keV band. We verified the stability of the energy scale during the XMM-Newton exposures to be within 10 eV at the energy of 8 keV, using the instrumental background line of Cu (Guainazzi, priv. comm.).
The Chandra 4 Ms data of the CDFS (Xue et al. 2011) were combined when investigating flux variability. Since the XMM-Newton and Chandra spectra still have inter-calibration problems, for example, in spectral slope (e.g. Lanzuisi et al. 2013), the Chandra data were used only for flux variability. For now, the Chandra observations of CDFS span over the period of 2000−2010 and are divided into four intervals (C1-C4 in Table 3).
XMM-Newton observations.
The six XMM-Newton and four Chandra observation intervals of CDFS.
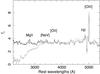 |
Fig. 2 UV/optical spectra of PID203, taken at the Very Large Telescope (VLT) with the FORS spectrographs (Szokoly et al. 2004). The horizontal axis is the rest-frame wavelengths in Å, assuming the galaxy redshift of z = 0.544. The flux density fλ is in units of 10-17 erg cm-2 s-1 Å-1. The data were taken on two occasions; 2000 Oct. 28 (black line) and 2000 Nov. 23 (grey line). The spectrum became redder in the second observation than in the first observation. |
3. PID 203
PID 203 is the second brightest X-ray source in the XMM-CDFS field after PID 319 in terms of flux but a larger number of counts were collected as it was more centrally located on the detector during the pointings than PID 319. The X-ray source is classified optically as broad-line AGN (z = 0.544) in Szokoly et al. (2004) with a detection of broad Mg ii (Fig. 2). However, the optical spectrum shows self-absorbing features in the emission lines (Mg ii and Hβ) and a redder continuum than optically-selected quasars normally exhibit, indicating the presence of moderate extinction. The two spectra presented in Szokoly et al. (2004) were taken on two occasions separated by three weeks (see Fig. 2). The spectrum taken in the second occasion shows an increased continuum reddening and deeper self-absorption in the major lines than in the first observaion, suggesting the optical extinction in this quasar is variable on a relatively short time-scale. The optical extinction in the first, less extincted spectrum is estimated to be AV ≃ 2.0, when the dust attenuation law for the Milky Way (Cardelli et al. 1989) is adopted. The other, redder spectrum cannot be described well by just increasing the amount of reddening but at least AV ≥ 4 would be needed.
The UV emission of PID 203 measured with the Optical Monitor (OM) instrument (Antonucci et al. 2015) is found to have the mean luminosity density of Lν ≃ 1.7 × 1029 erg s-1 Hz-1 at 2500 Å, after correction for the contribution of the host galaxy. The optical-to-X-ray spectral slope is αOX ≃ −1.25 ± 0.04 and does not change significantly between observations.
3.1. The mean spectrum
The mean X-ray spectrum integrated over the full exposure (Fig. 3) exhibits a typical continuum slope for quasars with photon index Γ ~ 2, a moderate amount of absorption in excess above the very small Galactic extinction of the CDF-S (NH,Gal = 7 × 1019 cm-2, Kalberla et al. 2005), and an iron K-shell (Fe K) emission line. Fitting an absorbed power-law to the 0.5−7 keV band data yields a photon index Γ = 2.00 ± 0.01 and column density of the cold, excess absorption measured in the galaxy rest-frame of NH = (5.5 ± 0.7) × 1020 cm-2. We obtained the spectral parameters by fitting the data from the three EPIC cameras jointly and the quoted errors are of 1σ hereafter unless stated otherwise.
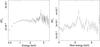 |
Fig. 3 Left: 0.5−7 keV spectrum of PID 203, obtained from the full exposure of three EPIC cameras. The data are plotted in flux units of EFE as a function of energy as observed. The energy range corresponds to the rest-frame 0.77−10.8 keV. Right: details of the Fe K band spectrum plotted in the rest-frame 4−9 keV range. |
0.5−7 keV continuum spectra of PID 203 and PID 319.
While a single power law agrees with the observed continuum well (see Table 4), the relatively strong Fe K line, as detailed below, requires a significant amount of reflection component. Including a reflection component (modelled by reflionx of Ross & Fabian 2005) in the fit, the continuum slope of the illuminating power law was found to have Γ = 2.05 ± 0.01 with the reflecting matter being cold (with the ionization parameter ξ = 10 erg cm s-1, the lowest value of the model). With this slightly steeper slope than that from a single power-law fit, the cold absorption is now found to be NH = (9.4 ± 0.8) × 1020 cm-2. The reflection component carries ~9% of the 2−7 keV band flux, in agreement with the albedo of cold matter covering a solid angle of ~2π. The fitted amount of reflection is mainly driven by the Fe K line strength, rather than the continuum shape which would deviate from a single power law. Expected continuum steepening towards lower energies may be masked by the absorption. The other source, PID 319, shows no evidence for absorption and has a similarly strong Fe K line. We will investigate the reflection component in more detail on the PID 319 spectrum in absence of the uncertainty due to absorption (see Sect. 4.1).
The measured absorbing column densities corresponds to optical reddening of AV = 0.27 or 0.47, depending on modelling, when the Galactic NH–AV conversion factor NH≃ 2 × 10²¹AV cm-2 (e.g. Gorenstein 1975; Predehl & Schmitt 1995) is adopted. Although we note that the optical and X-ray observations were not simultaneous, the X-ray inferred nuclear extinction is smaller than that suggested by the optical spectra. It is contrary to what is often found in luminous AGN (e.g. Merloni et al. 2014).
The Fe K emission is clearly detected (Fig. 3). Fitting a Gaussian gives a line centroid of 6.39 ± 0.05 keV in the galaxy rest-frame with a moderate broadening of  keV (Table 5). The rest-frame equivalent width (EW) of the line is found to be 0.18 ± 0.03 keV, corresponding to the line flux (2.9 ± 0.5) × 10-7 ph cm-2 s-1, derived from the Gaussian fit, is relatively large for quasars and in agreement with the substantial reflection inferred from the full-band spectrum above. The good detection of this level of line flux in AGN is only possible with the long exposure of the XMM-CDFS.
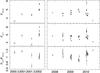 |
Fig. 4 Observed 0.5−2 keV and 2−7 keV flux and flux ratio (2−7 keV/0.5−2 keV) variations of PID 203, obtained from the XMM-Newton (filled circles) and Chandra (open squares) observations. The time axis is in year. |
Fe K features in PID 203 and PID 319.
3.2. X-ray flux variability
We obtained the flux of the X-ray source during each exposure by fitting a power law to the data. The flux measurements for all 33 XMM-Newton exposures in the observed 0.5−2 keV and 2−7 keV bands and for the four intervals of the Chandra observations (C1-C4 in Table 3) are plotted, along with the flux ratio F2−7/F0.5−2 in Fig. 4. These flux measurements are not corrected for absorption.
After folding all the XMM-Newton exposures into the six intervals, our data include ten measurements spanning over 10 year with roughly half-yr sampling (with a six year gap in the middle), and are comprised of the six XMM-Newton (X1-X6) and four Chandra data points (C1-C4). These long-term measurements give fractional variability amplitude (e.g. Vaughan et al. 2003), Fvar = 17 ± 5%. The 25 XMM-Newton exposures of X3-X6 in 2008−2010, which have typical sampling of a few days over 2 yr yield Fvar = 10 ± 4%. There is no difference in Fvar between the soft (0.5−2 keV) and hard (2−7 keV) bands light curves.
Significant variations of the flux ratio (X-ray colour) are observed, indicating changes in spectral shape. Since some incompatibility in spectral calibration between XMM-Newton and Chandra exists (see e.g. Lanzuisi et al. 2013)2, a direct comparison of the X-ray colours between the two observatories is difficult. However, with XMM-Newton observations alone, the X-ray colour variability is evident. Figure 5a shows the correlation diagram between the full-band (0.5−7 keV) flux and the X-ray colour. There is no correlation between the two parameters but the X-ray colours are not constant (even excluding the outlying lowest-flux point, the constant hypothesis yields χ2 = 65.7 for 31 degrees of freedom).
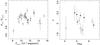 |
Fig. 5 Left: X-ray colour (F2−7/F0.5−2) against 0.5−7 keV band flux for the 33 XMM exposures for PID 203. Right: 0.5−2 keV (filled circles) and 2−7 keV (open squares) continuum slopes (photon index Γ) against the 0.5−2 keV and 2−7 keV fluxes, respectively, in units of 10-14 erg s-1 cm-2 for the six XMM intervals. Although a constant hypothesis cannot be ruled out for both slopes, the “steeper when brighter” trend often observed for AGN slope variability is not seen. |
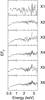 |
Fig. 6 0.5−7 keV band spectra of PID 203 obtained from the three EPIC cameras, observed in the six XMM time-intervals (Table 3). These spectra are plotted in the identical flux range. Possible Fe K line and other spectral variabilities over the six intervals can be visually inspected. |
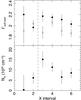 |
Fig. 7 Upper panel: photon indices measured in the 0.5−2 keV (filled circles) and 2−7 keV (open squares) bands for the six intervals of the XMM-Newton observations of PID 203 (X1–X6 in Table 3). The soft-band slopes were obtained by fitting an absorbed power law, while the hard band slopes by a simple power law with a Gaussian for Fe K (Fig. 8). The vertical dashed-line marks the 6-yr gap between the X2 and X3 intervals (see Table 3). Lower panel: absorbing column density (NH) in excess of the Galactic value measured in the galaxy rest-frame for the six intervals. We obtained these NH values by using the 0.5−2 keV data. Given the error bars, evidence for variability of NH is weak with χ2 = 6.5 for 5 degrees of freedom. |
3.3. Variability of absorption
The observed X-ray colour variations could be caused partly by variability in absorption as moderate absorption was detected in the mean spectrum and the optical data taken three weeks apart showed a change in reddening (Szokoly et al. 2004). We studied the XMM-Newton spectra taken from the six intervals (Fig. 6) to identify a spectral parameter driving the X-ray colour variations. On examinig absorption variability, we limited the data to the soft band (0.5−2 keV) to avoid an uncertainty in the continuum modelling caused by the Fe K emission and a possible spectral break in the hard band. An absorbed power law was fitted and photon index and absorbing column density obtained for the six intervals are plotted in Fig. 7. Note that the first two intervals and the rest are separated by ~6 yr. The hard-band slope was also measured using the 2−7 keV data, including the Fe K line modelled by a Gaussian with no absorption, as the degree of absorption seen in the soft band does not affect the energies greater than 2 keV.
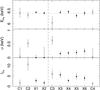 |
Fig. 8 Measurements of the Fe K line parameters of PID 203: the rest-frame Gaussian centroid energy, Gaussian dispersion (σ) and flux, obtained from the six XMM (filled circles, see also Fig. 6) and four Chandra (open squares) intervals in time order. The dashed line indicates the 6 yr gap between the X2 and C3 observations. Notable changes both in line shape and flux observed in the Chandra data are demonstrated in Fig. 9. The X-ray source flux dependence of these line parameters are shown in Fig. 10. |
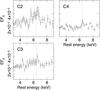 |
Fig. 9 Rest-frame 3−9 keV spectra of PID 203 obtained from the Chandra ACIS observations during the C2, C3 and C4 intervals. The y-axis range is identical in the three plots. The dotted line indicates rest-frame 6.4 keV where a cold Fe K line is expected. The C2 spectrum shows apparently broad, strong Fe emission, the shape of which is reminiscent of that expected from a relativistic disk (e.g. Fabian et al. 1989, see text for details), while the C4 spectrum has a weak, narrow line. The C3 spectrum shows an Fe K feature weaker than that of C2, but also has a broad component as well as a narrow line. The line profile is strongly skewed redwards, which causes a single Gaussian fit to obtain a centroid energy significantly lower than 6.4 keV (see Fig. 10). |
Evidence for variability in absorption over the six intervals is found to be weak (χ2 = 6.5 for 5 degrees of freedom). We see some similarity in the temporal variation trends between NH and the X-ray colour in Fig. 4, which suggests absorption may partly drive the the X-ray colour variability. However, no drop in UV flux was observed with the OM in the X3 interval (Vagnetti et al., in prep.) where increased NH is suggested. This agrees with no variability in absorption, provided same matter is responsible for both X-ray absorption and UV extinction.
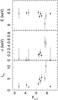 |
Fig. 10 Fe K line parameters of PID 203 measured in the six XMM (filled circles) and four Chandra (open squares) intervals, plotted against the 2−7 keV flux in units of 10-14 erg s-1 cm-2. A significant (>99% confidence level) variability in line flux is observed. |
3.4. Continuum slope variability
The continuum slope should be the source of the X-ray colour changes, if absorption is not a principal driver. The XMM-Newton spectra from the six intervals however do not provide any clear evidence for slope changes, as shown in Fig. 7. The 0.5−2 keV and 2−7 keV slopes show comparable values given the error bars of the measurements, in agreement with the good fit of a single power law for the mean spectrum. Any spectral variability occurred in the 33 exposures might be smeared out when they are binned into the six intervals, and the spectral analysis cannot identify what caused the X-ray colour variability.
Although, as mentioned above, the error bars make it inconclusive, when the soft- and hard-band slopes are plotted against flux in the respective bands (Fig. 5b), a negative trend is seen for the soft-band slopes. This is contrary to the “steeper when brighter” trend often seen in X-ray continuum slope of well-studied AGN.
3.5. Fe K line variability
We investigated the Fe K line variability using the six XMM intervals as well as the four Chandra intervals. The Fe K feature was modelled by a Gaussian and the continuum was determined by fitting a power law to the observed 2−6 keV data. Figure 8 shows the rest-frame line-centroid energy, the Gaussian dispersion, and the intensity in time order. Among the XMM-Newton observations, the line emission is found to be broader and stronger in the recent observations in 2008−2010 than in the two earlier observations in 2001−2002. More dramatic changes appear to have occurred in Chandra observations: very high flux acompanied with line broadening is observed in C2 compared to the other intervals (Fig. 9). This strong, broad line disappeared in the first XMM-Newton observation (X1) eight months later, when the Fe K returned to a narrow, weak line, although the data are noisy.
The line parameters are plotted against the hard-band (2−7 keV) flux (Fig. 10). A steep increase of line flux, rather than a continuous trend, as increasing continuum flux in the range of (5−6) × 10-14 erg s-1 cm-2 in F2−7 is observed. This rise in line flux is linked with the line broadening and the shift of line centroid to lower energies, indicating that enhancements of the red wing of the line cause the flux increases. In the context of a relativistically broadened line from the accretion disk, they are equivalent to enhancements of relativisitic effects because of strong gravity around the black hole. A simple interpretation would be that the X-ray source and the Fe line emitting region move inwards where both disk emissivity and gravitational effects are large as increasing continuum flux. However, this simple picture breaks down when the data point of the highest continuum flux (X2) is included. X2 is the observation in 2002 before the 6 yr gap, where the line is unresolved and weak (see Fig. 6).
We examined the strongest and broadest line feature observed in C2 in the context of the line from the relativistic disk. The diskline model for a Schwarzschild black hole (Fabian et al. 1989) was used, correcting the energy-scale for the redshift. The model for a rest-frame 6.4 keV line with the line emitting radii of 6−50 rg (where rg = GM/c2), inclination of the disk of 30° agrees with the observed line shape (Fig. 9). No extreme broadening in a rapidly spinning black hole is required. However, the very large EW of the line (0.6 keV) is hard to explain if the innermost radius of the line-emitting region is as large as 6 rg (where an enhancement of reflection due to light bending is diminished, Miniutti & Fabian 2004).
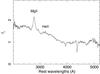 |
Fig. 11 UV/optical spectrum of PID319, taken at the VLT with the FORS spectrosgraphs (Szokoly et al. 2004). The horizontal axis represents the rest-frame wavelengths in Å, assuming the galaxy redshift of z = 0.742. The flux density fλ is in units of 10-17 erg cm-2 s-1 Å-1. |
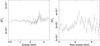 |
Fig. 12 Left: 0.5−7 keV spectrum of PID 319, obtained from the full exposure of three EPIC cameras. The data are plotted in flux units of EFE as a function of energy as observed. The energy range corresponds to the rest-frame 0.87−12.2 keV. The small decline at the lowest energies is due to the Galactic absorption. The spectral flattening towards higher energies (see text) can be noticed. Right: details of the Fe K band spectrum plotted in the rest-frame 4−9 keV range. The Fe K line shows a moderately broad profile. |
4. PID 319
PID 319 is the brightest X-ray source in the XMM-CDFS and is identified with a quasar at redshift z = 0.742. The optical (rest-frame UV) spectrum presented in Szokoly et al. (2004) shows clear, broad Mg ii emission (FWHM ≃ 11 000 km s-1) on a blue continuum, typical of broad-line QSOs.
The UV emission of PID 319 observed with the OM instrument (Antonucci et al. 2015) showed a notable decrease in luminoisty from 1 × 1030 erg s-1 Hz-1 during the 2001−2002 period (X1-X2) to 0.6 × 1030 erg s-1 Hz-1 during the 2007−2010 period (X3-X6) at 2500 Å. The optical-to-X-ray spectral slope showed a significant change correspondingly from αOX = −1.45 ± 0.01 to − 1.33 ± 0.01 (Vagnetti et al., in prep.).
4.1. The mean spectrum
The mean X-ray spectrum of PID 319 obtained from the full exposure (Fig. 12) shows no evidence for excess cold absorption (NH< 6 × 1019 cm-2, 90% upper limit). The Fe K feature (Fig. 12) is found at the rest-frame energy of 6.48 ± 0.07 keV with significant broadening ( keV, or FWHM ~ 21 000 km s-1) when a Gaussian is fitted (Table 5). The line flux is estimated to be
  ph cm-2 s-1, corresponding to a rest-frame EW of
  keV.
keV.
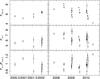 |
Fig. 13 Observed 0.5−2 keV and 2−7 keV flux and the flux ratio (2−7 keV/0.5−2 keV) variations of PID 319, obtained from the XMM-Newton (filled circles) and Chandra (open squares) observations. The time axis is in years. |
The continuum slope flattens towards higher energies. When a broken power law is fitted, the photon index changes from  to
to  below and above the rest-frame break energy of
  keV (
keV ( keV in the observed frame). This broken power-law model gives an improved fit (χ2 = 515.3 for 452 d.o.f.) relative to a single power-law (with Γ = 2.05 ± 0.01, χ2 = 554.7 for 454 d.o.f.) for the 0.5−7 keV data. The steepening soft portion of the spectrum may be identified as a soft excess, which is often discussed for nearby AGN.
While this curved continuum may be an intrinsic feature of the X-ray source, a plausible explanation is augmented emission in the hard band (i.e. above the break energy) due to reflection from cold matter, as expected from the presence of the Fe K line. Since, unlike PID 203, PID 319 shows no evidence for absorption, which would introduce uncertainty in slope measurements at lower energies, we examined the reflection scenario in detail, using the two similar but slightly different reflection models. We modelled the 0.5−7 keV data with a sum of an illuminating power law and its reflection spectrum described by reflionx (Ross & Fabian 2005) or xillver (García et al. 2013). Here no excess absorption is required and no relativistic blurring of the reflection spectrum is applied. The ionization parameter ξ was left free in the spectral fits, but in both cases, the reflecting matter was found to be cold (ξ was pegged to the lowest value 10 erg s-1 cm in reflionx while  erg s-1 cm in xillver) to give good fits to the data (χ2 = 534.5 (reflionx) and χ2 = 531.2 (xillver) for 453 degrees of freedom). The photon index of the illuminating power-law source was found to be Γ = 2.06 ± 0.01 (reflionx) or Γ = 2.10 ± 0.01 (xillver). The fraction of the 2−7 keV flux due to the reflected light was found to be 10 or 14%, in good agreement with that expected from the albedo from a thick, cold matter subtending in 2π in the same observed band (≈10%), meaning that the reflection scenario is reasonable for explaining the spectral break.
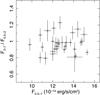 |
Fig. 14 X-ray colour (F2−7/F0.5−2) against the 0.5−7 keV band flux for the 33 XMM exposures for PID 319. No correlation between the X-ray colour and the observed flux is seen. |
4.2. X-ray flux and colour variability
The source flux measurements in the observed 0.5−2 keV (F0.5−2) and 2−7 keV (F2−7) bands and the X-ray colour (F2−7/F0.5−2) for the 33 XMM exposures are plotted in Fig. 13. As done for PID 203, fractional variability amplitudes was derived for the XMM-Newton and Chandra combined 10 intervals (Fvar = 15 ± 5%) and the 25 XMM-Newton exposures in the X3-X6 intervals (Fvar = 11 ± 4%). The Fvar of the soft and hard bands are found to be comparable, like in PID 203.
The X-ray colour measured in the 33 XMM exposures is significantly variable (χ2 = 82.2 for 32 degrees of freedom) but has no correlation with the full band (0.5−7 keV) flux (Fig. 14).
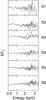 |
Fig. 15 XMM-Newton spectra of PID 319 observed in the six intervals. |
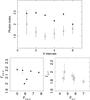 |
Fig. 16 Upper panel: photon index measurements for the six XMM intervals (X1-X6) in the 0.5−2 keV (filled circles) and the 2−7 keV (open squares) bands for PID 319. In X2-X5, the measured Γ differ significantly between the soft and hard bands, suggesting the presence of spectral break around 2 keV. Lower-left: photon indices measured for the 0.5−2 keV continuum plotted against the measured flux in the same band for the six XMM intervals. Lower-right: same as the left panel but in the 2−7 keV band. The fluxes are in units of 10-14 erg s-1 cm-2. |
4.3. X-ray continuum shape
We also investigated variability of the continuum slope within the respective soft (0.5−2 keV) and hard (2−7 keV) bands, using the mean spectra sampled at the six epochs (X1-X6, Fig. 15). As the spectral break appears around observed 2 keV, we fit a power law to the data below and above 2 keV separately and recorded the photon indices (Fig. 16).
The soft- and hard-band slopes are not correlated and the hard-band slope is always flatter than that in the soft band, suggesting that the continuum slope pivots around 2 keV. Any correlation of the slope with the flux is unclear, but, again, the “steeper when brighter” trend is not observed.
We investigated the spectra of X4 and X6 intervals, which show their soft-band slopes clearly flatter than the others. No evidence for absorption is found when an absorbed power-law is fitted, with the 90% upper limit of absorbing column density of NH = 1.7 × 1020 cm-2. Therefore it is unlikely that the spectral variability is caused by absorption.
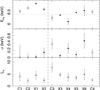 |
Fig. 17 Fe K line variability of PID 319, investigated for the four Chandra (open squares) and six XMM (filled circles) intervals. The emission line was modelled by a Gaussian, and the rest-frame line-centroid energy (upper panel), line width measured by the Gaussian dispersion (middle panel) and the normalization in units of 10-7 photons s-1 cm-2. In the upper panel, the nominal line energy of 6.4 keV expected for cold Fe is indicated by a dotted line. The dashed vertical line indicates the ~6 year gap between the 2000−2002 and 2007−2010 periods. |
4.4. Fe K line variability
We investigated variability of the Fe line using the spectra of the six XMM and the four Chandra intervals in the same manner as for PID 203. The spectral data in the 2−6 keV band were modelled with a power law and a Gaussian.
Fitting results on the line parameters are shown in time order in Fig. 17. Unresolved Fe lines with their centroid energy higher than 6.4 keV (6.73 ± 0.15 keV in weighted mean) are observed in the 2000−2002 period, while broadened emission around 6.4 keV (weighted mean of 6.41 ± 0.09 keV) is consistently observed in the recent 2007−2010 intervals. This may imply that the physical condition of the major Fe-line emitting region, the ionization condition, location etc., changed during the 6 yr observation gap. The line width observed in the full-exposure spectrum (σ = 0.29 keV, Fig. 12) is partly due to these shifts in line energy. Within the six intervals in the 2007−2010 period, the line width may oscillate between the intervals (i.e. approximately every half-yr), although the error bars are too large to be conclusive.
On inspecting the line parameters as a function of 2−7 keV flux (Fig. 18), the line centroid energy is not constant (χ2 = 112 for 9 d.o.f.) and show flux dependence (the correlation coefficient is − 0.70) when the XMM-Newton and Chandra data combined together. A constant hypothesis cannot be ruled out for the line width and flux, given the large error bars. However, a positively correlated trend between line and continuum flux can be seen. This is similar to the case the Fe line of PID 203, for which the line centroid is shifted to lower energies when broadened.
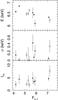 |
Fig. 18 Fe K line parameters of PID 319 measurd in the six XMM (filled circles) and four Chandra (open squares) intervals plotted against the 2−7 keV flux in units of 10-14 erg s-1 cm-2. The χ2 values against a constant hypothesis are 112.0 for the line centroid, 10.1 for the line width, and 10.0 for the line flux, respectively, for 9 degrees of freedom (the XMM-Newton and Chandra datasets combined). |
5. Discussion
The XMM-Newton long exposure of the CDF-S gave us an opportunity to peek into the X-ray spectral/temporal properties of quasars with an X-ray luminosity similar to those of low-z PG quasars beyond redshift z ~ 0.5 through the two bright X-ray sources in the field, PID 203 and PID 319. Here we present a brief discussion of our findings on X-ray variability and the Fe K lines.
5.1. X-ray variability
Flux variability is a characteristic property of AGN and likely to depend on the black hole mass (MBH). No reliable estimates of MBH are available for PID 203 and PID 319. The Eddington-limit accretion places the lower limit of their MBH of 107 M⊙, given their X-ray luminosity of L2−10 ~ 1044 erg s-1, assuming the typical bolometric correction. PG quasars studied by Piconcelli et al. (2005) with similar X-ray luminoisties typically have MBH ~ 108 M⊙. The virial method cannot be applied for PID 203, as the optical emission-line spectrum is severely altered by self-absorption. While the Mg ii width (full width at half maximum, FWHM ≃ 11 000 km s-1) can be used for PID 319, the flux calibration in Szokoly et al. (2004) data is apparently problematic. A rough estimate of the continuum luminosity using the R band magnitude (19.02 mag, Szokoly et al. 2004) points to that MBH of PID 319 could be as large as 109 M⊙ (with the prescription of e.g. Shen et al. 2011).
Temporal X-ray fluctuations in AGN generally exhibit red noise. This means that Fvar depends on the timescale of the measurements and would be larger when sampled over a long timescale. The two sources show similar amplitudes of variability: Fvar ≃ 15−17% from the 10 XMM+Chandra intervals with half-yr sampling over 10 yr (net 4 yr) and Fvar ≃ 10−11% from the 25 XMM-Newton exposures over 2 yr (see Sects. 3.2 and 4.2). Within each XMM interval where typical sampling is of a few days, Fvar drops to ~8% in both objects, in agreement with red noise. Among many works on AGN X-ray variability, the monitoring programs of nearby AGN with RXTE cover timescales as long as 10 yr with dense sampling, and are probably the best reference for our results. A comparison with the results on various, bright AGN light curves obtained with RXTE in Markowitz & Edelson (2004) suggests that the MBH of these two CDFS sources may indeed be 108–109 M⊙. With similar degree of X-ray variability and X-ray luminosities, the two CDFS AGN are likely to have comparable MBH. A more comprehensive X-ray variability study of CDFS sources, including these two, will be presented in a separate paper (Paolillo et al., in prep.).
In comparison to nearby AGN, one notable property of X-ray variability in these two quasars is the lack of energy dependence in variability amplitude. The light curves in the soft (0.5−2 keV) and hard (2−7 keV) bands exhibit similar values of Fvar, contrary to those of nearby bright Seyfert galaxies which often show larger variability in the soft band than in the hard band (Nandra et al. 1997; Leighly 1999; Markowitz & Edelson 2001). This energy dependence in variability found in Seyfert galaxies is compatible with the “steeper when brighter” trend in the continuum slope often observed in those sources (Markowitz & Edelson 2001), in contrast to the two CDFS quasars showing neither the energy-dependent variability nor flux-dependent slope changes. It is however interesting to note that the energy-dependence of variability disappears on shorter timescales, e.g. less than 40 ks for Seyfert galaxies, of which black hole masses are typically 107 M⊙, studied by Ponti et al. (2012). If the black hole masses of PID 203 and PID 319 are much larger than those Seyfert galaxies e.g. ~109 M⊙ as suspected, these quasars might be in the same regime, and a longer (>10 yr) monitoring may be needed to see any deviation from the coherent varaibility in energy.
5.2. Fe K lines
The Fe K lines are strongly detected in the mean spectra of PID 203 and PID 319, with EW of ~0.2 keV. Moderate broadening of σ of 0.2−0.3 keV is observed. According to the EW(Fe K) – LX relation observed for nearby AGN (e.g. Iwasawa & Taniguchi 1993), the EW of a narrow Fe K originating from distant cold matter, e.g. a torus, in an AGN with L2−10 ~ 1 × 1044 erg s-1 is expected to be about 0.04 keV (Bianchi et al. 2007; Page et al. 2004; Fukazawa et al. 2011; Ricci et al. 2013). If this relation holds at z = 0.5−0.7, narrow Fe K emission of the torus origin would be a minor component in the two QSOs and the bulk of their lines has to be produced in the accretion disk at smaller distance, as the moderate broadening of the line profiles suggests. However, the EW ~ 0.2 keV observed in the two objects are still remarkable, even though they originate from the accretion disk. Systematic studies of broad Fe K lines in nearby AGN found the typical value of broad-line EW to be ~0.1 keV (Nandra et al. 2007; de la Calle et al. 2010). The results of stacking analysis for distant AGN (z ~ 1; Corral et al. 2008; Chaudhary et al. 2012; Falocco et al. 2012) also give similar values. High Fe abundance can boost the line strength but it seems unlikely that these two bright quasars in the CDFS happen to both be AGN of exceptional metalicity. We will need more data at high redshifts to determine whether they are somehow exceptionally strong Fe K emitters or there is an evolution in Fe K line strength of AGN.
When the Chandra data are combined with the XMM-Newton data, the Fe K lines seem to be variable: the line flux in PID 203 and the line centroid in PID 319 (Figs. 10 and 18). Even limiting ourselves to use the data from a single observatory, for example, the line width of PID 203 measured with XMM-Newton, which was unresolved in the earlier X1-X2 periods, became broader in X3-X6 intervals six years later, as shown in Figs. 19a, b. The C4 interval is of the last 2 Ms observation with Chandra. When this interval is divided into two parts with a 1-Ms exposure each, which still provides a comparable or better quality spectrum than the other Chandra intervals, the line of PID 319 appears to change its shape in three months (Figs. 19c, d) while the continuun flux changes little. If these pieces of marginal evidence were to be real, they would support the accretion disk origin for the Fe K lines. Given the moderate broadening, the primary line-emitting region is not strongly relativistic but at radii small enough to receive strong radiation from the central source. The dynamical timescale of a Keplerian disk around a 109 M⊙ black hole at 40 rg is Td ~ 3(R/ 40rg)3 / 2(M/ 109 M⊙) months, where R is the distance from the black hole with a mass of M. Thus, Fe K line variability may be naturally expected if the line emission is produced in the accretion disk at a few tens rg.
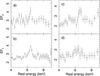 |
Fig. 19 Examples of variable Fe K line profile on long and short timescales, as observed with the same instrument. Left panel: Fe K band spectra of PID 203 observed with XMM-Newton in a) 2001−2002 (X1 and X2); and b) 2008−2010 (X3-X6) periods separated by 6 yr. As shown in Fig. 8, the line of a) is unresolved (σ< 0.12 keV) while moderate but significant broadening (σ = 0.18 ± 0.04 keV) is observed in b). Right panel: Chandra data of PID 319 during the first c) and second d) halves of the C4 interval with a 1 Ms exposure each. The C4 interval spans over five months (see Table 3), within which the line shape appears to change over a few months: the line centroid shifted from 6.56 ± 0.05 keV to 6.21 ± 0.17 keV and the line profile broadened from σ< 0.14 keV to |

While the Fe line energy remains at 6.4 keV in PID 203, the line in PID 319 occasionally appears to originate from highy ionized matter, especially in 2000−2002. The four observations with XMM-Newton and Chandra observations in that period showed consistently that the line was found at 6.5−6.9 keV and unresolved. Evidence that highly ionized Fe K (Fe xxv, Fe xxvi) may be formed in AGN with a high Eddington ratio has been reported (e.g. Porquet et al. 2004 and Inoue et al. 2007 for PG quasars; Iwasawa et al. 2012, for COSMOS AGN). In this respect, the steeper αOX measured for PID 319 (αOX ~ −1.4, Sect. 4) than that for PID 203 (αOX ~ −1.2, Sect. 3), as measured by the OM instrument (Vagnetti et al., in prep.), may be indicative. Using the correlated trend between the Eddington ratio (λEdd) and αOX (e.g. Lusso et al. 2010 for XMM-COSMOS Type I AGN), λEdd ~ 0.1 can be deduced for PID 319 with the bolometric correction of kbol ≃ 30 for the 2−10 keV luminoisty. A black hole mass of MBH ~ 5 × 10⁸ M⊙ would realize this λEdd when the above bolometric correction is used for the mean 2−10 keV luminosity of PID 319 (1.8 × 1044 erg s-1). This Eddington ratio is marginally low however in comparison to those with high-ionization Fe K in the previous study. The source emitted at higher UV luminosity and had a steeper αOX in the 2001−2002 period, where the high-ionization Fe K was evident, than in 2007−2010 (see Sect. 4). While the UV-strong state in 2001−2002 perhaps marks a high-ionization condition in PID 319, whether the UV luminosity larger by ~65% is sufficient to account for the change in the ionization condition remains uncertain.
The third brightest source is PID 358 in the 2−10 keV source catalogue by Ranalli et al. (2013). Note that the counts listed in the catalogue are corrected for the exposure map (i.e. telescope vignetting, etc.), not those observed counts referred here. PID 358 is located at the edge of the field where the correction is large while the two sources in this work are located in the central part of the field. The absorbed spectrum of PID 358 (Comastri et al., in prep.) amplifies the difference in counts from the two unabsorbed sources we present when the energy range lower than 2 keV is considered.
XMM-Newton slopes are generally found to be steeper by ΔΓ = 0.1−0.2 than Chandra for an object with Γ ~ 2 at the brightness of these sources.
Acknowledgments
This research made use of the data obtained from XMM-Newton and the Chandra X-ray Observatory. We thank Matteo Guainazzi for providing us with the information on the XMM-Newton calibration status. We thank Kenta Matsuoka and Tohru Nagao for useful discussion on the optical data. K.I. acknowledges support by DGI of the Spanish Ministerio de Economía y Competitividad (MINECO) under grant AYA2013-47447-C3-2-P. W.N.B. thanks the NASA ADP grant NNX10AC99G. We acknowledge financial contribution from the agreement ASI-INAF I/009/10/0.
References
- Antonucci, M., Talavera, A., Vagnetti, F., et al. 2015, A&A, 574, A49 [NASA ADS] [CrossRef] [EDP Sciences] [Google Scholar]
- Bianchi, S., Guainazzi, M., Matt, G., & FonsecaBonilla, N. 2007, A&A, 467, L19 [NASA ADS] [CrossRef] [EDP Sciences] [Google Scholar]
- Bianchi, S., Guainazzi, M., Matt, G., Fonseca Bonilla, N., & Ponti, G. 2009, A&A, 495, 421 [NASA ADS] [CrossRef] [EDP Sciences] [Google Scholar]
- Cardelli, J. A., Clayton, G. C., & Mathis, J. S. 1989, ApJ, 345, 245 [NASA ADS] [CrossRef] [Google Scholar]
- Chaudhary, P., Brusa, M., Hasinger, G., et al. 2012, A&A, 537, A6 [NASA ADS] [CrossRef] [EDP Sciences] [Google Scholar]
- Comastri, A., Ranalli, P., Iwasawa, K., et al. 2011, A&A, 526, L9 [NASA ADS] [CrossRef] [EDP Sciences] [Google Scholar]
- Corral, A., Page, M. J., Carrera, F. J., et al. 2008, A&A, 492, 71 [NASA ADS] [CrossRef] [EDP Sciences] [Google Scholar]
- de La Cal le Pérez, I., Longinotti, A. L., Guainazzi, M., et al. 2010, A&A, 524, A50 [NASA ADS] [CrossRef] [EDP Sciences] [Google Scholar]
- Fabian, A. C., Rees, M. J., Stella, L., & White, N. E. 1989, MNRAS, 238, 729 [NASA ADS] [CrossRef] [Google Scholar]
- Falocco, S., Carrera, F. J., Corral, A., et al. 2012, A&A, 538, A83 [NASA ADS] [CrossRef] [EDP Sciences] [Google Scholar]
- Fukazawa, Y., Hiragi, K., Mizuno, M., et al. 2011, ApJ, 727, 19 [NASA ADS] [CrossRef] [Google Scholar]
- García, J., Dauser, T., Reynolds, C. S., et al. 2013, ApJ, 768, 146 [NASA ADS] [CrossRef] [Google Scholar]
- Giacconi, R., Zirm, A., Wang, J., et al. 2002, ApJS, 139, 369 [NASA ADS] [CrossRef] [Google Scholar]
- Gorenstein, P. 1975, ApJ, 198, 95 [NASA ADS] [CrossRef] [Google Scholar]
- Inoue, H., Terashima, Y., & Ho, L. C. 2007, ApJ, 662, 860 [NASA ADS] [CrossRef] [Google Scholar]
- Iwasawa, K., & Taniguchi, Y. 1993, ApJ, 413, L15 [NASA ADS] [CrossRef] [Google Scholar]
- Iwasawa, K., Mainieri, V., Brusa, M., et al. 2012, A&A, 537, A86 [NASA ADS] [CrossRef] [EDP Sciences] [Google Scholar]
- Kalberla, P. M. W., Burton, W. B., Hartmann, D., et al. 2005, A&A, 440, 775 [NASA ADS] [CrossRef] [EDP Sciences] [Google Scholar]
- Lanzuisi, G., Civano, F., Elvis, M., et al. 2013, MNRAS, 431, 978 [NASA ADS] [CrossRef] [Google Scholar]
- Leighly, K. M. 1999, ApJS, 125, 297 [NASA ADS] [CrossRef] [Google Scholar]
- Lusso, E., Comastri, A., Vignali, C., et al. 2010, A&A, 512, A34 [NASA ADS] [CrossRef] [EDP Sciences] [Google Scholar]
- Markowitz, A., & Edelson, R. 2001, ApJ, 547, 684 [NASA ADS] [CrossRef] [Google Scholar]
- Markowitz, A., & Edelson, R. 2004, ApJ, 617, 939 [NASA ADS] [CrossRef] [Google Scholar]
- Merloni, A., Bongiorno, A., Brusa, M., et al. 2014, MNRAS, 437, 3550 [NASA ADS] [CrossRef] [Google Scholar]
- Miniutti, G., & Fabian, A. C. 2004, MNRAS, 349, 1435 [NASA ADS] [CrossRef] [Google Scholar]
- Nandra, K., George, I. M., Mushotzky, R. F., Turner, T. J., & Yaqoob, T. 1997, ApJ, 476, 70 [NASA ADS] [CrossRef] [Google Scholar]
- Nandra, K., O’Neill, P. M., George, I. M., & Reeves, J. N. 2007, MNRAS, 382, 194 [NASA ADS] [CrossRef] [Google Scholar]
- Page, K. L., O’Brien, P. T., Reeves, J. N., & Turner, M. J. L. 2004, MNRAS, 347, 316 [NASA ADS] [CrossRef] [Google Scholar]
- Piconcelli, E., Jimenez-Bailón, E., Guainazzi, M., et al. 2005, A&A, 432, 15 [NASA ADS] [CrossRef] [EDP Sciences] [Google Scholar]
- Ponti, G., Papadakis, I., Bianchi, S., et al. 2012, A&A, 542, A83 [NASA ADS] [CrossRef] [EDP Sciences] [Google Scholar]
- Porquet, D., Reeves, J. N., O’Brien, P., & Brinkmann, W. 2004, A&A, 422, 85 [NASA ADS] [CrossRef] [EDP Sciences] [Google Scholar]
- Predehl, P., & Schmitt, J. H. M. M. 1995, A&A, 293, 889 [NASA ADS] [Google Scholar]
- Ranalli, P., Comastri, A., Vignali, C., et al. 2013, A&A, 555, A42 [NASA ADS] [CrossRef] [EDP Sciences] [Google Scholar]
- Ricci, C., Paltani, S., Awaki, H., et al. 2013, A&A, 553, A29 [NASA ADS] [CrossRef] [EDP Sciences] [Google Scholar]
- Ross, R. R., & Fabian, A. C. 2005, MNRAS, 358, 211 [Google Scholar]
- Silverman, J. D., Mainieri, V., Salvato, M., et al. 2010, ApJS, 191, 124 [NASA ADS] [CrossRef] [Google Scholar]
- Shen, Y., Richards, G. T., Strauss, M. A., et al. 2011, ApJS, 194, 45 [NASA ADS] [CrossRef] [Google Scholar]
- Strateva, I. V., Brandt, W. N., Schneider, D. P., Van den Berk, D. G., & Vignali, C. 2005, AJ, 130, 387 [NASA ADS] [CrossRef] [Google Scholar]
- Streblyanska, A., Hasinger, G., Finoguenov, A., et al. 2005, A&A, 432, 395 [NASA ADS] [CrossRef] [EDP Sciences] [Google Scholar]
- Szokoly, G. P., Bergeron, J., Hasinger, G., et al. 2004, ApJS, 155, 271 [NASA ADS] [CrossRef] [Google Scholar]
- Vaughan, S., Edelson, R., Warwick, R. S., & Uttley, P. 2003, MNRAS, 345, 1271 [NASA ADS] [CrossRef] [Google Scholar]
- Xue, Y. Q., Luo, B., Brandt, W. N., et al. 2011, ApJS, 195, 10 [NASA ADS] [CrossRef] [Google Scholar]
All Tables
All Figures
|
Fig. 1 PID 203 and PID 319 (large filled squares) are plotted along with various AGN samples on the LX–z plane: XMM-CDFS (filled squares, Comastri et al., in prep.; Ranalli et al. 2013), PG quasars (open circles, Piconcelli et al. 2005), SDSS quasars (crosses, Strateva et al. 2005), and CAIXA (filled circles, Bianchi et al. 2009). The LX is the rest-frame 2−10 keV luminosity. The monochromatic 2 keV luminosities in Strateva et al. (2005) were converted to 2−10 keV luminosities assuming a power-law spectrum of Γ = 1.8. |
| In the text | |
|
Fig. 2 UV/optical spectra of PID203, taken at the Very Large Telescope (VLT) with the FORS spectrographs (Szokoly et al. 2004). The horizontal axis is the rest-frame wavelengths in Å, assuming the galaxy redshift of z = 0.544. The flux density fλ is in units of 10-17 erg cm-2 s-1 Å-1. The data were taken on two occasions; 2000 Oct. 28 (black line) and 2000 Nov. 23 (grey line). The spectrum became redder in the second observation than in the first observation. |
| In the text | |
|
Fig. 3 Left: 0.5−7 keV spectrum of PID 203, obtained from the full exposure of three EPIC cameras. The data are plotted in flux units of EFE as a function of energy as observed. The energy range corresponds to the rest-frame 0.77−10.8 keV. Right: details of the Fe K band spectrum plotted in the rest-frame 4−9 keV range. |
| In the text | |
|
Fig. 4 Observed 0.5−2 keV and 2−7 keV flux and flux ratio (2−7 keV/0.5−2 keV) variations of PID 203, obtained from the XMM-Newton (filled circles) and Chandra (open squares) observations. The time axis is in year. |
| In the text | |
|
Fig. 5 Left: X-ray colour (F2−7/F0.5−2) against 0.5−7 keV band flux for the 33 XMM exposures for PID 203. Right: 0.5−2 keV (filled circles) and 2−7 keV (open squares) continuum slopes (photon index Γ) against the 0.5−2 keV and 2−7 keV fluxes, respectively, in units of 10-14 erg s-1 cm-2 for the six XMM intervals. Although a constant hypothesis cannot be ruled out for both slopes, the “steeper when brighter” trend often observed for AGN slope variability is not seen. |
| In the text | |
|
Fig. 6 0.5−7 keV band spectra of PID 203 obtained from the three EPIC cameras, observed in the six XMM time-intervals (Table 3). These spectra are plotted in the identical flux range. Possible Fe K line and other spectral variabilities over the six intervals can be visually inspected. |
| In the text | |
|
Fig. 7 Upper panel: photon indices measured in the 0.5−2 keV (filled circles) and 2−7 keV (open squares) bands for the six intervals of the XMM-Newton observations of PID 203 (X1–X6 in Table 3). The soft-band slopes were obtained by fitting an absorbed power law, while the hard band slopes by a simple power law with a Gaussian for Fe K (Fig. 8). The vertical dashed-line marks the 6-yr gap between the X2 and X3 intervals (see Table 3). Lower panel: absorbing column density (NH) in excess of the Galactic value measured in the galaxy rest-frame for the six intervals. We obtained these NH values by using the 0.5−2 keV data. Given the error bars, evidence for variability of NH is weak with χ2 = 6.5 for 5 degrees of freedom. |
| In the text | |
|
Fig. 8 Measurements of the Fe K line parameters of PID 203: the rest-frame Gaussian centroid energy, Gaussian dispersion (σ) and flux, obtained from the six XMM (filled circles, see also Fig. 6) and four Chandra (open squares) intervals in time order. The dashed line indicates the 6 yr gap between the X2 and C3 observations. Notable changes both in line shape and flux observed in the Chandra data are demonstrated in Fig. 9. The X-ray source flux dependence of these line parameters are shown in Fig. 10. |
| In the text | |
|
Fig. 9 Rest-frame 3−9 keV spectra of PID 203 obtained from the Chandra ACIS observations during the C2, C3 and C4 intervals. The y-axis range is identical in the three plots. The dotted line indicates rest-frame 6.4 keV where a cold Fe K line is expected. The C2 spectrum shows apparently broad, strong Fe emission, the shape of which is reminiscent of that expected from a relativistic disk (e.g. Fabian et al. 1989, see text for details), while the C4 spectrum has a weak, narrow line. The C3 spectrum shows an Fe K feature weaker than that of C2, but also has a broad component as well as a narrow line. The line profile is strongly skewed redwards, which causes a single Gaussian fit to obtain a centroid energy significantly lower than 6.4 keV (see Fig. 10). |
| In the text | |
|
Fig. 10 Fe K line parameters of PID 203 measured in the six XMM (filled circles) and four Chandra (open squares) intervals, plotted against the 2−7 keV flux in units of 10-14 erg s-1 cm-2. A significant (>99% confidence level) variability in line flux is observed. |
| In the text | |
|
Fig. 11 UV/optical spectrum of PID319, taken at the VLT with the FORS spectrosgraphs (Szokoly et al. 2004). The horizontal axis represents the rest-frame wavelengths in Å, assuming the galaxy redshift of z = 0.742. The flux density fλ is in units of 10-17 erg cm-2 s-1 Å-1. |
| In the text | |
|
Fig. 12 Left: 0.5−7 keV spectrum of PID 319, obtained from the full exposure of three EPIC cameras. The data are plotted in flux units of EFE as a function of energy as observed. The energy range corresponds to the rest-frame 0.87−12.2 keV. The small decline at the lowest energies is due to the Galactic absorption. The spectral flattening towards higher energies (see text) can be noticed. Right: details of the Fe K band spectrum plotted in the rest-frame 4−9 keV range. The Fe K line shows a moderately broad profile. |
| In the text | |
|
Fig. 13 Observed 0.5−2 keV and 2−7 keV flux and the flux ratio (2−7 keV/0.5−2 keV) variations of PID 319, obtained from the XMM-Newton (filled circles) and Chandra (open squares) observations. The time axis is in years. |
| In the text | |
|
Fig. 14 X-ray colour (F2−7/F0.5−2) against the 0.5−7 keV band flux for the 33 XMM exposures for PID 319. No correlation between the X-ray colour and the observed flux is seen. |
| In the text | |
|
Fig. 15 XMM-Newton spectra of PID 319 observed in the six intervals. |
| In the text | |
|
Fig. 16 Upper panel: photon index measurements for the six XMM intervals (X1-X6) in the 0.5−2 keV (filled circles) and the 2−7 keV (open squares) bands for PID 319. In X2-X5, the measured Γ differ significantly between the soft and hard bands, suggesting the presence of spectral break around 2 keV. Lower-left: photon indices measured for the 0.5−2 keV continuum plotted against the measured flux in the same band for the six XMM intervals. Lower-right: same as the left panel but in the 2−7 keV band. The fluxes are in units of 10-14 erg s-1 cm-2. |
| In the text | |
|
Fig. 17 Fe K line variability of PID 319, investigated for the four Chandra (open squares) and six XMM (filled circles) intervals. The emission line was modelled by a Gaussian, and the rest-frame line-centroid energy (upper panel), line width measured by the Gaussian dispersion (middle panel) and the normalization in units of 10-7 photons s-1 cm-2. In the upper panel, the nominal line energy of 6.4 keV expected for cold Fe is indicated by a dotted line. The dashed vertical line indicates the ~6 year gap between the 2000−2002 and 2007−2010 periods. |
| In the text | |
|
Fig. 18 Fe K line parameters of PID 319 measurd in the six XMM (filled circles) and four Chandra (open squares) intervals plotted against the 2−7 keV flux in units of 10-14 erg s-1 cm-2. The χ2 values against a constant hypothesis are 112.0 for the line centroid, 10.1 for the line width, and 10.0 for the line flux, respectively, for 9 degrees of freedom (the XMM-Newton and Chandra datasets combined). |
| In the text | |
|
Fig. 19 Examples of variable Fe K line profile on long and short timescales, as observed with the same instrument. Left panel: Fe K band spectra of PID 203 observed with XMM-Newton in a) 2001−2002 (X1 and X2); and b) 2008−2010 (X3-X6) periods separated by 6 yr. As shown in Fig. 8, the line of a) is unresolved (σ< 0.12 keV) while moderate but significant broadening (σ = 0.18 ± 0.04 keV) is observed in b). Right panel: Chandra data of PID 319 during the first c) and second d) halves of the C4 interval with a 1 Ms exposure each. The C4 interval spans over five months (see Table 3), within which the line shape appears to change over a few months: the line centroid shifted from 6.56 ± 0.05 keV to 6.21 ± 0.17 keV and the line profile broadened from σ< 0.14 keV to |
| In the text | |
Current usage metrics show cumulative count of Article Views (full-text article views including HTML views, PDF and ePub downloads, according to the available data) and Abstracts Views on Vision4Press platform.
Data correspond to usage on the plateform after 2015. The current usage metrics is available 48-96 hours after online publication and is updated daily on week days.
Initial download of the metrics may take a while.