Fig. 7
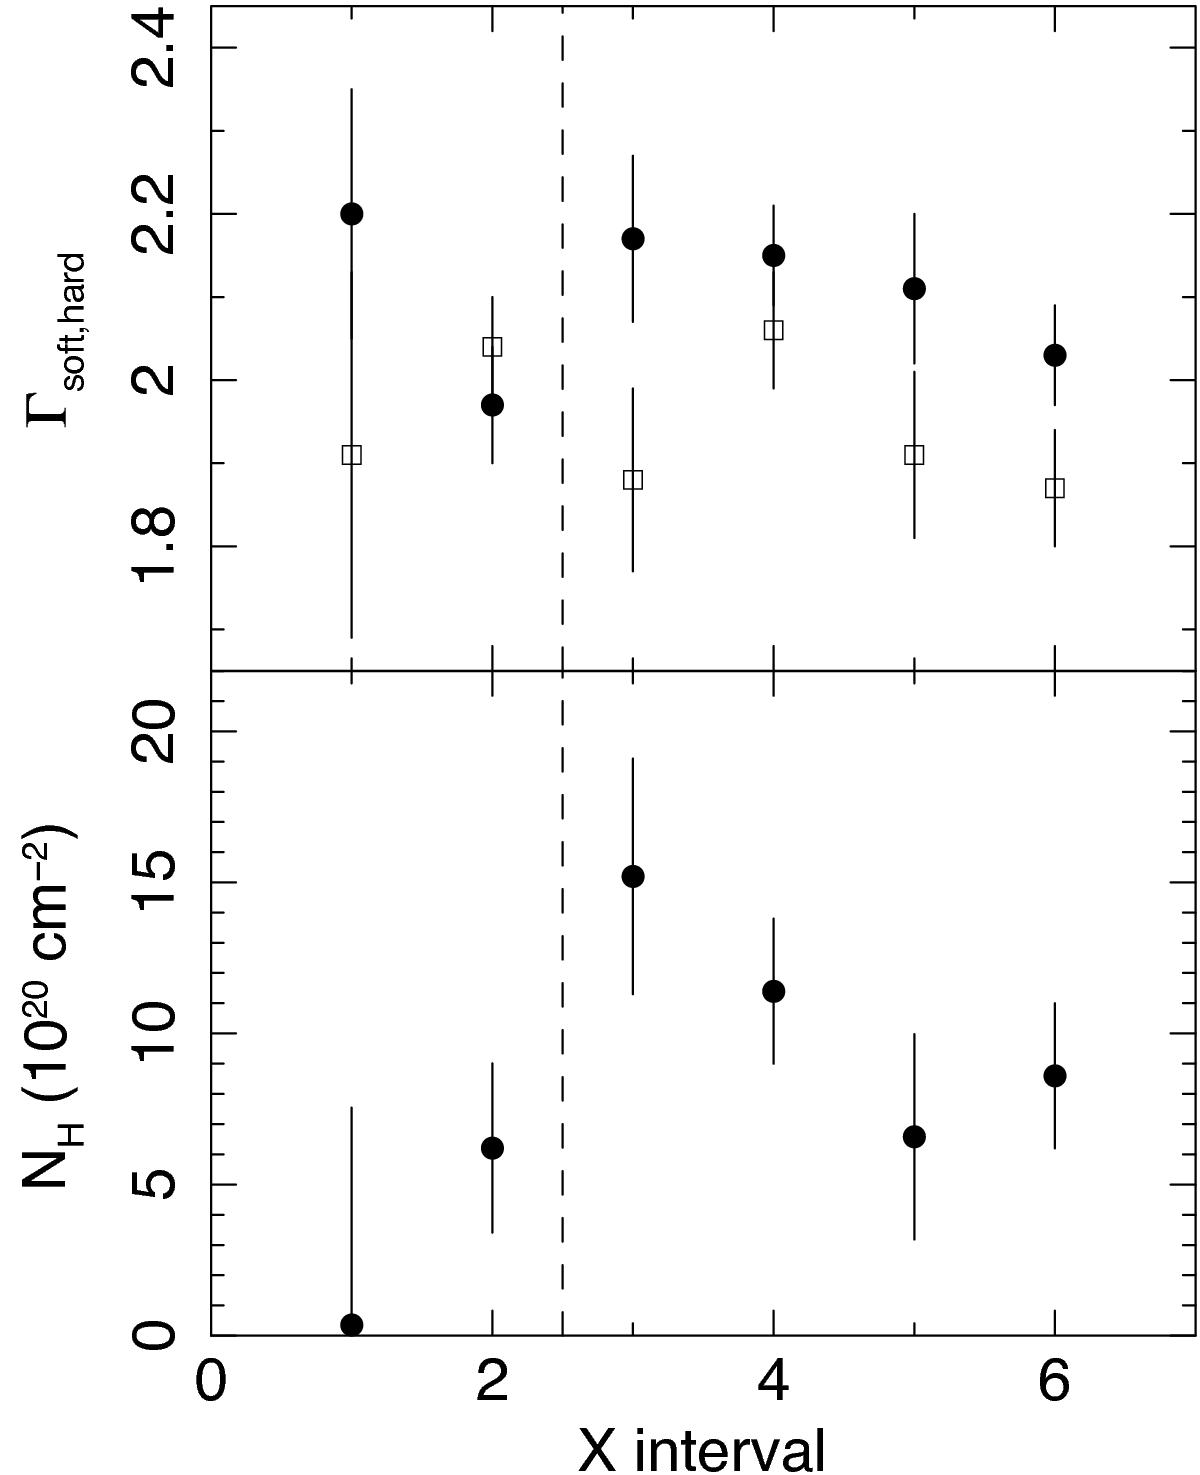
Upper panel: photon indices measured in the 0.5−2 keV (filled circles) and 2−7 keV (open squares) bands for the six intervals of the XMM-Newton observations of PID 203 (X1–X6 in Table 3). The soft-band slopes were obtained by fitting an absorbed power law, while the hard band slopes by a simple power law with a Gaussian for Fe K (Fig. 8). The vertical dashed-line marks the 6-yr gap between the X2 and X3 intervals (see Table 3). Lower panel: absorbing column density (NH) in excess of the Galactic value measured in the galaxy rest-frame for the six intervals. We obtained these NH values by using the 0.5−2 keV data. Given the error bars, evidence for variability of NH is weak with χ2 = 6.5 for 5 degrees of freedom.
Current usage metrics show cumulative count of Article Views (full-text article views including HTML views, PDF and ePub downloads, according to the available data) and Abstracts Views on Vision4Press platform.
Data correspond to usage on the plateform after 2015. The current usage metrics is available 48-96 hours after online publication and is updated daily on week days.
Initial download of the metrics may take a while.