Fig. 12
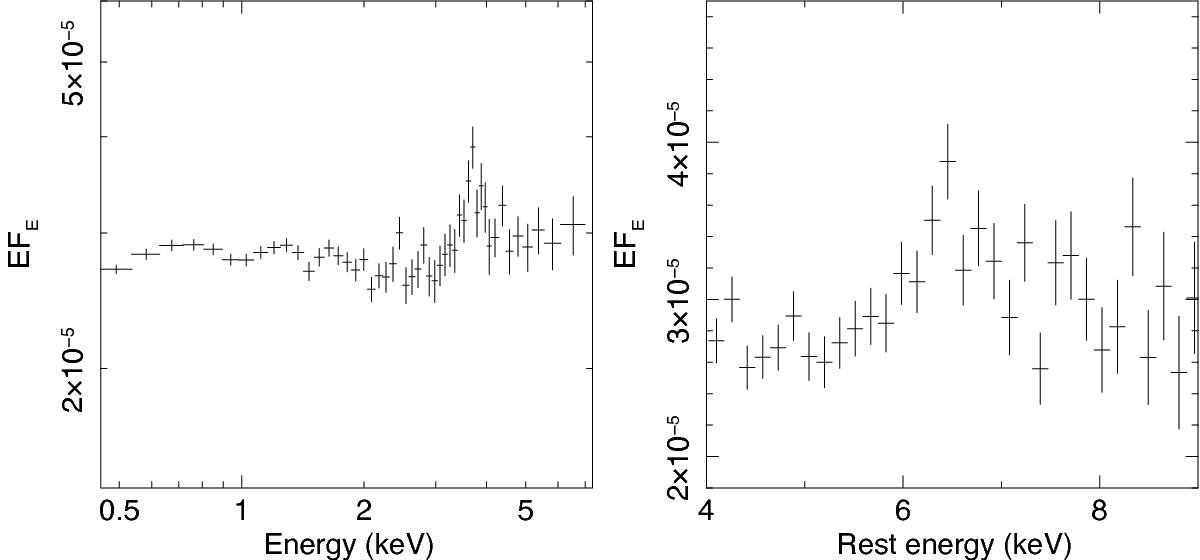
Left: 0.5−7 keV spectrum of PID 319, obtained from the full exposure of three EPIC cameras. The data are plotted in flux units of EFE as a function of energy as observed. The energy range corresponds to the rest-frame 0.87−12.2 keV. The small decline at the lowest energies is due to the Galactic absorption. The spectral flattening towards higher energies (see text) can be noticed. Right: details of the Fe K band spectrum plotted in the rest-frame 4−9 keV range. The Fe K line shows a moderately broad profile.
Current usage metrics show cumulative count of Article Views (full-text article views including HTML views, PDF and ePub downloads, according to the available data) and Abstracts Views on Vision4Press platform.
Data correspond to usage on the plateform after 2015. The current usage metrics is available 48-96 hours after online publication and is updated daily on week days.
Initial download of the metrics may take a while.