Fig. 19
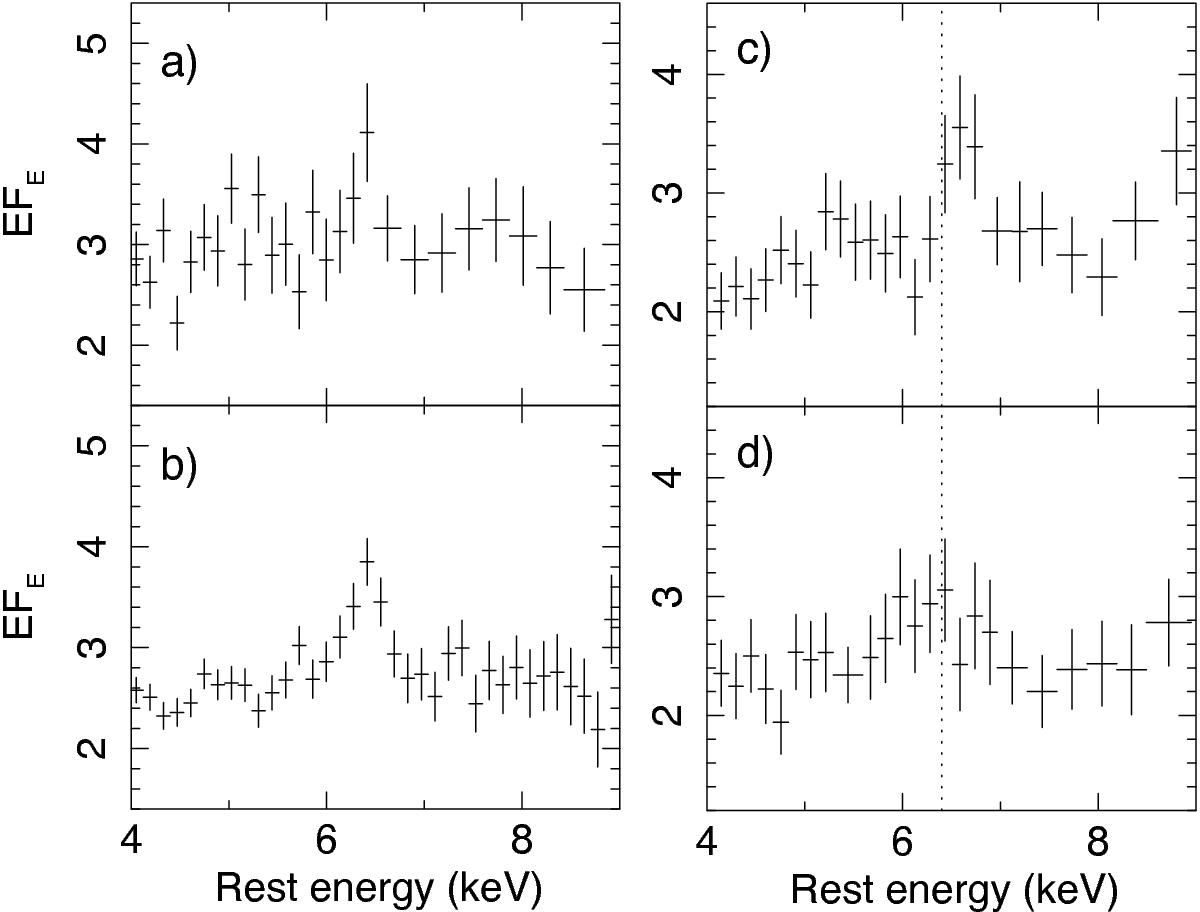
Examples of variable Fe K line profile on long and short timescales, as observed with the same instrument. Left panel: Fe K band spectra of PID 203 observed with XMM-Newton in a) 2001−2002 (X1 and X2); and b) 2008−2010 (X3-X6) periods separated by 6 yr. As shown in Fig. 8, the line of a) is unresolved (σ< 0.12 keV) while moderate but significant broadening (σ = 0.18 ± 0.04 keV) is observed in b). Right panel: Chandra data of PID 319 during the first c) and second d) halves of the C4 interval with a 1 Ms exposure each. The C4 interval spans over five months (see Table 3), within which the line shape appears to change over a few months: the line centroid shifted from 6.56 ± 0.05 keV to 6.21 ± 0.17 keV and the line profile broadened from σ< 0.14 keV to ![]() keV, while both continuum and line fluxes remain nearly identical with f2−7 = 5.1 × 10⁻¹⁴/ 5.0 × 10⁻¹⁴ erg s-1 cm-2, and IFe = (3.2 ± 1.0) × 10-7/ (3.7 ± 1.5) × 10-7 ph cm-2 s-1, respectively.
keV, while both continuum and line fluxes remain nearly identical with f2−7 = 5.1 × 10⁻¹⁴/ 5.0 × 10⁻¹⁴ erg s-1 cm-2, and IFe = (3.2 ± 1.0) × 10-7/ (3.7 ± 1.5) × 10-7 ph cm-2 s-1, respectively.
Current usage metrics show cumulative count of Article Views (full-text article views including HTML views, PDF and ePub downloads, according to the available data) and Abstracts Views on Vision4Press platform.
Data correspond to usage on the plateform after 2015. The current usage metrics is available 48-96 hours after online publication and is updated daily on week days.
Initial download of the metrics may take a while.