Free Access
Fig. 6
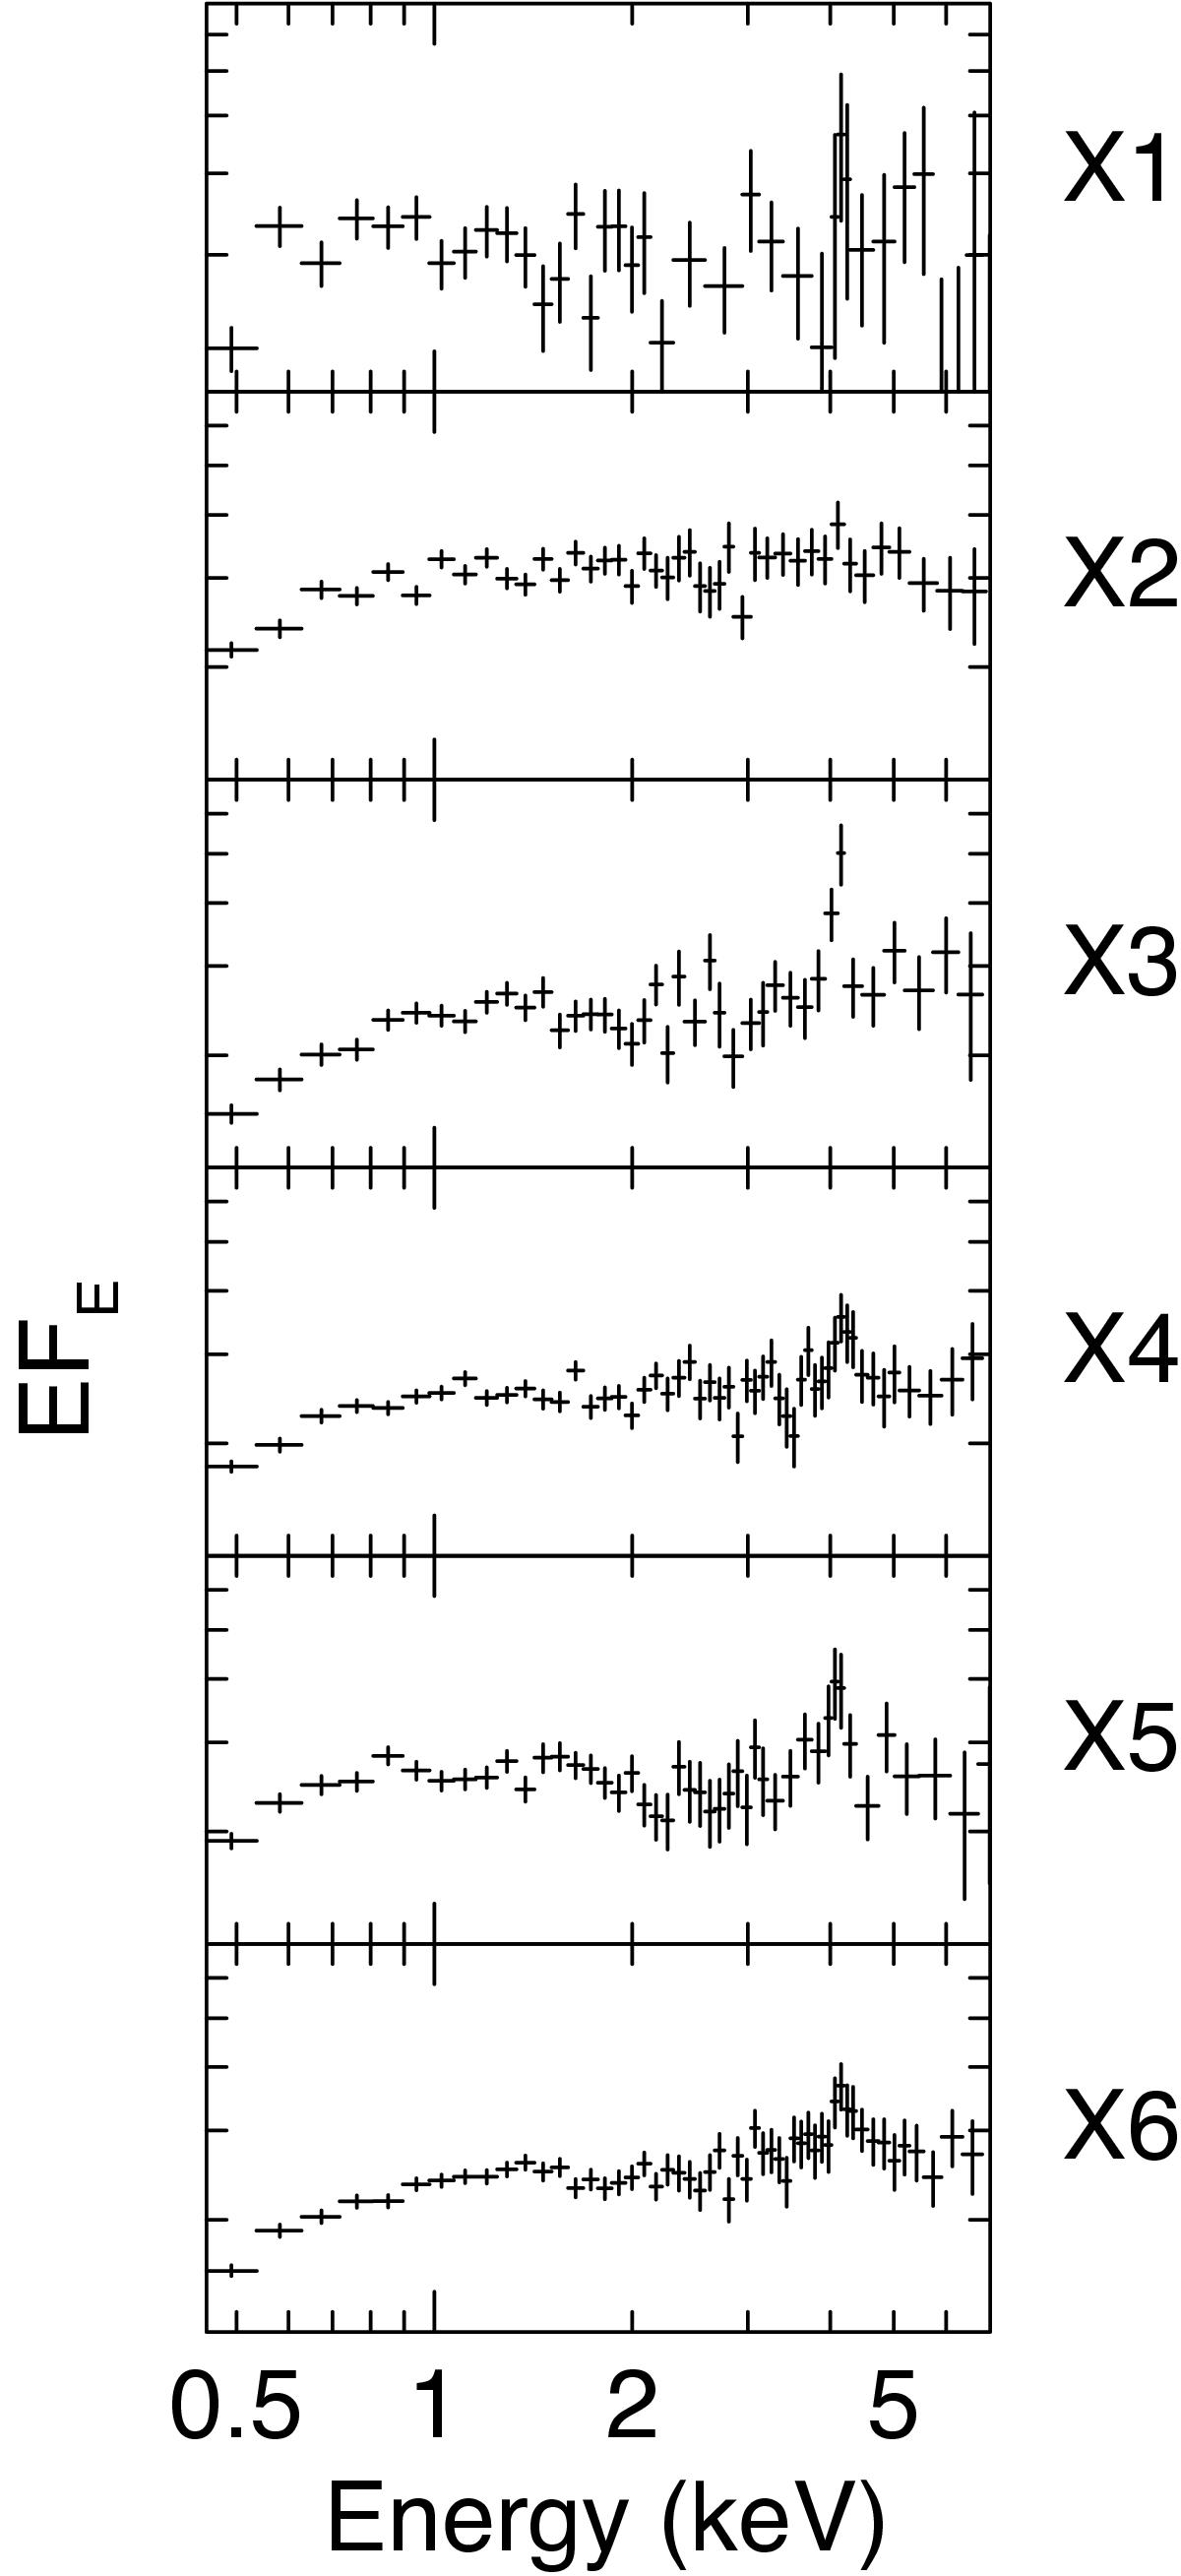
0.5−7 keV band spectra of PID 203 obtained from the three EPIC cameras, observed in the six XMM time-intervals (Table 3). These spectra are plotted in the identical flux range. Possible Fe K line and other spectral variabilities over the six intervals can be visually inspected.
Current usage metrics show cumulative count of Article Views (full-text article views including HTML views, PDF and ePub downloads, according to the available data) and Abstracts Views on Vision4Press platform.
Data correspond to usage on the plateform after 2015. The current usage metrics is available 48-96 hours after online publication and is updated daily on week days.
Initial download of the metrics may take a while.