Fig. 17
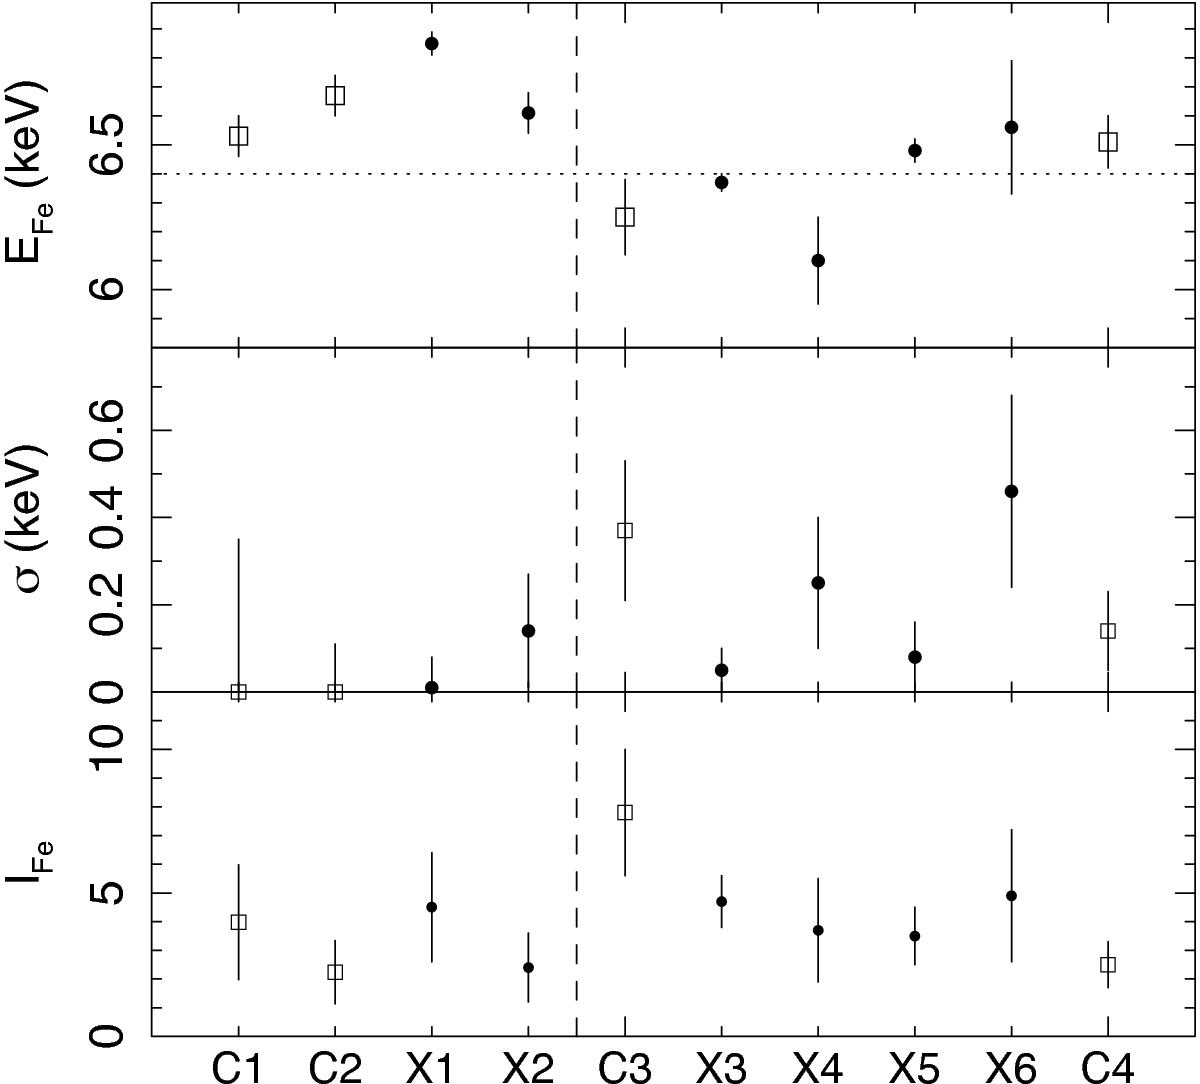
Fe K line variability of PID 319, investigated for the four Chandra (open squares) and six XMM (filled circles) intervals. The emission line was modelled by a Gaussian, and the rest-frame line-centroid energy (upper panel), line width measured by the Gaussian dispersion (middle panel) and the normalization in units of 10-7 photons s-1 cm-2. In the upper panel, the nominal line energy of 6.4 keV expected for cold Fe is indicated by a dotted line. The dashed vertical line indicates the ~6 year gap between the 2000−2002 and 2007−2010 periods.
Current usage metrics show cumulative count of Article Views (full-text article views including HTML views, PDF and ePub downloads, according to the available data) and Abstracts Views on Vision4Press platform.
Data correspond to usage on the plateform after 2015. The current usage metrics is available 48-96 hours after online publication and is updated daily on week days.
Initial download of the metrics may take a while.