| Issue |
A&A
Volume 569, September 2014
|
|
|---|---|---|
| Article Number | A25 | |
| Number of page(s) | 6 | |
| Section | Interstellar and circumstellar matter | |
| DOI | https://doi.org/10.1051/0004-6361/201424214 | |
| Published online | 12 September 2014 | |
Study of the sub-AU disk of the Herbig B[e] star HD 85567 with near-infrared interferometry⋆,⋆⋆
1
Max-Planck-Institut für Radioastronomie,
Auf dem Hügel 69,
53121
Bonn,
Germany
e-mail:
This email address is being protected from spambots. You need JavaScript enabled to view it.
2
University of Exeter, School of Physics,
Physics Building, Stocker
Road, Exeter,
EX4 4QL,
UK
3
Laboratoire Lagrange, UMR7293, Université de Nice
Sophia-Antipolis, CNRS, Observatoire de la Côte d’Azur, 06300
Nice,
France
4
INAF - Osservatorio Astrofisico di Arcetri, Largo E. Fermi 5,
50125
Firenze,
Italy
5
UJF-Grenoble 1/CNRS-INSU, Institut de Planétologie et
d’Astrophysique de Grenoble (IPAG) UMR 5274, 38041
Grenoble,
France
Received:
15
May
2014
Accepted:
10
July
2014
Abstract
Context. The structure of the inner disk of Herbig Be stars is not well understood. The continuum disks of several Herbig Be stars have inner radii that are smaller than predicted by models of irradiated disks with optically thin holes.
Aims. We study the size of the inner disk of the Herbig B[e] star HD 85567 and compare the model radii with the radius suggested by the size–luminosity relation.
Methods. The object was observed with the AMBER instrument of the Very Large Telescope Interferometer. We obtained K-band visibilities and closure phases. These measurements are interpreted with geometric models and temperature-gradient models.
Results. Using several types of geometric star-disk and star-disk-halo models, we derived inner ring-fit radii in the K band that are in the range of 0.8–1.6 AU. Additional temperature-gradient modeling resulted in an extended disk with an inner radius of 0.67+0.51-0.21 AU, a high inner temperature of 2200+750-350 K, and a disk inclination of 53+15-11 °.
Conclusions. The derived geometric ring-fit radii are approximately 3–5 times smaller than that predicted by the size–luminosity relation. The small geometric and temperature-gradient radii suggest optically thick gaseous material that absorbs stellar radiation inside the dust disk.
Key words: stars: individual: HD 85567 / stars: pre-main sequence / stars: formation / circumstellar matter / techniques: interferometric
Based on observations made with ESO telescopes at the La Silla Paranal Observatory under program IDs 080.C-0541(C), 082.C-0893(A), 084.C-0848(B).
Appendix A is available in electronic form at http://www.aanda.org
Member of the International Max Planck Research School (IMPRS) for Astronomy and Astrophysics at the Universities of Bonn and Cologne.
© ESO, 2014
1. Introduction
Infrared interferometric observations suggest that the circumstellar environment of Herbig Be (HBe) and Herbig Ae (HAe) stars are significantly different. In contrast to the lower-mass HAe stars, the K-band continuum radii of several HBe stars are significantly smaller than predicted by the size–luminosity relation (Monnier et al. 2005; Eisner et al. 2004; Kraus et al. 2008b; Weigelt et al. 2011; Kreplin et al. 2012). These smaller radii can be explained by the presence of an optically thick gas inside the dust disk. This optically thick gas can absorb the stellar ultraviolet (UV) radiation and allows dust to exist closer to the star (Monnier & Millan-Gabet 2002).
Stellar parameters of HD 85567.
The object HD 85567 (V596 Car, Hen 3-331) is a B-type star at a distance of 1.5 ± 0.5 kpc (see stellar parameters in Table 1). The evolutionary status of HD 85567 is not yet well-established. Miroshnichenko et al. (2001) suggested the object to be a main-sequence B[e] star. Other studies reported that HD 85567 is a young stellar object (Lamers et al. 1998; Malfait et al. 1998; Verhoeff et al. 2012; Wheelwright et al. 2013). Miroshnichenko et al. (2001) proposed the existence of a close binary companion that can interact with the circumstellar disk of HD 85567. Binarity is believed to be a key property in B[e] stars (Miroshnichenko 2007). Baines et al. (2006) detected a binary companion with a separation of ≳500 mas.
We use our near-infrared (NIR) interferometric observations to investigate the inner disk structure of HD 85567. The paper is organized as follows. We describe the observations and the data reduction in Sect. 2. The modeling is presented in Sect. 3 and the results are discussed in Sect. 4.
2. Observation and data reduction
The observations of HD 85567 were carried out using the NIR three-beam combiner VLTI/AMBER (Petrov et al. 2007) in three different nights. We obtained a total of six measurements in the low spectral resolution mode (R = 30; Fig. 1, Table 2). The data were reduced with amdlib 3.0.51 (Tatulli et al. 2007; Chelli et al. 2009). We applied a signal-to-noise frame selection (20% of the highest fringe signal-to-noise ratio (S/N); Tatulli et al. 2007) to the raw files of object and calibrator to obtain an improved visibility calibration. An additional improvement of the visibility calibration was achieved by equalizing the optical path difference (OPD) histograms of the object and calibrator (Kreplin et al. 2012) to account for atmospheric OPD drifts.
We derived K-band closure phases (Fig. 2) and visibilities (Fig. 3). The closure phases are zero within the error bars, indicating that the brightness distribution of our source is centrosymmetric. Except in measurement VI, amdlib 3.0.5 did not compute visibilities and closure phases for wavelengths in the range of approximately 2.0–2.1 μm because of low S/N. The S/N of the H-band data was also too low to derive H-band visibilities and closure phases.
The spectral energy distribution (SED; see Fig. 4) was reconstructed from dereddened values found in the literature (Verhoeff et al. 2012) and data from the Spitzer Space Telescope (IRS, program ID: 3470).
AMBER observation log.
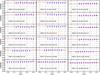 |
Fig. 3 Comparison of the visibilities of the best-fit temperature-gradient model (red line; see Table 4) with the wavelength-dependent AMBER visibilities (blue dots). The wavelength range of the visibilities is different for all measurements because of different data quality as explained in Sect. 2. |
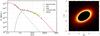 |
Fig. 4 Left: observed SED (black diamonds) and SED of the best-fit temperature-gradient model (Table 4). The total SED (red line) consists of the stellar flux (Kurucz model, black dashed line) and the flux of the temperature-gradient disk (black solid line). Right: two-dimensional intensity distribution of the best-fit model at 2 μm. The color-scaling is linear in arbitrary units. The star is not displayed. |
3. Modeling
3.1. Geometric modeling
The NIR emission of Herbig stars is believed to originate mainly in a ring-like region at the inner edge of the disk, which is often associated with a puffed-up inner rim (Natta et al. 2001; Dullemond et al. 2001). Thus, the size of the NIR emission region is often approximated with a geometric ring model, and the ring-fit radius can be compared to theoretical predictions (Millan-Gabet et al. 2001; Monnier & Millan-Gabet 2002; Eisner et al. 2003; Dullemond & Monnier 2010).
Here, we apply several different ring models, all containing an unresolved stellar component and a ring with a width of 20% of the inner ring radius (Monnier et al. 2005). We also investigate inclination effects (i.e., elongated rings) and the influence of an extended halo (see Table 3).
The variables of the two-dimensional total visibility | V | = |
V(PA,νuv)
| are the position angle (PA) of the measurement and the spatial
frequency νuv =
Bproj/λ
(see Table 2). It can be described by
 (1)where
V∗ =
1 is the visibility of the star, Vring is the
visibility of the ring-shaped disk, Vhalo is the visibility of the halo,
fhalo is the flux contribution of the
halo, and 1 − f∗ −
fhalo is the flux contribution of the
ring-like disk. The wavelength-dependent relative flux contribution f∗ of the
stellar component to the total emission was derived from the SED (Fig. 4). The model parameters are the inner ring radius
Rin (semi-major axis in the elongated
case) of the extended ring, the inclination i, the position angle ϑ of the semi-major axis of
the elongated ring, and fhalo. An overview of our fit models,
their parameters, and the resulting
(1)where
V∗ =
1 is the visibility of the star, Vring is the
visibility of the ring-shaped disk, Vhalo is the visibility of the halo,
fhalo is the flux contribution of the
halo, and 1 − f∗ −
fhalo is the flux contribution of the
ring-like disk. The wavelength-dependent relative flux contribution f∗ of the
stellar component to the total emission was derived from the SED (Fig. 4). The model parameters are the inner ring radius
Rin (semi-major axis in the elongated
case) of the extended ring, the inclination i, the position angle ϑ of the semi-major axis of
the elongated ring, and fhalo. An overview of our fit models,
their parameters, and the resulting  is
presented in Table 3. We obtain inner radii between
0.78 AU (~0.5 mas) and 1.55 AU (~1.0 mas) and inclination angles in the range of ~56° to ~70°. The
large error bars of the NIR visibilities do not allow us to make a definite decision on
the elongation and the orientation of the disk as models without elongation fit the data
as well (see Table 3).
is
presented in Table 3. We obtain inner radii between
0.78 AU (~0.5 mas) and 1.55 AU (~1.0 mas) and inclination angles in the range of ~56° to ~70°. The
large error bars of the NIR visibilities do not allow us to make a definite decision on
the elongation and the orientation of the disk as models without elongation fit the data
as well (see Table 3).
Overview of the geometric models.
3.2. Temperature-gradient model
To interpret our data, we model our visibility measurements and the literature SED of HD 85567 with a temperature-gradient model. This kind of modeling has already been used for modeling AMBER data from young stars of different types by, for example, Malbet et al. (2005), Kraus et al. (2010, 2012), Kreplin et al. (2012), Chen et al. (2012), and Vural et al. (2014).
The temperature distribution T(r) of a circumstellar disk is assumed to be: T(r) = Tin·(r/rin)− q, where r is the radius, q is the temperature power-law index, and Tin the temperature at the inner disk radius rin. The disk is modeled as the sum of a large number of narrow rings; each has a temperature T(r). We integrate the blackbody spectra of the rings and the intensity distribution of these rings to obtain the total energy distribution and the visibilities. We allow the model disk to be inclined, thus introducing the inclination i (i = 0° if the disk is face-on) and the position angle ϑ (measured east of north) of the semi-major axis of the model disk as additional parameters.
Our model includes a stellar component with the parameters from Table 1 (distance, T∗, R∗, and L∗) and a surrounding circumstellar temperature-gradient disk extending to an outer radius of rout = rin + Δr. Each computed model contains the visibilities for all baseline-position angle combinations in our measurements. We calculated the models for all combinations of the parameter values as described in Table 4, where each parameter was varied in 4 to 40 steps within the described scan ranges. This method required the calculation of approximately 170 million models.
To find the best-fit temperature-gradient model, we calculated the
(using
 ) of each
model and obtained a best-fit model with
) of each
model and obtained a best-fit model with  (see
Fig. A.1 in the Appendix). The parameters of the
best-fit model are listed in Table 4 and will be
discussed in the following section. The uncertainties are 3σ errors. The model curves
are shown in Figs. 3 and 4.
(see
Fig. A.1 in the Appendix). The parameters of the
best-fit model are listed in Table 4 and will be
discussed in the following section. The uncertainties are 3σ errors. The model curves
are shown in Figs. 3 and 4.
4. Discussion
From our geometric modeling, we obtained different ring-fit radii for different star-disk
and star-disk-halo models (see Table 3). We achieve
significantly better if the model
has a halo component. The closest to one
was obtained for the geometric ring model of an elongated ring and a halo. The inner ring
radius of this model is Rin ~ 1.1 ± 0.4 AU. Wheelwright et al. (2013) estimated the ring radius with a symmetric
star-ring model including resolved background emission to 0.8 ± 0.3 AU. This value is consistent with
most of our derived ring-fit radii (Table 3). The
high visibility values and small closures phases (which are approximately zero; see Fig.
2) of our observations and of the observations
reported by Wheelwright et al. (2013) do not allow us
to detect any binary signature. Binarity is believed to be a key property in B[e] stars
(Miroshnichenko 2007).
Our geometric ring-fit radii (~0.8–1.6 AU) are approximately 3–5 times smaller than the radius predicted by the size–luminosity relation (~4.2 AU; Fig. 5). The predicted radii of the size–luminosity relation (Monnier et al. 2005) are based on the assumption that the dust sublimates at a temperature of 1500 K and the inner cavity is dust-free and optically thin. These assumptions are approximately valid for HAe stars. However, several interferometric observations suggest that some of the more massive HBe stars harbor a gaseous, optically thick disk inside the dust disk. This gas disk can partially shield the stellar radiation, thereby letting dust survive closer to the star (Monnier & Millan-Gabet 2002; Monnier et al. 2005; Millan-Gabet et al. 2007; Weigelt et al. 2011).
Our best-fit temperature-gradient model (Table 4,
Figs. 3, 4)
consists of the stellar point source and an extended disk with an inner radius of
 AU. This inner radius is approximately 1.6 to 2.3 times smaller than the elongated ring-fit
radii derived with geometric modeling (Table 3) but
also corresponds to a higher temperature. We derived a disk inclination of
AU. This inner radius is approximately 1.6 to 2.3 times smaller than the elongated ring-fit
radii derived with geometric modeling (Table 3) but
also corresponds to a higher temperature. We derived a disk inclination of
 °and a position angle of the disk
semi-major axis of
°and a position angle of the disk
semi-major axis of  °, which are similar to the values
derived with geometric modeling, but not very well constrained due to the large error bars
of the NIR visibilities (cf. Fig. A.1 in the Appendix).
The derived inner temperature
°, which are similar to the values
derived with geometric modeling, but not very well constrained due to the large error bars
of the NIR visibilities (cf. Fig. A.1 in the Appendix).
The derived inner temperature  K is too hot for the standard dust composition consisting mainly of silicates, but the
existence of refractory dust grains (e.g., iron, graphite, corundum; Benisty et al. 2010) may explain this high temperature. Gas emission
inside the dust disk can also contribute to the K-band visibility and make
the average NIR radius appear smaller (e.g., Kraus et al.
2008b). A size estimate based on the accretion rate supports the presence of an
optically thick inner disk (Wheelwright et al. 2013).
By modeling the CO bandhead emission, these authors found that a compact (inner radius
approximately 0.2–1 AU), optically thick gas disk can reproduce their measurements. This
agrees with the hypothesis of shielded stellar radiation, which leads to small dust
sublimation radii, which agrees with our observations.
K is too hot for the standard dust composition consisting mainly of silicates, but the
existence of refractory dust grains (e.g., iron, graphite, corundum; Benisty et al. 2010) may explain this high temperature. Gas emission
inside the dust disk can also contribute to the K-band visibility and make
the average NIR radius appear smaller (e.g., Kraus et al.
2008b). A size estimate based on the accretion rate supports the presence of an
optically thick inner disk (Wheelwright et al. 2013).
By modeling the CO bandhead emission, these authors found that a compact (inner radius
approximately 0.2–1 AU), optically thick gas disk can reproduce their measurements. This
agrees with the hypothesis of shielded stellar radiation, which leads to small dust
sublimation radii, which agrees with our observations.
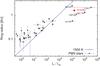 |
Fig. 5 Position of HD 85567 (red square) in the size–luminosity diagram of T Tauri stars, Herbig Ae, and Herbig Be stars. The data are taken from the literature (Eisner et al. 2004; Monnier et al. 2005; Kraus et al. 2008a; Pinte et al. 2008; Weigelt et al. 2011; Chen et al. 2012; Kreplin et al. 2012; Vural et al. 2012; Wang et al. 2012; Kreplin et al. 2013; Vural et al. 2014). The solid line shows the theoretical dependence of the inner ring radius on the luminosity for an optically thin disk hole and a dust sublimation temperature of 1500 K (Monnier et al. 2005). |
5. Conclusion
We used geometric and temperature-gradient models to interpret our VLTI/AMBER data and the SED of the Herbig B[e] star HD 85567. We derived geometric ring models with inner radii of 0.8–1.6 AU, which are approximately 3–5 times smaller than that predicted by the size–luminosity relation. Using temperature-gradient modeling, we found a hot (Tin ~ 2200 K) inner disk rim with a small (rin ~ 0.67 AU) inner radius. The undersized inner disk radius obtained with both geometric and temperature-gradient modeling agrees with measurements of several other HBe stars and with previous measurements of this
object. The small inner radius provides further support to the existence of an optically thick gaseous inner disk shielding the stellar radiation in Herbig Be stars.
Online material
Appendix A: χ 2 -maps
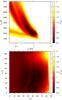 |
Fig. A.1 Two-dimensional |
Acknowledgments
This research has made use of the NASA/ IPAC Infrared Science Archive, which is operated by the Jet Propulsion Laboratory, California Institute of Technology, under contract with the National Aeronautics and Space Administration. We thank our ESO colleagues at the Paranal observatory for their excellent collaboration.
References
- Baines, D., Oudmaijer, R. D., Porter, J. M., & Pozzo, M. 2006, MNRAS, 367, 737 [NASA ADS] [CrossRef] [MathSciNet] [Google Scholar]
- Benisty, M., Natta, A., Isella, A., et al. 2010, A&A, 511, A74 [NASA ADS] [CrossRef] [EDP Sciences] [Google Scholar]
- Chelli, A., Utrera, O. H., & Duvert, G. 2009, A&A, 502, 705 [NASA ADS] [CrossRef] [EDP Sciences] [Google Scholar]
- Chen, L., Kreplin, A., Wang, Y., et al. 2012, A&A, 541, A104 [NASA ADS] [CrossRef] [EDP Sciences] [Google Scholar]
- Dullemond, C. P., & Monnier, J. D. 2010, ARA&A, 48, 205 [NASA ADS] [CrossRef] [Google Scholar]
- Dullemond, C. P., Dominik, C., & Natta, A. 2001, ApJ, 560, 957 [NASA ADS] [CrossRef] [Google Scholar]
- Eisner, J. A., Lane, B. F., Akeson, R. L., Hillenbrand, L. A., & Sargent, A. I. 2003, ApJ, 588, 360 [NASA ADS] [CrossRef] [Google Scholar]
- Eisner, J. A., Lane, B. F., Hillenbrand, L. A., Akeson, R. L., & Sargent, A. I. 2004, ApJ, 613, 1049 [NASA ADS] [CrossRef] [Google Scholar]
- Ilee, J. D. 2013, Ph.D. Thesis, University of Leeds [Google Scholar]
- Kraus, S., Hofmann, K.-H., Benisty, M., et al. 2008a, A&A, 489, 1157 [NASA ADS] [CrossRef] [EDP Sciences] [Google Scholar]
- Kraus, S., Preibisch, T., & Ohnaka, K. 2008b, ApJ, 676, 490 [NASA ADS] [CrossRef] [Google Scholar]
- Kraus, S., Hofmann, K.-H., Menten, K. M., et al. 2010, Nature, 466, 339 [NASA ADS] [CrossRef] [MathSciNet] [PubMed] [Google Scholar]
- Kraus, S., Calvet, N., Hartmann, L., et al. 2012, ApJ, 752, 11 [NASA ADS] [CrossRef] [Google Scholar]
- Kreplin, A., Kraus, S., Hofmann, K.-H., et al. 2012, A&A, 537, A103 [NASA ADS] [CrossRef] [EDP Sciences] [Google Scholar]
- Kreplin, A., Weigelt, G., Kraus, S., et al. 2013, A&A, 551, A21 [NASA ADS] [CrossRef] [EDP Sciences] [Google Scholar]
- Lafrasse, S., Mella, G., Bonneau, D., et al. 2010, VizieR Online Data Catalog: II/300 [Google Scholar]
- Lamers, H. J. G. L. M., Zickgraf, F.-J., de Winter, D., Houziaux, L., & Zorec, J. 1998, A&A, 340, 117 [NASA ADS] [Google Scholar]
- Malbet, F., Lachaume, R., Berger, J.-P., et al. 2005, A&A, 437, 627 [Google Scholar]
- Malfait, K., Bogaert, E., & Waelkens, C. 1998, A&A, 331, 211 [NASA ADS] [Google Scholar]
- Millan-Gabet, R., Schloerb, F. P., & Traub, W. A. 2001, ApJ, 546, 358 [NASA ADS] [CrossRef] [Google Scholar]
- Millan-Gabet, R., Malbet, F., Akeson, R., et al. 2007, in Protostars and Planets V, 539 [Google Scholar]
- Miroshnichenko, A. S. 2007, ApJ, 667, 497 [NASA ADS] [CrossRef] [Google Scholar]
- Miroshnichenko, A. S., Levato, H., Bjorkman, K. S., & Grosso, M. 2001, A&A, 371, 600 [NASA ADS] [CrossRef] [EDP Sciences] [Google Scholar]
- Monnier, J. D., & Millan-Gabet, R. 2002, ApJ, 579, 694 [NASA ADS] [CrossRef] [Google Scholar]
- Monnier, J. D., Millan-Gabet, R., Billmeier, R., et al. 2005, ApJ, 624, 832 [NASA ADS] [CrossRef] [Google Scholar]
- Natta, A., Prusti, T., Neri, R., et al. 2001, A&A, 371, 186 [NASA ADS] [CrossRef] [EDP Sciences] [Google Scholar]
- PasinettiFracassini, L. E., Pastori, L., Covino, S., & Pozzi, A. 2001, A&A, 367, 521 [NASA ADS] [CrossRef] [EDP Sciences] [Google Scholar]
- Petrov, R. G., Malbet, F., Weigelt, G., et al. 2007, A&A, 464, 1 [NASA ADS] [CrossRef] [EDP Sciences] [Google Scholar]
- Pinte, C., Ménard, F., Berger, J. P., Benisty, M., & Malbet, F. 2008, ApJ, 673, L63 [NASA ADS] [CrossRef] [Google Scholar]
- Tatulli, E., Millour, F., Chelli, A., et al. 2007, A&A, 464, 29 [NASA ADS] [CrossRef] [EDP Sciences] [Google Scholar]
- Verhoeff, A. P., Waters, L. B. F. M., van den Ancker, M. E., et al. 2012, A&A, 538, A101 [NASA ADS] [CrossRef] [EDP Sciences] [Google Scholar]
- Vural, J., Kreplin, A., Kraus, S., et al. 2012, A&A, 543, A162 [NASA ADS] [CrossRef] [EDP Sciences] [Google Scholar]
- Vural, J., Kreplin, A., Kishimoto, M., et al. 2014, A&A, 564, A118 [NASA ADS] [CrossRef] [EDP Sciences] [Google Scholar]
- Wang, Y., Weigelt, G., Kreplin, A., et al. 2012, A&A, 545, L10 [NASA ADS] [CrossRef] [EDP Sciences] [Google Scholar]
- Weigelt, G., Grinin, V. P., Groh, J. H., et al. 2011, A&A, 527, A103 [NASA ADS] [CrossRef] [EDP Sciences] [Google Scholar]
- Wheelwright, H. E., Weigelt, G., Caratti o Garatti, A., & GarciaLopez, R. 2013, A&A, 558, A116 [NASA ADS] [CrossRef] [EDP Sciences] [Google Scholar]
All Tables
All Figures
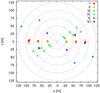 |
Fig. 1 The uv coverage of our AMBER measurements of HD 85567 (see Table 2). |
| In the text | |
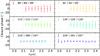 |
Fig. 2 Derived closure phases. The color coding is the same as in Fig. 1. |
| In the text | |
|
Fig. 3 Comparison of the visibilities of the best-fit temperature-gradient model (red line; see Table 4) with the wavelength-dependent AMBER visibilities (blue dots). The wavelength range of the visibilities is different for all measurements because of different data quality as explained in Sect. 2. |
| In the text | |
|
Fig. 4 Left: observed SED (black diamonds) and SED of the best-fit temperature-gradient model (Table 4). The total SED (red line) consists of the stellar flux (Kurucz model, black dashed line) and the flux of the temperature-gradient disk (black solid line). Right: two-dimensional intensity distribution of the best-fit model at 2 μm. The color-scaling is linear in arbitrary units. The star is not displayed. |
| In the text | |
|
Fig. 5 Position of HD 85567 (red square) in the size–luminosity diagram of T Tauri stars, Herbig Ae, and Herbig Be stars. The data are taken from the literature (Eisner et al. 2004; Monnier et al. 2005; Kraus et al. 2008a; Pinte et al. 2008; Weigelt et al. 2011; Chen et al. 2012; Kreplin et al. 2012; Vural et al. 2012; Wang et al. 2012; Kreplin et al. 2013; Vural et al. 2014). The solid line shows the theoretical dependence of the inner ring radius on the luminosity for an optically thin disk hole and a dust sublimation temperature of 1500 K (Monnier et al. 2005). |
| In the text | |
|
Fig. A.1 Two-dimensional |
| In the text | |
Current usage metrics show cumulative count of Article Views (full-text article views including HTML views, PDF and ePub downloads, according to the available data) and Abstracts Views on Vision4Press platform.
Data correspond to usage on the plateform after 2015. The current usage metrics is available 48-96 hours after online publication and is updated daily on week days.
Initial download of the metrics may take a while.