Fig. 4
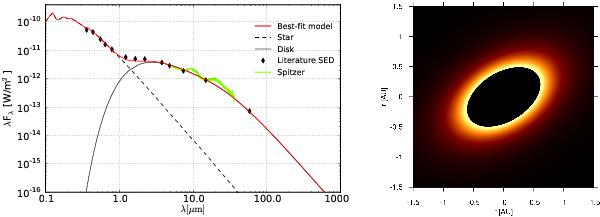
Left: observed SED (black diamonds) and SED of the best-fit temperature-gradient model (Table 4). The total SED (red line) consists of the stellar flux (Kurucz model, black dashed line) and the flux of the temperature-gradient disk (black solid line). Right: two-dimensional intensity distribution of the best-fit model at 2 μm. The color-scaling is linear in arbitrary units. The star is not displayed.
Current usage metrics show cumulative count of Article Views (full-text article views including HTML views, PDF and ePub downloads, according to the available data) and Abstracts Views on Vision4Press platform.
Data correspond to usage on the plateform after 2015. The current usage metrics is available 48-96 hours after online publication and is updated daily on week days.
Initial download of the metrics may take a while.