| Issue |
A&A
Volume 569, September 2014
|
|
|---|---|---|
| Article Number | A68 | |
| Number of page(s) | 11 | |
| Section | Extragalactic astronomy | |
| DOI | https://doi.org/10.1051/0004-6361/201423880 | |
| Published online | 25 September 2014 | |
A low H I column density filament in NGC 2403: signature of interaction or accretion⋆
1 Netherlands Institute for Radio Astronomy (ASTRON), Postbus
2, 7990 AA Dwingeloo, The Netherlands,
e-mail:
This email address is being protected from spambots. You need JavaScript enabled to view it.
2
Astrophysics, Cosmology and Gravity Centre, Department of
Astronomy, University of Cape Town, Private Bag X3, 7701
Rondebosch, South
Africa
3
Kapteyn Astronomical Institute, University of Groningen,
PO Box 800,
9700 AV
Groningen, The
Netherlands
4
Rincon Research Corporation, Tucson, AZ
85711,
USA
5
WVU Dept. of Physics & Astronomy, PO Box 6315,
Morgantown,
WV
26506,
USA
6
Department of Physics and Astronomy, University of
Bologna, via Berti Pichat
6/2, 40127
Bologna,
Italy
7
Max-Planck Institut für Astronomie, Königstuhl 17, 69117
Heidelberg,
Germany
8
Centre for Astrophysics Research, University of Hertfordshire,
College Lane,
Hatfield
AL10 9AB,
UK
9
Institut für theoretische Astrophysik, Zentrum für Astronomie der
Universität Heidelberg, Albert-Ueberle Str. 2, 69120
Heidelberg,
Germany
10
National Radio Astronomy Observatory, 520 Edgemont Road, Charlottesville, VA
22903,
USA
Received: 25 March 2014
Accepted: 12 July 2014
Abstract
Observed H i accretion around nearby galaxies can only account for a fraction of the gas supply needed to sustain the currently observed star formation rates. It is possible that additional accretion occurs in the form of low column density cold flows, as predicted by numerical simulations of galaxy formation. To constrain the presence and properties of such flows, we present deep H i observations obtained with the NRAO Green Bank Telescope of an area measuring 4° × 4° around NGC 2403. These observations, with a 5σ detection limit of 2.4 × 1018 cm-2 over a 20 km s-1 linewidth, reveal a low column density, extended cloud outside the main H i disk, about 17′ (~ 16 kpc or ~ 2 R25) to the NW of the center of the galaxy. The total H i mass of the cloud is 6.3 × 10⁶ M⊙, or 0.15 percent of the total H i mass of NGC 2403. The cloud is associated with an 8 kpc anomalous-velocity H i filament in the inner disk, that was previously observed in deep VLA observations. We discuss several scenarios for the origin of the cloud, and conclude that it is either accreting from the intergalactic medium, or is the result of a minor interaction with a neigboring dwarf galaxy.
Key words: galaxies: ISM / galaxies: kinematics and dynamics / galaxies: halos / galaxies: individual: NGC 2403 / galaxies: structure
The reduced datacubes (FITS files) are only available at the CDS via anonymous ftp to cdsarc.u-strasbg.fr (130.79.128.5) or via http://cdsarc.u-strasbg.fr/viz-bin/qcat?J/A+A/569/A68
Adjunct Assistant Astronomer at NRAO-Green Bank, PO Box 2, Green Bank, WV 24944, USA.
© ESO, 2014
1. Introduction
Accretion of gas from the intergalactic medium (IGM) is often proposed as a mechanism for galaxies to obtain sufficient gas to maintain their star formation rate over cosmic time. There is little direct observational evidence that can constrain the existence of the accretion and the magnitude of the accretion rates, however. In a recent review, Sancisi et al. (2008) made an inventory of possible signatures of gas accretion in and around nearby galaxies. They found an average visible H i accretion rate of ~ 0.2 M⊙ year-1, which is an order of magnitude too low to sustain the current star formation rates of the galaxies studied.
Searches for accreting gas are hampered by the difficulty of distinguishing external, accreting gas from gas that has been expelled from the disk by processes of star formation (the so-called galactic fountain; Shapiro & Field 1976). In many cases, sophisticated three-dimensional modeling of the H i data cube is required to do this. Recent examples of this kind of analysis are presented in papers from the HALOGAS survey (Hydrogen Accretion in LOcal GAlaxieS; Heald et al. 2011), a deep H i survey of 24 nearby galaxies that searches, among other goals, for signs of accretion in these galaxies (see Gentile et al. 2013; Kamphuis et al. 2013; Zschaechner et al. 2011, 2012).
These questions were also highlighted in earlier deep surveys of two nearby galaxies, NGC 891 and NGC 2403. Deep H i observations of the edge-on galaxy NGC 891 showed the presence of H i far above the main disk (Swaters et al. 1997; Oosterloo et al. 2007). Most of this H i was found to be rotating with the disk, but lagging slightly. This slower rotation of the extra-planar gas can be explained within the context of the galactic fountain model (Fraternali & Binney 2006). A smaller fraction of the extra-planar H i in NGC 891 was found to be at velocities inconsistent with circular rotation (Oosterloo et al. 2007). This gas is thought to be accreting. A number of the prominent H i filaments in NGC 891 are also difficult to explain with the galactic fountain model.
A second galaxy where prominent, lagging extra-planar H i is detected is NGC 2403 (Fraternali et al. 2001, 2002). This galaxy is observed at an intermediate inclination of 63°, which has the advantage that signs of in- or outflow of the gas can be detected directly. Modeling by Fraternali et al. (2001, 2002) and Fraternali & Binney (2008) showed that the kinematics of the extraplanar gas in NGC 2403 is consistent with inflow, and this could therefore be a sign of accretion.
The analyses described above were conducted using data obtained with the Very Large Array (VLA) or the Westerbork Synthesis Radio Telescope (WSRT), that is, radio-interferometric telescopes. While they have excellent spatial resolution, a large observing effort is required to reach the low column density levels where one expects to see signs of accretion. For this reason, we have started a survey of a number of nearby galaxies (mainly taken from the THINGS survey; Walter et al. 2008) using the Green Bank Telescope (GBT), with the goal of obtaining the deepest maps of these galaxies acquired so far, and to quantify the presence of low column density, and possibly accreting, features around these galaxies. A full description and first results of this survey will be presented elsewhere (Pisano 2014; Pisano et al., in prep.).
Here we report on the discovery, using GBT observations, of an extended, low-column density H i feature close to and possibly connected with NGC 2403. We describe the observations in Sect. 2. In Sect. 3, we argue that the feature is associated with an anomalous-velocity H i complex discovered in earlier high-resolution VLA observations (Fraternali et al. 2001, 2002). In Sect. 4 we describe various evolution scenarios for the feature. We summarize our results in Sect. 5.
2. Observations
NGC 2403 is a nearby (D = 3.2 Mpc; 1′ = 0.93 kpc) late-type spiral, and part of the M 81 group. It has an absolute luminosity MB = −19.4, an extended H i disk, and an inclination of 63°. It has a well-defined, symmetrical rotation curve, with a maximum rotation velocity of 135 km s-1. Its heliocentric systemic velocity is 132.8 km s-1. See Walter et al. (2008), de Blok et al. (2008), and Trachternach et al. (2008) for more detailed information regarding general properties of NGC 2403.
2.1. GBT observations
Observations of NGC 2403 were carried out with the 100 m Robert C. Byrd Green Bank Telescope (GBT) of the NRAO1 in 21 sessions between 29 May and 30 September 2009. We observed a 4° × 4° area centered on NGC 2403. Strips of constant right ascension and declination, spaced by 3′, were observed to form a “basket weave” pattern over the region. The spacing and integration times ensure Nyquist-sampling. The total integration time for the entire map was approximately 127 h, corresponding to an integration time per beam of ~ 11 min. The GBT spectrometer was used with a bandwidth of 12.5 MHz. This corresponds to a velocity range from −885 km s-1<vLSR< 1750 km s-1. The typical system temperature for each channel of the dual-polarization receiver was ~20 K.
A reference spectrum for each of the sessions was made by observing an emission-free region about 4.75° away from the galaxy. The reference spectrum was then used to perform a (signal-reference)/reference calibration of each pixel. The calibrated spectra were scaled by the system temperature and corrected for atmospheric opacity and GBT efficiency. We adopted the GBT efficiency Eq. (1) from Langston & Turner (2007) with a zenith atmospheric opacity τ0 = 0.009. The data were reduced using custom routines developed using GBTIDL2.
The frequency range observed was relatively free of radio-frequency interference (RFI), with ~ 5% of all spectra adversely affected. Spectra that showed high noise values across many channels were flagged and removed. After amplitude calibration and gridding, a first-order polynomial was fit to line-free regions of the spectra and subtracted from the gridded spectra.
Data from all observing sessions were converted to a heliocentric velocity scale and combined into a single data cube. To match the typical linewidths of neutral hydrogen features observed around galaxies, spectra were smoothed to a velocity resolution of 5.2 km s-1. The effective angular resolution is 8.7′, and we used a pixel size of 1.75′. The calibration from K to Jy was derived by observing 3C286 in the same way as the H i maps. The final scale factor from K to Jy is 0.43 ± 0.03. Because of remaining low-level RFI and residual continuum emission, the noise level varies by 20% throughout the cube. The average RMS noise in the final data cube is 6.0 mJy beam-1 or 13.6 mK per 5.2 km s-1 channel. This translates into a 1σ column density sensitivity of 1.3 × 1017 cm-2 per channel, or a 5σ sensitivity of 2.4 × 1018 cm-2 for a 20 km s-1 full width at half maximum H i line.
2.2. Deep VLA observations
We compared the GBT data with deep VLA observations obtained by Fraternali et al. (2001, 2002). They observed NGC 2403 for 40 h with the VLA in its CS configuration. Here we used the 30′′ data presented in Fraternali et al. (2002). The data cube was created using a robustness parameter of 0 and a taper of 27′′. The channel spacing is 5.15 km s-1. The data were Hanning-smoothed, which led to an effective velocity resolution of 10.3 km s-1. The synthesized beam size of this cube is 29.7′′ × 29.3′′ and the column density sensitivity limit for a 5σ detection over one velocity resolution element is 2.0 × 1019 cm-2. See Fraternali et al. (2002) for more details.
In addition, we smoothed the 30′′ cube spatially to a resolution of 60′′ and 90′′, and to the GBT resolution of 8.7′ (using a simple Gaussian smoothing function). We used these cubes later to determine how much of the H i detected with the GBT was also detected by the deep VLA observations.
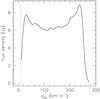 |
Fig. 1 Global H i profile of NGC 2403 derived from the GBT data. The dotted line indicates vhel = 10 km s-1. Below this velocity, Galactic emission affects the data and emission from NGC 2403 could not be unambiguously identified. |
3. Analysis
3.1. GBT channel maps and moment maps
To derive the total H i mass and the global velocity profile, we clipped the GBT data cube at 2.5σ, and removed by hand a small number of spurious noise peaks (caused by low-level residual RFI). The rotation and systemic velocity of NGC 2403 mean that for radial velocities below vhel ~ 10 km s-1 galaxy emission overlaps with Galactic emission. Based on symmetry considerations, the velocity range where we cannot recover the NGC 2403 H i distribution is small however.
Figure 1 shows the global H i profile. We find a total flux of 1677.1 Jy km s-1. This does not include any emission below vhel = 10 km s-1, but it is clear from Fig. 1 that this will be only a small fraction of the total flux. Assuming a distance of 3.2 Mpc, we find an H i mass of 4.03 × 10⁹ M⊙. This is higher than was found in previous observations. Single-dish data by Rots (1980) yield a total flux of 1448.1 Jy km s-1 or an H i mass of 3.50 × 10⁹ M⊙. Interferometric data by Begeman (1987) gave an H i mass of 3.0 × 10⁹ M⊙, observations by Sicking (1997) 3.13 × 10⁹ M⊙, and deep observations by Fraternali et al. (2002) 3.28 × 10⁹ M⊙ (all values corrected to D = 3.2 Mpc).
Uncertainties in interferometrically measured H i masses are usually dominated by calibration uncertainties, bandpass corrections, selection of masks, etc., and not by the formal statistical uncertainties. They are therefore difficult to quantify. An empirically motivated estimate of the uncertainties is ~ 10%. This value is higher than the formal statistical uncertainty, which tends to be a few percent at most for bright sources such as considered here (cf. the values quoted in Begeman 1987 and Sicking 1997). Comparing the above measurements with the GBT observations, we see that the latter detect 20% more flux, which is a significantly higher value.
Part of this additional flux probably is due to the larger area observed by the GBT compared with the single interferometer pointings. However, we also detect more flux than found in the Rots (1980) single-dish data. Rots (1980) surveyed a similar area as our observations, therefore the difference cannot be due to a more limited field of view. A comparison between the two single-dish global profiles shows that our observations detect more flux over the entire velocity range of the galaxy. Although this could be a calibration problem, it is more likely that our new GBT observations, which are approximately 50–100 times more sensitive in terms of column density, detect more low column density H i. For example, the low column density kinematically anomalous H i detected by Fraternali et al. (2001, 2002) has a total H i mass of ~ 3 × 10⁸ M⊙, which could explain a large part of the difference in the derived single-dish masses.
Selected channel maps from the GBT data cube are shown in Fig. 2. The emission from the main disk of NGC 2403 is symmetric and regular, although the velocity field (see below) indicates that the outer disk is slightly warped. In the channel maps between v = 150.5 and 104.1 km s-1 we see a faint extension to the NW of the main emission component, indicated by the arrow in the v = 140.2 km s-1 panel. This cloud seems to connect with the main disk at lower velocities, but looks separate from it toward higher velocities. All velocities mentioned here and below are heliocentric velocities.
Using the clipped data cube described above, we created moment maps that show the integrated emission (zeroth moment) and the intensity-weighted average velocity (first moment). These are shown in the left-hand panels in Fig. 3. In this figure, we also show for comparison (in the right-hand panels) the integrated H i map and velocity field derived from the 30′′ VLA data set from Fraternali et al. (2002). The H i distribution in the GBT data, even when taking the different beam sizes into account, extends farther out than in the VLA data. Part of this is due to the size of the primary beam of the VLA. Figure 4 shows the 50 percent and 10 percent sensitivity VLA primary beam sizes overplotted on the VLA integrated H i map. The NGC 2403 emission as observed by the VLA extends to the edge of the 50 percent sensitivity primary beam. Beyond this radius the primary beam sensitivity drops rapidly, hampering the detection of any emission that may be present there. This emission is detected by the GBT observations, however, which do not suffer from primary-beam effects.
The velocity field derived from the GBT data cube appears to be regular, and shows signs of a slight warp in the outer parts, as indicated by a small variation of the position angle of the kinematical major axis.
In addition to the full data cube used to create the moment maps discussed above, we also created a cube containing only the emission from the cloud. For this we applied an intensity cut to remove the very bright emission from the main disk. We created an integrated H i map of the cloud, which is shown in the top panels of Fig. 3 overlaid on the GBT and VLA maps. The cloud clearly overlaps with the main disk as seen at the GBT resolution. The high contrast between cloud and disk emission, combined with the relatively large size of the beam, means that we can only identify cloud emission where (in the channel maps) it does not overlap with the main disk (see, e.g., Fig. 2 at v = 124.8 km s-1, where the cloud emission merges in projection with the main disk emission). It is therefore likely that the cloud extends farther toward the SE than Fig. 2 suggests, and that the SE edge is artificial. Because of the confusion with Galactic emission it is not possible to establish whether other low column density features are present in the channels with v< 10 km s-1. If they were, they would not be related to the cloud because of the different spatial location of the main disk H i at these velocities.
The total H i mass of the cloud is 6.3 × 10⁶ M⊙, or about 0.15 percent of the total H i mass of NGC 2403. The radial distance of the highest column density part of the cloud to the center of NGC 2403 is ~ 17′ (corresponding to ~16 kpc or ~ 2 times R25). The H i mass is a lower limit because, as noted above, we can only identify cloud emission when it is not projected against the main disk.
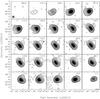 |
Fig. 2 Selected channel maps of the GBT data cube. Contour levels are −2σ (gray dashed contours) and (2,4,8,16,32,64,128,256,512,1024)σ (full contours) where σ = 6 mJy beam-1. This corresponds within a single channel to a column density of 1.25 × 1017 cm-2. Heliocentric velocities of the channels in km s-1 are shown in the top-right of each channel. From 150.5 to 104.1 km s-1 every channel is shown. Outside this range only every third channel is shown. The GBT beam is shown in the bottom-left corner of the top-left panel. Channels in the bottom row are marginally affected by Galactic emission. In the 140.2 km s-1 panel the arrow indicates cloud emission. |
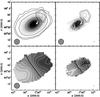 |
Fig. 3 H i moment maps of NGC 2403. Top-left: integrated H i map derived from the GBT data. Thick dark-gray contours show the H i distribution of the entire galaxy. Contour levels are 5 × 10¹⁷, 5 × 10¹⁸, 5 × 10¹⁹, and 5 × 1020 cm-2. The gray-scale runs from 5 × 10¹⁷ (white) to 1.5 × 1021 cm-2 (black). Thin, black contours show the H i distribution of the cloud. Contour levels are (6.25, 12.5, 25, 62.5) × 1017 cm-2. White contours indicate the location of the 8 kpc filament. The GBT beam is shown in the bottom-left corner. Top-right: integrated H i map derived from the 30′′ VLA data from Fraternali et al. (2002). The gray-scale runs from 2 × 10¹⁹ (white) to 2 × 1021 cm-2 (black). Contours are as in the top-left panel. The VLA beam is indicated in the bottom-right corner. Bottom-left: intensity-weighted mean velocity field derived from the GBT data. The thick black contour indicates v = 130 km s-1. White contours decrease with respect to this value in steps of 20 km s-1. Black contours increase in steps of 20 km s-1. Bottom-right: intensity-weighted mean velocity field derived from the 30′′ VLA data. Contours are as in the bottom-left panel. |
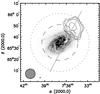 |
Fig. 4 View of the cloud-filament complex. The gray-scales show the integrated H i distribution derived from the 30′′ VLA data and run from 2 × 10¹⁹ (white) to 2 × 1021 cm-2 (black). Thin, black contours show the H i distribution of the cloud derived from the GBT data. Contour levels are (6.25, 12.5, 25, 62.5) × 1017 cm-2. White contours show the 8 kpc filament, derived from the 30′′ VLA data. The contour level is 2 × 1019 cm-2. The highest column density found in the filament is 6.5 × 1019 cm-2. The GBT and 30′′ VLA beams are indicated in the bottom-left corner. The thick gray line shows the location of the position-velocity slice shown in Fig. 6. The long-dashed circle indicates the 50 percent sensitivity level of the VLA primary beam. The short-dashed circle shows the 10 percent level. |
3.2. Comparison with deep VLA observations
We compared the GBT data with the deep, single-pointing VLA H i study of NGC 2403 by Fraternali et al. (2001, 2002) as described in Sect. 2.2.
One of the main results of this study is the detection of an extended, kinematically anomalous H i component in NGC 2403, which Fraternali et al. (2001, 2002) interpreted as a thicker disk that rotates more slowly than the thin, main, cold H i disk. The velocity field of the thick component shows evidence for inflow motion towards the center. In addition, Fraternali et al. (2001, 2002) reported gas at forbidden velocities, that is, with velocities that preclude that it is part of the regular rotation of the disk.
In addition, NGC 2403 was found to contain a number of kinematically anomalous H i complexes that are not at forbidden velocities, but nevertheless deviate from regular, circular rotation. Fraternali et al. (2001, 2002) interpreted the anomalous gas as a sign of accretion.
One of the most prominent of these anomalous H i complexes is a filament with an H i mass of ~ 1 × 10⁷ M⊙, located in the inner disk, with a velocity that differs 60–100 km s-1 from the local rotation, and which is referred to as the “8 kpc filament” by Fraternali et al. (2002).
Fraternali et al. (2002) fitted Gaussians to the peaks of the H i profiles and subtracted them from the data to isolate emission with anomalous velocities. We also used this method to separate out the emission from the 8 kpc filament in the VLA data cube. We show an integrated H i map of this filament superimposed on that of the main disk in the top panels of Fig. 3 (see also Figs. 7 and 8 in Sancisi et al. 2008). These figures immediately show that the 8 kpc filament points toward the cloud seen by the GBT.
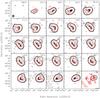 |
Fig. 5 Selected channel maps of the GBT data cube superimposed on corresponding channel maps from the deep VLA data. The GBT data are shown in black contours. Black contours levels are (2.5,5 [ thick contour ] ,10,50) × 1017 cm-2. Gray, dashed contours denote −2.5 × 1017 cm-2 in the GBT data. The gray-scale shows the H i emission in the deep 30′′ cube from Fraternali et al. (2002). The thin, red contour surronding this emission shows the 5 × 1018 cm-2 in these VLA data. The thick, red, dashed contours show the 5 × 1017 cm-2 level in the VLA data when smoothed to the GBT resolution of 8.7′. This is the same column density as shown by the thick black contour. None of the VLA contours or gray-scales are corrected for primary-beam effects. The panel in the bottom-right is affected by Galactic emission. The GBT beam is shown in the bottom-left corner of the top-left panel. The two small features to the north of the main emission, as indicated by the thick red contour at v = 258.7 and 243.3 kms s-1 are data artifacts caused by the severe smoothing. |
We compare this in more detail in Fig. 5, where we again show the GBT channel maps from Fig. 2, but this time superimposed on the corresponding deep VLA data channel maps from Fraternali et al. (2002). Because of the large area shown, the VLA data are not corrected for primary beam effects.
In the VLA data in Fig. 5, note the finger of emission pointing to the NW away from the main emission between 150.5 and 109.3 km s-1. This is the 8 kpc filament. There is a clear correlation between the appearance of this finger in the VLA data and the cloud emisson in the GBT data, which strongly indicates that the cloud and filament are associated, and likely form one single complex. As mentioned earlier, the spatial separation between the filament and cloud features is probably artificial, because of our inability to detect faint cloud emission projected against the bright main disk. We plot two channel maps in more detail in the bottom panels of Fig. 6, where we show the GBT emission superimposed on the VLA data smoothed to 60′′. The higher sensitivity that we achieve from the spatial smoothing allows us to trace the finger further out, to the point where it touches the cloud emission detected by the GBT. In addition to the spatial continuity, there is also a clear velocity continuity that we illustrate using the position-velocity (pV) diagram shown in the top panel of Fig. 6. The pV diagram was created by taking a slice through the VLA and GBT cubes that cuts through both the center of the cloud and the filament, as indicated by the line in Fig. 4. Because of the large difference in resolution between the two datasets, we chose different thicknesses for the slices. For the GBT data we extracted a slice with a thickness of one GBT beam width. To maximize the signal in the VLA data, we extracted a slice with a thickness of 100′′, corresponding to the average width of the filament. The comparison between the slices in Fig. 6 clearly shows that the filament and the cloud occur at the same velocities (and only those velocities). The clear spatial and velocity association strongly suggests that the cloud and the filament form one single complex.
The link with the 8 kpc filament definitively precludes that the cloud is a Galactic foreground object unrelated to NGC 2403. Such objects are known to exist in this part of the sky (Chynoweth et al. 2009), but they are typically found at velocities of ~ −150 km s-1 and are therefore likely to be part of the Milky Way high-velocity cloud population.
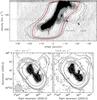 |
Fig. 6 Comparison of GBT and 30′′ VLA data. Top panel: pV slice through centers of the cloud and 8 kpc filament. Position and orientation of the slice is indicated in Fig. 4. The thickness of the slice through the VLA data is 100′′; the thickness of the slice through the GBT data is one GBT beam. The gray-scale shows the VLA data with (2.5,5) × 1018 cm-2 contours overplotted in dark-gray. The black contours show the GBT data at (5,10,25,50,100)σ, where σ corresponds to 3 × 1017 cm-2. The cloud is detected at the > 10σ level. The thick, red contour shows the VLA data smoothed to the GBT resolution at the 5 × 1017 cm-2 level. The emission detected by the GBT is clearly more extended. The VLA contours and gray-scales are not corrected for primary beam effects. The hatched area at the top indicates velocities affected by Galactic emission. The cloud and 8 kpc filament are indicated by arrows. The two horizontal lines indicate the velocities of the channel maps shown in the bottom panels. Bottom panels: channel maps at v = 135.1 km s-1 (left) and v = 124.8 km s-1 (right). In both panels the gray-scale shows the VLA data at 60′′. Thin dark-gray contours show VLA column density levels at (1,5) × 1018 cm-2. Thin white contours show VLA column density levels at (25,50,250) × 1018 cm-2. The lowest contour of 1 × 1018 cm-2 corresponds to ~ 2.5σ. Features in the extreme top-right and bottom-left of the channel maps are deconvolution artifacts. The thick black contours show GBT column density levels and are the same as in Fig. 5. The GBT beam and the 60′′ VLA beam are shown in the bottom-left corner of the left channel map. |
We investigated whether the filament could be traced even farther out toward the cloud by convolving the 30′′ VLA data to a beam size of 90′′. We created a moment map of all emission between 119.6 and 150.4 km s-1 (cf. Fig. 6). No clipping or masking was applied. The resulting map is shown in Fig. 7. Compared with the 30′′ data, the emission extends twice as far and the tip of the filament overlaps with the SE part of the cloud. Figure 7 shows hints that at the ~ 1.5σ to ~ 2σ level the filament extends even farther toward the center of the cloud. However, at this level, the data are also affected by deconvolution artifacts (present as faint features in the bottom-left and top-right of the plot), which partly overlap with the possible faint extension. In the absence of deeper high-resolution data it is therefore difficult to say more about this low-level extension. Nevertheless, in Fig. 7, the main filament feature is present at high significance levels and just overlaps with the (likely artificial) SE edge of the cloud, further suggesting that this is a single cloud/filament complex.
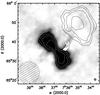 |
Fig. 7 Integrated H i map of the emission between 119.6 and 150.4 km s-1 derived from the deep VLA data at 90′′ resolution (gray-scale). Light-gray contours show (5, 10, 20, 50, 100, 200) × 1018 cm-2 column density levels. The noise in the map corresponds to 2 × 1018 cm-2 and the lowest VLA contour corresponds to ~ 2.5σ. Thin black contours show the GBT cloud, thick white contours the 8-kpc filament at 30′′ resolution. Contours as in Fig. 4. The 90′′ VLA beam is indicated in the bottom-right corner, the GBT beam in the bottom-left corner. |
But is the cloud as seen by the GBT indeed a new feature that has not been seen before, or is it simply the already known 8 kpc filament as observed with the VLA, but smoothed to a lower resolution? To answer this, we used the VLA data cube smoothed to the GBT resolution, as described in Sect. 2.2. We compared corresponding channel maps and a position-velocity slice of this smoothed VLA data set and the GBT data in Figs. 5 and 6, respectively. From these figures it is clear that the cloud emission was not detected in the single-pointing VLA observations, and that the GBT observations show additional H i. An explanation for this was already mentioned: the single-pointing VLA observation has a limited field of view, and as can be seen in Fig. 4, the cloud is located in the region of the primary beam where the VLA sensitivity has dropped to between 50 and 10 percent of the central value.
Can we say anything about the column densities of the cloud compared with that of the filament? The H i mass of the cloud is 6.3 × 10⁶ M⊙. If we take the dimensions of the cloud to be 16′ × 12′ (i.e., the angular size of the cloud as shown in Fig. 4 corrected for the GBT beam size), then the average H i column density of the cloud is ~ 6 × 1018 cm-2 assuming a uniform distribution. This would not be detected by the deep VLA observations.
Because of the GBT beam size we, however, cannot distinguish between smooth emission that fills the beam, or a more clumpy, higher column density distribution with a smaller beam-filling factor. To take the other extreme, if we assume that the H i in the cloud has a size and distribution identical to that of the 8 kpc filament, the inferred average column density increases to ~ 6 × 1019 cm-2. The column densities in the actual observed 8 kpc filament are in the range (~ 3 to ~ 6) × 1019 cm-2, which is consistent with this value.
It would still be difficult to detect this more compact emission in the existing 30′′ VLA data, however. Placing the observed 8 kpc filament at the position of the cloud means applying a primary beam loss of sensitivity of a factor of ~ 0.4. The resulting apparent column density would thus be (~ 1.5 to ~ 2.5) × 1019 cm-2. Assuming that the emission has a velocity width of ~ 50 km s-1 implies that in the 30′′ VLA data, an 8 kpc filament at the position of the cloud would show at the ~ 1σ level in each channel (cf. the sensitivities listed in Sect. 2.2).
Figure 7 shows that the 90′′ VLA data have detected more H i associated with the filament than the 30′′ data. The additional emission detected in the former data set (compared with the 30′′ maps) has a corresponding H i mass between ~ 3 × 10⁵ M⊙ and ~ 8 × 10⁵ M⊙, depending on how exactly the extent of the 30′′ filament is defined. This is only between 5 and 13 percent of the H i cloud mass detected by the GBT, therefore it is clear that even with the extra spatial smoothing applied here, the VLA does not detect all of the cloud emission.
In an attempt to further constrain the nature of the cloud/filament complex, we observed the cloud with the WSRT in Aug. and Dec. 2013 for a total of 21 h. The telescope was pointed at the center of the GBT cloud. The data were reduced using standard methods, and an image cube was produced using a robustness parameter of 0 and a taper of 30′′. The resulting beam size was 42′′ × 47′′, with a noise level of 0.9 mJy beam-1. This corresponds to a 5σ, 10 km s-1 column density sensitivity of 2.5 × 1019 cm-2.
The WSRT data confirm all features seen in the deep VLA data, but do not detect significant emission at the position of the cloud. The similar limits derived from both the WSRT and the VLA data thus indicate that the cloud H i must have column densities below ~ 1019 cm-2 (when observed at 30′′ and integrated over the velocity width of the cloud) for it not be detected in the deep VLA, or the more shallow but targeted WSRT observations. The combination of this column density limit and the total H i mass of the cloud implies that the true spatial distribution of the H i must be fairly uniform, on scales similar to the extent of the GBT-detected emission, as more clumpy H i distributions with higher local column densities would have been detected in the interferometry data.
4. Interpretation
4.1. Comparison with optical data
We investigated whether any signatures or counterparts of the cloud are visible at other wavelengths. Inspection of GALEX images (Gil de Paz et al. 2007) shows no sign of an overdensity of near-ultraviolet (NUV) or far-ultraviolet (FUV) sources in the area of the cloud, so there is no indication of a concentration of recent star formation at that location.
Barker et al. (2012) examined the resolved stellar population in and around NGC 2403, using wide-field observations with Suprime-Cam on the Subaru telescope. They used color-magnitude diagrams to identify different stellar populations and found that the stellar distribution of NGC 2403 extends to at least ~ 40 kpc, at a surface brightness level of μV ~ 32 mag arcsec-2. The field of view of these observations thus comfortably encompasses the location of the cloud, which is at a radius of ~ 17′ or 16 kpc.
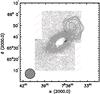 |
Fig. 8 Cloud and filament (contour levels as in Fig. 3) overlaid on the distribution of RGB stars from Barker et al. (2012; gray-scale). The ellipses are spaced 10 kpc in deprojected radius. The absence of stars in the center is due to crowding. The GBT beam is shown in the lower left corner of the panel. The distribution of RGB stars is taken from Fig. 10 of Barker et al. (2012). |
Barker et al. (2012) presented the spatial distribution of the stellar populations in their Fig. 10. Their plot of the distribution of RGB and AGB stars shows diffuse overdensities of stars to the NW and SE of the main disk, with the NW overdensity being most prominent. In Fig. 8 we show the distribution of RGB stars in NGC 2403 from Barker et al. (2012), and overlay the cloud and the filament. The center of the cloud is offset ~ 5′ to the NE from the approximate center of the stellar overdensity, but still has a substantial overlap.
The optical overdensity shows little internal structure and is most likely part of the faint outer stellar disk, possibly tracing the warp as seen in H i (cf. Fig. 3). As noted above, according to Barker et al. (2012), stellar emission can be traced out to well beyond the cloud. The (radially averaged) surface brightness at the radius of the cloud is μV ~ 29 mag arcsec-2.
The location of the cloud near the optical overdensity may thus be a chance superposition, and the cloud/filament complex is possibly the equivalent of a large high-velocity cloud (HVC). The H i mass of the complex is similar to that of the Complex C HVC in our Galaxy. This raises the question of whether the cloud/filament complex might be caused by galactic fountain processes, that is, could it be gas blown out of the main disk due to star formation and forming a HVC? As discussed above, Fraternali et al. (2001, 2002) reported a thick, lagging H i disk in NGC 2403. Fraternali & Binney (2006, 2008) modeled this extra-planar gas component using particles that are blown out of the disk on ballistic orbits. Fraternali & Binney (2008) concluded that the general distribution of the gas can indeed be modeled in this way, but that smaller substructures and large filaments (such as the 8 kpc filament) are not easily produced in the fountain model. With the addition of the GBT data, the 8 kpc filament is now twice as massive and extends much farther out than originally assumed, making it less likely to be purely the result of the galactic fountain process.
4.2. Comparison with NGC 891: a fly-by scenario
We already noted that another galaxy in which extraplanar gas has been observed and extensively studied is NGC 891. Mapelli et al. (2008) focus on the origin of the lopsided disk in NGC 891 and offer an interesting alternative explanation for some of the extra-planar gas observed in that galaxy. They reported that the main extra-planar filament in NGC 891 points at nearby LSB galaxy UGC 1807 (as first pointed out in Oosterloo et al. 2007; cf. their Fig. 8), and showed with simulations that a fly-by interaction with an intruder dwarf galaxy can create this filament. Note, incidentally, that these types of fly-bys are also a common phenomenon in cosmological cold dark matter simulations (Sinha & Holley-Bockelmann 2012).
For the specific case of NGC 891, Mapelli et al. (2008) found the best match with an interaction that occurred 300 Myr ago, at a fly-by velocity of 260 km s-1. They showed that the filament must consist mostly of gas stripped off the UGC 1807 intruder.
The simulations of Mapelli et al. (2008) indicate that there is gas between the two galaxies. Deep GBT H i observations of the area around NGC 891 not detect any connection between NGC 891 and UGC 1807 (D.J. Pisano, priv. com.), however, implying that if the fly-by hypothesis holds, this gas must be of very low column density and/or ionized, and only close to the NGC 891 disk dense enough to be detected.
Could the cloud-complex in NGC 2403 be caused by a similar fly-by of a neigboring galaxy? If we extend the major axis of the VLA 8 kpc filament3 (using a major-axis position angle of −17°; cf. Fig. 4), it passes close to the dwarf spheroidal galaxy DDO 44 (at about 1.5° or ~ 85 kpc from NGC 2403) and the late-type dwarf galaxy NGC 2366 (at ~ 3.5° or ~ 190 kpc). The velocities of the H i in NGC 2366 completely overlap with those of the H i in NGC 2403. In NGC 2403, H i is found from ~ −5 to ~ 270 km s-1. In NGC 2366, this ranges from ~ 40 to ~ 170 km s-1 (Walter et al. 2008). DDO 44 has a single radial velocity determination that places it at 213 km s-1 (Karachentsev et al. 2011), which is inside the range of velocities found in NGC 2403. See Fig. 9 for an overview.
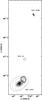 |
Fig. 9 Field around NGC 2403. Contours and gray-scales of NGC 2403 (bottom of the plot) are the same as in Fig. 3. The circle indicates the position and approximate size of DDO 44. In the top of the panel we show the H i distribution of NGC 2366 from THINGS (Walter et al. 2008). All distances and sizes are to scale. |
Arbitrarily assuming the same fly-by velocity of 260 km s-1 as given in Mapelli et al. (2008) (and assuming that this velocity is in the plane of the sky, ignoring any radial velocities), we find the timescale for an interaction with DDO 44 to be ~ 300 Myr. For NGC 2366 we find ~ 750 Myr. The DDO 44 timescale is similar to what Mapelli et al. (2008) found for NGC 891.
Given the orbital time of NGC 2403, which is ~ 700 Myr at the approximate position of the cloud, it is unclear which part of the stellar disk would have been affected most. However, the effects of the interaction on anything other than the local gas distribution must have been minor. In a study of the star formation histories at various locations in the NGC 2403 disk, Williams et al. (2013) found no evidence for any major temporal variations in the star formation rate. The locations studied were all on the receding side of the galaxy (i.e., the side of the galaxy opposite to that of the cloud). Given the regularity and the symmetry of the stellar disk of NGC 2403, there is no reason to assume that the star formation history of the approaching side of the galaxy is dramatically different, however. Williams et al. (2013) suggested that because NGC 2403 is so undisturbed, it is unlikely to have had major interactions in the past.
Do any of the two potential intruder galaxies show any signs of interactions or disturbance? NGC 2366 is a gas-rich dwarf-galaxy that is known to have a disturbed H i velocity field and an outer gas component that does not follow regular rotation (de Blok et al. 2008; Oh et al. 2008). It is undergoing a star-burst and shows evidence of major gas outflows (van Eymeren et al. 2009). McQuinn et al. (2010) find from modeling the stellar population, that the star formation burst started and peaked ~ 450 Myr ago.
The second, closer, galaxy DDO 44 is a dwarf-spheroidal galaxy. In a search for Hα clumps in the M 81 group, Karachentsev et al. (2011) detected an H ii region in this dSph galaxy that contains a number of blue, late-type B-stars. Karachentsev et al. (2011) noted that despite the absence of early-type B- or O-stars, the FUV luminosity of ~ 1 × 1036 erg s-1 of the detected stars is sufficient to ionize the H ii region. These stars are also seen in GALEX data. The implied star formation rate (SFR) is ~ 10-5 M⊙ yr-1. Despite this low SFR value, it is surprising to find recent star formation in such a gas-poor system. No H i has so far been detected in DDO 44, and we found no evidence in our deep GBT cube either (which also covers the position of DDO 44). Assuming, like Karachentsev et al. (2011), that the velocity width of DDO 44 is W ≤ 30 km s-1, sets the 5σ H i mass upper limit derived from our GBT data at MHI ~ 8 × 10⁴ M⊙.
Karachentsev et al. (2011) speculated that the star formation is caused by accretion of gas from the intergalactic medium. If the fly-by scenario is valid, this might therefore be star formation due to gas dragged out of the immediate environment of NGC 2403. The life-time of a late-type B-star (a few hundred Myr) is consistent with the timescale for the fly-by derived above.
We examined the GBT data cube for evidence of an H i connection between NGC 2403 and DDO 44, but found no emission beyond what was already detected in the filament, although one may expect that gas to be of such low column density that it is ionized. In fact, we found no evidence throughout the entire GBT cube for emission not associated with NGC 2403 or our Milky Way at the 3σ level (3.9 × 1017 cm-1 per 5.2 km s-1 channel). Nevertheless, the simulations presented in Mapelli et al. (2008) suggest that in the fly-by scenario, the intruder and the target galaxy are connected by a stream of gas. Given the absence of this stream in emission in the GBT data, it will be interesting to investigate whether signs of it can be detected in absorption. Alternatively, careful stacking of spectra in the assumed area of the putative stream could yield a result, although the unknown velocities of the stream (needed to shift the spectra to a common velocity prior to stacking) could hamper this excercise.
4.3. Accretion
Alternatively, the cloud could be a sign of accretion happening. This could be accretion (or rather infall) of a dwarf galaxy, or bona-fide accretion from the IGM or cosmic web.
To start with the first possibility, the cloud and filament complex could represent the tail left behind by a dwarf galaxy as it plunged into NGC 2403 and was stripped. Unfortunately, because we see the tail projected against the bright stellar disk of NGC 2403, it will be difficult to directly detect the stellar population belonging to the dwarf galaxy. A careful study of the resolved stellar population in the region where the 8 kpc filament connects with the main disk is probably the only way to directly detect this stellar population, if present.
The second possibility is accretion of gas directly from the IGM. Simulations show that a fraction of gas falling from the cosmic web into a galaxy halo potential is not heated to the virial temperature of the halo (Kereš et al. 2005). These filaments of cooler gas can penetrate from the IGM through the hot gas in the halo of a galaxy and directly deliver gas to the disk. This process is commonly known as cold accretion. However, the gas involved still has a temperature of ~ 105 K, and is therefore not directly comparable with the cold gas we observe in the H i line. The cold accretion process appears to be most efficient at high redshifts (z> 2). At low redshifts it seems (according to the simulations) to mainly occur in low-mass galaxies with Mhalo ≲ 5 × 10¹¹ M⊙ (Joung et al. 2012), potentially including NGC 2403. As noted, the “cold” accreting gas would have temperatures too high to be observed in the H i line. However, further simulations (Joung et al. 2012) showed that in the innermost regions of the halo (R ≲ 100 kpc) some of the gas can cool further and form H i clouds. For a Milky-Way-type galaxy, simulations showed that at z = 0 the amount of cold gas present in the halo is ~ 108 M⊙ (Fernández et al. 2012). This is an order of magnitude higher than the H i mass of the NGC 2403 complex, but the final stages of accretion are complex and difficult to model, and it is not clear whether this difference is significant. See also Nelson et al. (2013) for a comparison of simulations made with the smoothed particle hydrodynamics and with the moving-mesh techniques. In the latter the amount of cold gas and corresponding cold accretion rates are much lower.
Qualitatively, the density distribution of the filament can be consistent with an accretion scenario. The VLA observations show a dense filament close to the disk, with the GBT data showing it with a lower density farther out. However, whereas the current observations are consistent with the infall of an accreting cloud, they do not conclusively prove that accretion from the IGM does indeed occur.
5. Conclusions
Deep H i observations obtained with the GBT show a 6.3 × 10⁶ M⊙ cloud near NGC 2403. A comparison with deep VLA observations by Fraternali et al. (2001, 2002) suggests that this cloud is part of a larger complex that also includes the ~ 1 × 10⁷ M⊙ 8 kpc anomalous-velocity H i filament in the inner disk of NGC 2403.
Deep optical observations by Barker et al. (2012) showed a stellar overdensity near the position of the cloud. It is not clear, however, whether the overdensity and the cloud are associated. We suggest that the cloud/filament complex could be a direct observation of accretion, or that we could be seeing the after-effects of a minor interaction (fly-by) with a neigboring galaxy.
If we witness accretion happening, assuming NGC 2403 is not a unique galaxy, future observations of other galaxies to similar column densities should reveal more of these events. If these are not detected in significant numbers, this would be a strong indication that features as now seen in NGC 2403 are interaction events. It would imply that significant accretion from the cosmic web that is observable in emission does not occur or is at least rare at low redshifts. Future, deeper observations with instruments such as the SKA, or its precursors, are required to be able to routinely probe the environment around galaxies and quantify the importance of accretion from and the relation with the cosmic web.
The National Radio Astronomy Observatory (NRAO) is a facility of the National Science Foundation operated under cooperative agreement by Associated Universities, Inc.
We do not include the GBT cloud as its morphology is too uncertain.
Acknowledgments
We thank the anonymous referee for constructive comments. We thank the staff at the GBT for their assistance with the observations. W.J.G.d.B. was supported by the European Commission (grant FP7-PEOPLE-2012-CIG #333939). The work of D.J.P. was partially supported by NSF CAREER grant AST-1149491. FF acknowledges financial support from PRIN MIUR 2010-2011, prot. 2010LY5N2T.
References
- Barker, M. K., Ferguson, A. M. N., Irwin, M. J., Arimoto, N., & Jablonka, P. 2012, MNRAS, 419, 1489 [NASA ADS] [CrossRef] [Google Scholar]
- Begeman, K. G. 1987, Ph.D. Thesis, University of Groningen [Google Scholar]
- Chynoweth, K. M., Langston, G. I., Holley-Bockelmann, K., & Lockman, F. J. 2009, AJ, 138, 287 [NASA ADS] [CrossRef] [Google Scholar]
- de Blok, W. J. G., Walter, F., Brinks, E., et al. 2008, AJ, 136, 2648 [NASA ADS] [CrossRef] [Google Scholar]
- Fernández, X., Joung, M. R., & Putman, M. E. 2012, ApJ, 749, 181 [NASA ADS] [CrossRef] [Google Scholar]
- Fraternali, F. 2013, IAU Symp. 298 [arXiv:1310.2956] [Google Scholar]
- Fraternali, F., & Binney, J. J. 2006, MNRAS, 366, 449 [NASA ADS] [CrossRef] [Google Scholar]
- Fraternali, F., & Binney, J. J. 2008, MNRAS, 386, 935 [NASA ADS] [CrossRef] [Google Scholar]
- Fraternali, F., Oosterloo, T., Sancisi, R., & van Moorsel, G. 2001, ApJ, 562, L47 [NASA ADS] [CrossRef] [Google Scholar]
- Fraternali, F., van Moorsel, G., Sancisi, R., & Oosterloo, T. 2002, AJ, 123, 3124 [NASA ADS] [CrossRef] [Google Scholar]
- Gentile, G., Józsa, G. I. G., Serra, P., et al. 2013, A&A, 554, A125 [NASA ADS] [CrossRef] [EDP Sciences] [Google Scholar]
- Gil de Paz, A., Boissier, S., Madore, B. F., et al. 2007, ApJS, 173, 185 [NASA ADS] [CrossRef] [Google Scholar]
- Heald, G., Józsa, G., Serra, P., et al. 2011, A&A, 526, A118 [NASA ADS] [CrossRef] [EDP Sciences] [Google Scholar]
- Joung, M. R., Putman, M. E., Bryan, G. L., Fernández, X., & Peek, J. E. G. 2012, ApJ, 759, 137 [NASA ADS] [CrossRef] [Google Scholar]
- Kamphuis, P., Rand, R. J., Józsa, G. I. G., et al. 2013, MNRAS, 434, 2069 [NASA ADS] [CrossRef] [Google Scholar]
- Karachentsev, I., Kaisina, E., Kaisin, S., & Makarova, L. 2011, MNRAS, 415, L31 [NASA ADS] [CrossRef] [Google Scholar]
- Kereš, D., Katz, N., Weinberg, D. H., & Davé, R. 2005, MNRAS, 363, 2 [NASA ADS] [CrossRef] [Google Scholar]
- Langston, G., & Turner, B. 2007, ApJ, 658, 455 [NASA ADS] [CrossRef] [Google Scholar]
- Mapelli, M., Moore, B., & Bland-Hawthorn, J. 2008, MNRAS, 388, 697 [NASA ADS] [CrossRef] [Google Scholar]
- McQuinn, K. B. W., Skillman, E. D., Cannon, J. M., et al. 2010, ApJ, 721, 297 [NASA ADS] [CrossRef] [Google Scholar]
- Nelson, D., Vogelsberger, M., Genel, S., et al. 2013, MNRAS, 429, 3353 [NASA ADS] [CrossRef] [Google Scholar]
- Oh, S.-H., de Blok, W. J. G., Walter, F., Brinks, E., & Kennicutt, R. C., Jr. 2008, AJ, 136, 2761 [NASA ADS] [CrossRef] [Google Scholar]
- Oosterloo, T., Fraternali, F., & Sancisi, R. 2007, AJ, 134, 1019 [NASA ADS] [CrossRef] [Google Scholar]
- Pisano, D. J. 2014, AJ, 147, 48 [NASA ADS] [CrossRef] [Google Scholar]
- Putman, M. E., Peek, J. E. G., & Joung, M. R. 2012, ARA&A, 50, 491 [NASA ADS] [CrossRef] [Google Scholar]
- Richter, O.-G., & Sancisi, R. 1994, A&A, 290, L9 [NASA ADS] [Google Scholar]
- Rots, A. H. 1980, A&AS, 41, 189 [NASA ADS] [Google Scholar]
- Sancisi, R., Fraternali, F., Oosterloo, T., & van der Hulst, T. 2008, A&ARv, 15, 189 [NASA ADS] [CrossRef] [EDP Sciences] [Google Scholar]
- Shapiro, P. R., & Field, G. B. 1976, ApJ, 205, 762 [NASA ADS] [CrossRef] [Google Scholar]
- Sicking, F. J. 1997, Ph.D. Thesis, University of Groningen [Google Scholar]
- Sinha, M., & Holley-Bockelmann, K. 2012, ApJ, 751, 17 [NASA ADS] [CrossRef] [Google Scholar]
- Swaters, R. A., Sancisi, R., & van der Hulst, J. M. 1997, ApJ, 491, 140 [NASA ADS] [CrossRef] [Google Scholar]
- Trachternach, C., de Blok, W. J. G., Walter, F., Brinks, E., & Kennicutt, R. C., Jr. 2008, AJ, 136, 2720 [NASA ADS] [CrossRef] [Google Scholar]
- van Eymeren, J., Marcelin, M., Koribalski, B., et al. 2009, A&A, 493, 511 [NASA ADS] [CrossRef] [EDP Sciences] [Google Scholar]
- Walter, F., Brinks, E., de Blok, W. J. G., et al. 2008, AJ, 136, 2563 [NASA ADS] [CrossRef] [Google Scholar]
- Williams, B. F., Dalcanton, J. J., Stilp, A., et al. 2013, ApJ, 765, 120 [NASA ADS] [CrossRef] [Google Scholar]
- Zschaechner, L. K., Rand, R. J., Heald, G. H., Gentile, G., & Kamphuis, P. 2011, ApJ, 740, 35 [NASA ADS] [CrossRef] [Google Scholar]
- Zschaechner, L. K., Rand, R. J., Heald, G. H., Gentile, G., & Józsa, G. 2012, ApJ, 760, 37 [NASA ADS] [CrossRef] [Google Scholar]
All Figures
|
Fig. 1 Global H i profile of NGC 2403 derived from the GBT data. The dotted line indicates vhel = 10 km s-1. Below this velocity, Galactic emission affects the data and emission from NGC 2403 could not be unambiguously identified. |
| In the text | |
|
Fig. 2 Selected channel maps of the GBT data cube. Contour levels are −2σ (gray dashed contours) and (2,4,8,16,32,64,128,256,512,1024)σ (full contours) where σ = 6 mJy beam-1. This corresponds within a single channel to a column density of 1.25 × 1017 cm-2. Heliocentric velocities of the channels in km s-1 are shown in the top-right of each channel. From 150.5 to 104.1 km s-1 every channel is shown. Outside this range only every third channel is shown. The GBT beam is shown in the bottom-left corner of the top-left panel. Channels in the bottom row are marginally affected by Galactic emission. In the 140.2 km s-1 panel the arrow indicates cloud emission. |
| In the text | |
|
Fig. 3 H i moment maps of NGC 2403. Top-left: integrated H i map derived from the GBT data. Thick dark-gray contours show the H i distribution of the entire galaxy. Contour levels are 5 × 10¹⁷, 5 × 10¹⁸, 5 × 10¹⁹, and 5 × 1020 cm-2. The gray-scale runs from 5 × 10¹⁷ (white) to 1.5 × 1021 cm-2 (black). Thin, black contours show the H i distribution of the cloud. Contour levels are (6.25, 12.5, 25, 62.5) × 1017 cm-2. White contours indicate the location of the 8 kpc filament. The GBT beam is shown in the bottom-left corner. Top-right: integrated H i map derived from the 30′′ VLA data from Fraternali et al. (2002). The gray-scale runs from 2 × 10¹⁹ (white) to 2 × 1021 cm-2 (black). Contours are as in the top-left panel. The VLA beam is indicated in the bottom-right corner. Bottom-left: intensity-weighted mean velocity field derived from the GBT data. The thick black contour indicates v = 130 km s-1. White contours decrease with respect to this value in steps of 20 km s-1. Black contours increase in steps of 20 km s-1. Bottom-right: intensity-weighted mean velocity field derived from the 30′′ VLA data. Contours are as in the bottom-left panel. |
| In the text | |
|
Fig. 4 View of the cloud-filament complex. The gray-scales show the integrated H i distribution derived from the 30′′ VLA data and run from 2 × 10¹⁹ (white) to 2 × 1021 cm-2 (black). Thin, black contours show the H i distribution of the cloud derived from the GBT data. Contour levels are (6.25, 12.5, 25, 62.5) × 1017 cm-2. White contours show the 8 kpc filament, derived from the 30′′ VLA data. The contour level is 2 × 1019 cm-2. The highest column density found in the filament is 6.5 × 1019 cm-2. The GBT and 30′′ VLA beams are indicated in the bottom-left corner. The thick gray line shows the location of the position-velocity slice shown in Fig. 6. The long-dashed circle indicates the 50 percent sensitivity level of the VLA primary beam. The short-dashed circle shows the 10 percent level. |
| In the text | |
|
Fig. 5 Selected channel maps of the GBT data cube superimposed on corresponding channel maps from the deep VLA data. The GBT data are shown in black contours. Black contours levels are (2.5,5 [ thick contour ] ,10,50) × 1017 cm-2. Gray, dashed contours denote −2.5 × 1017 cm-2 in the GBT data. The gray-scale shows the H i emission in the deep 30′′ cube from Fraternali et al. (2002). The thin, red contour surronding this emission shows the 5 × 1018 cm-2 in these VLA data. The thick, red, dashed contours show the 5 × 1017 cm-2 level in the VLA data when smoothed to the GBT resolution of 8.7′. This is the same column density as shown by the thick black contour. None of the VLA contours or gray-scales are corrected for primary-beam effects. The panel in the bottom-right is affected by Galactic emission. The GBT beam is shown in the bottom-left corner of the top-left panel. The two small features to the north of the main emission, as indicated by the thick red contour at v = 258.7 and 243.3 kms s-1 are data artifacts caused by the severe smoothing. |
| In the text | |
|
Fig. 6 Comparison of GBT and 30′′ VLA data. Top panel: pV slice through centers of the cloud and 8 kpc filament. Position and orientation of the slice is indicated in Fig. 4. The thickness of the slice through the VLA data is 100′′; the thickness of the slice through the GBT data is one GBT beam. The gray-scale shows the VLA data with (2.5,5) × 1018 cm-2 contours overplotted in dark-gray. The black contours show the GBT data at (5,10,25,50,100)σ, where σ corresponds to 3 × 1017 cm-2. The cloud is detected at the > 10σ level. The thick, red contour shows the VLA data smoothed to the GBT resolution at the 5 × 1017 cm-2 level. The emission detected by the GBT is clearly more extended. The VLA contours and gray-scales are not corrected for primary beam effects. The hatched area at the top indicates velocities affected by Galactic emission. The cloud and 8 kpc filament are indicated by arrows. The two horizontal lines indicate the velocities of the channel maps shown in the bottom panels. Bottom panels: channel maps at v = 135.1 km s-1 (left) and v = 124.8 km s-1 (right). In both panels the gray-scale shows the VLA data at 60′′. Thin dark-gray contours show VLA column density levels at (1,5) × 1018 cm-2. Thin white contours show VLA column density levels at (25,50,250) × 1018 cm-2. The lowest contour of 1 × 1018 cm-2 corresponds to ~ 2.5σ. Features in the extreme top-right and bottom-left of the channel maps are deconvolution artifacts. The thick black contours show GBT column density levels and are the same as in Fig. 5. The GBT beam and the 60′′ VLA beam are shown in the bottom-left corner of the left channel map. |
| In the text | |
|
Fig. 7 Integrated H i map of the emission between 119.6 and 150.4 km s-1 derived from the deep VLA data at 90′′ resolution (gray-scale). Light-gray contours show (5, 10, 20, 50, 100, 200) × 1018 cm-2 column density levels. The noise in the map corresponds to 2 × 1018 cm-2 and the lowest VLA contour corresponds to ~ 2.5σ. Thin black contours show the GBT cloud, thick white contours the 8-kpc filament at 30′′ resolution. Contours as in Fig. 4. The 90′′ VLA beam is indicated in the bottom-right corner, the GBT beam in the bottom-left corner. |
| In the text | |
|
Fig. 8 Cloud and filament (contour levels as in Fig. 3) overlaid on the distribution of RGB stars from Barker et al. (2012; gray-scale). The ellipses are spaced 10 kpc in deprojected radius. The absence of stars in the center is due to crowding. The GBT beam is shown in the lower left corner of the panel. The distribution of RGB stars is taken from Fig. 10 of Barker et al. (2012). |
| In the text | |
|
Fig. 9 Field around NGC 2403. Contours and gray-scales of NGC 2403 (bottom of the plot) are the same as in Fig. 3. The circle indicates the position and approximate size of DDO 44. In the top of the panel we show the H i distribution of NGC 2366 from THINGS (Walter et al. 2008). All distances and sizes are to scale. |
| In the text | |
Current usage metrics show cumulative count of Article Views (full-text article views including HTML views, PDF and ePub downloads, according to the available data) and Abstracts Views on Vision4Press platform.
Data correspond to usage on the plateform after 2015. The current usage metrics is available 48-96 hours after online publication and is updated daily on week days.
Initial download of the metrics may take a while.