Fig. 4
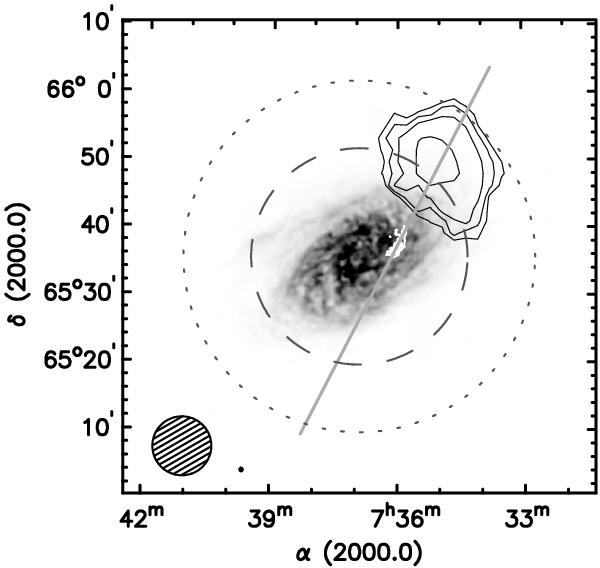
View of the cloud-filament complex. The gray-scales show the integrated H i distribution derived from the 30′′ VLA data and run from 2 × 10¹⁹ (white) to 2 × 1021 cm-2 (black). Thin, black contours show the H i distribution of the cloud derived from the GBT data. Contour levels are (6.25, 12.5, 25, 62.5) × 1017 cm-2. White contours show the 8 kpc filament, derived from the 30′′ VLA data. The contour level is 2 × 1019 cm-2. The highest column density found in the filament is 6.5 × 1019 cm-2. The GBT and 30′′ VLA beams are indicated in the bottom-left corner. The thick gray line shows the location of the position-velocity slice shown in Fig. 6. The long-dashed circle indicates the 50 percent sensitivity level of the VLA primary beam. The short-dashed circle shows the 10 percent level.
Current usage metrics show cumulative count of Article Views (full-text article views including HTML views, PDF and ePub downloads, according to the available data) and Abstracts Views on Vision4Press platform.
Data correspond to usage on the plateform after 2015. The current usage metrics is available 48-96 hours after online publication and is updated daily on week days.
Initial download of the metrics may take a while.