Fig. 7
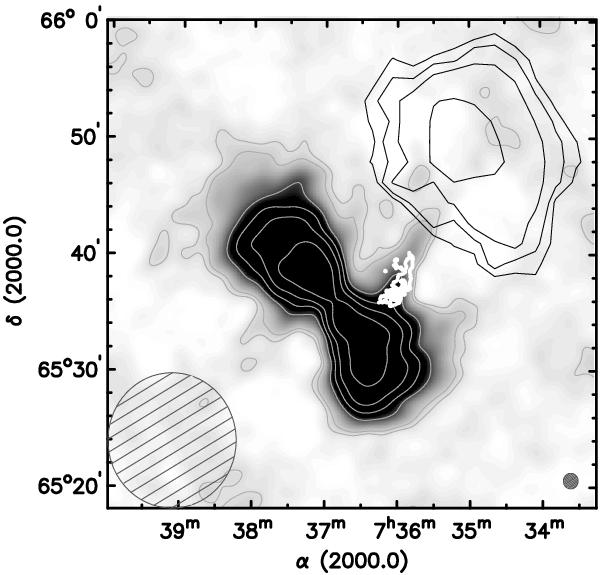
Integrated H i map of the emission between 119.6 and 150.4 km s-1 derived from the deep VLA data at 90′′ resolution (gray-scale). Light-gray contours show (5, 10, 20, 50, 100, 200) × 1018 cm-2 column density levels. The noise in the map corresponds to 2 × 1018 cm-2 and the lowest VLA contour corresponds to ~ 2.5σ. Thin black contours show the GBT cloud, thick white contours the 8-kpc filament at 30′′ resolution. Contours as in Fig. 4. The 90′′ VLA beam is indicated in the bottom-right corner, the GBT beam in the bottom-left corner.
Current usage metrics show cumulative count of Article Views (full-text article views including HTML views, PDF and ePub downloads, according to the available data) and Abstracts Views on Vision4Press platform.
Data correspond to usage on the plateform after 2015. The current usage metrics is available 48-96 hours after online publication and is updated daily on week days.
Initial download of the metrics may take a while.