Fig. 5
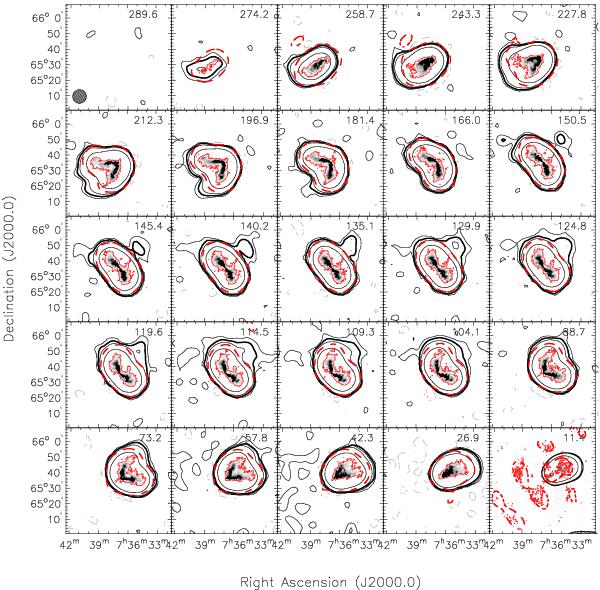
Selected channel maps of the GBT data cube superimposed on corresponding channel maps from the deep VLA data. The GBT data are shown in black contours. Black contours levels are (2.5,5 [ thick contour ] ,10,50) × 1017 cm-2. Gray, dashed contours denote −2.5 × 1017 cm-2 in the GBT data. The gray-scale shows the H i emission in the deep 30′′ cube from Fraternali et al. (2002). The thin, red contour surronding this emission shows the 5 × 1018 cm-2 in these VLA data. The thick, red, dashed contours show the 5 × 1017 cm-2 level in the VLA data when smoothed to the GBT resolution of 8.7′. This is the same column density as shown by the thick black contour. None of the VLA contours or gray-scales are corrected for primary-beam effects. The panel in the bottom-right is affected by Galactic emission. The GBT beam is shown in the bottom-left corner of the top-left panel. The two small features to the north of the main emission, as indicated by the thick red contour at v = 258.7 and 243.3 kms s-1 are data artifacts caused by the severe smoothing.
Current usage metrics show cumulative count of Article Views (full-text article views including HTML views, PDF and ePub downloads, according to the available data) and Abstracts Views on Vision4Press platform.
Data correspond to usage on the plateform after 2015. The current usage metrics is available 48-96 hours after online publication and is updated daily on week days.
Initial download of the metrics may take a while.