Fig. 2
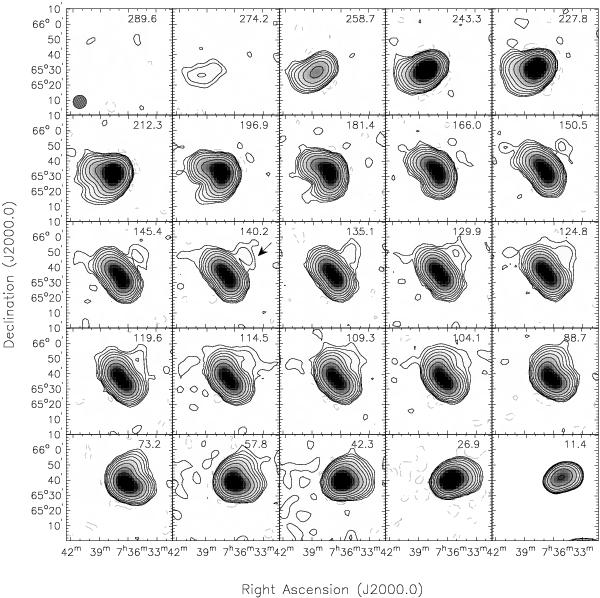
Selected channel maps of the GBT data cube. Contour levels are −2σ (gray dashed contours) and (2,4,8,16,32,64,128,256,512,1024)σ (full contours) where σ = 6 mJy beam-1. This corresponds within a single channel to a column density of 1.25 × 1017 cm-2. Heliocentric velocities of the channels in km s-1 are shown in the top-right of each channel. From 150.5 to 104.1 km s-1 every channel is shown. Outside this range only every third channel is shown. The GBT beam is shown in the bottom-left corner of the top-left panel. Channels in the bottom row are marginally affected by Galactic emission. In the 140.2 km s-1 panel the arrow indicates cloud emission.
Current usage metrics show cumulative count of Article Views (full-text article views including HTML views, PDF and ePub downloads, according to the available data) and Abstracts Views on Vision4Press platform.
Data correspond to usage on the plateform after 2015. The current usage metrics is available 48-96 hours after online publication and is updated daily on week days.
Initial download of the metrics may take a while.