Fig. 3
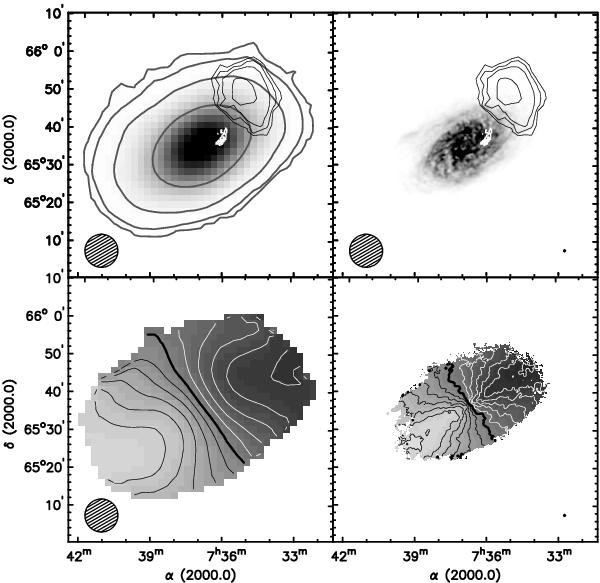
H i moment maps of NGC 2403. Top-left: integrated H i map derived from the GBT data. Thick dark-gray contours show the H i distribution of the entire galaxy. Contour levels are 5 × 10¹⁷, 5 × 10¹⁸, 5 × 10¹⁹, and 5 × 1020 cm-2. The gray-scale runs from 5 × 10¹⁷ (white) to 1.5 × 1021 cm-2 (black). Thin, black contours show the H i distribution of the cloud. Contour levels are (6.25, 12.5, 25, 62.5) × 1017 cm-2. White contours indicate the location of the 8 kpc filament. The GBT beam is shown in the bottom-left corner. Top-right: integrated H i map derived from the 30′′ VLA data from Fraternali et al. (2002). The gray-scale runs from 2 × 10¹⁹ (white) to 2 × 1021 cm-2 (black). Contours are as in the top-left panel. The VLA beam is indicated in the bottom-right corner. Bottom-left: intensity-weighted mean velocity field derived from the GBT data. The thick black contour indicates v = 130 km s-1. White contours decrease with respect to this value in steps of 20 km s-1. Black contours increase in steps of 20 km s-1. Bottom-right: intensity-weighted mean velocity field derived from the 30′′ VLA data. Contours are as in the bottom-left panel.
Current usage metrics show cumulative count of Article Views (full-text article views including HTML views, PDF and ePub downloads, according to the available data) and Abstracts Views on Vision4Press platform.
Data correspond to usage on the plateform after 2015. The current usage metrics is available 48-96 hours after online publication and is updated daily on week days.
Initial download of the metrics may take a while.