| Issue |
A&A
Volume 569, September 2014
|
|
|---|---|---|
| Article Number | A53 | |
| Number of page(s) | 9 | |
| Section | Interstellar and circumstellar matter | |
| DOI | https://doi.org/10.1051/0004-6361/201423821 | |
| Published online | 23 September 2014 | |
The origin of organic emission in NGC 2071⋆
1
Leiden Observatory, Leiden University,
Niels Bohrweg 2,
2333 CA
Leiden,
The Netherlands
e-mail:
This email address is being protected from spambots. You need JavaScript enabled to view it.
2
Department of Physics and Astronomy, University of
Waterloo, Waterloo,
Ontario, N2L 3G1, Canada
3
Joint Astronomy Center, 660 North A’ohoku Place, University
Park, Hilo,
HI
96720,
USA
4
National Research Council Canada, Herzberg Institute of
Astrophysics, 5071 West Saanich
Rd, Victoria,
BC, V9E 2E7, Canada
5
Department of Physics & Astronomy, University of
Victoria, Victoria,
BC, V8P 1A1, Canada
Received: 17 March 2014
Accepted: 8 July 2014
Abstract
Context. The physical origin behind organic emission lines in embedded low-mass star formation has been fiercely debated over the last two decades. A multitude of scenarios have been proposed, from a hot corino to PDRs on cavity walls to shock excitation.
Aims. The aim of this paper is to determine the location and the corresponding physical conditions of the gas responsible for organics emission lines. The outflows around the small protocluster NGC 2071 are an ideal testbed that can be used to differentiate between various scenarios.
Methods. Using Herschel-HIFI and the Submillimeter Array, observations of CH3OH, H2CO, and CH3CN emission lines over a wide range of excitation energies were obtained. Comparisons to a grid of radiative transfer models provide constraints on the physical conditions. Comparison to H2O line shape is able to trace gas-phase synthesis versus a sputtered origin.
Results. Emission of organics originates in three separate spots: the continuum sources IRS 1 (“B”) and IRS 3 (“A”) and a new outflow position (“F”). Densities are above 107 cm-3 and temperatures between 100 K and 200 K. CH3OH emission observed with HIFI originates in all three regions and cannot be associated with a single region. Very little organic emission originates outside of these regions.
Conclusions. Although the three regions are small (<1500 AU), gas-phase organics likely originate from sputtering of ices as a result of outflow activity. The derived high densities (>107 cm-3) are likely a requirement for organic molecules to survive from being immediately destroyed by shock products after evaporation. The lack of spatially extended emission confirms that organic molecules cannot (re-)form through gas-phase synthesis, as opposed to H2O, which shows strong line wing emission. The lack of CH3CN emission at “F” is evidence for a different history of ice processing because of the absence of a protostar at that location and recent ice mantle evaporation.
Key words: stars: formation / submillimeter: ISM / stars: protostars / circumstellar matter
This paper uses Herschel observations. Herschel is an ESA space observatory with science instruments provided by European-led Principal Investigator consortia and with important participation from NASA. This paper also makes use of SMA observations. The Submillimeter Array is a joint project between the Smithsonian Astrophysical Observatory and the Academia Sinica Institute of A&A and is funded by the Smithsonian Institution and the Academia Sinica.
© ESO, 2014
1. Introduction
Strong emission lines of hydrogenated carbon-bearing species are a common feature associated with the early stages of star formation. Embedded high-mass protostars possess a so-called hot core component (Kurtz et al. 2000), from which large quantities of emission lines from organic molecules have been detected (e.g., Comito et al. 2005). This spherically symmetric region around the massive protostar is powered solely by luminosities from the newly ignited protostar and its accretion flow.
Similar emission features of organic compounds have been detected around low-mass protostars (van Dishoeck et al. 1995; Cazaux et al. 2003; Bottinelli et al. 2004a; Bisschop et al. 2008; Caux et al. 2011), including simple sugars (Jørgensen et al. 2012). Even though most emission lines of the organics clearly originate in the inner few hundred AU, their physical origin is fiercely debated. In one scenario, emission originates in a spherically symmetric component around the protostar similar to the hot core, referred to as the “hot corino” (Ceccarelli et al. 2007). In some sources the molecular emission does not coincide with the positions where the continuum peaks and the protostar is believed to be located (e.g., Chandler et al. 2005). Observed line shapes, in particular the line wings, do not support a spherical model. Furthermore, SED and envelope modeling of low-mass protostars show that although central warm regions are possible (Shirley et al. 2002), typical sizes and column densities of the protostellar envelope are much larger and higher than predicted. Other sources of energy are required to explain the observations.
Abundances of molecules such as methanol and formaldehyde (CH3OH and H2CO) are factors of ~30−100 higher in protostellar environments than in dark clouds (Takakuwa et al. 1998), where non-thermal desorption dominates (Öberg et al. 2009). From examination of the physical and chemical conditions, release of icy grain mantles must play a crucial role (van der Tak et al. 2000; Maret et al. 2005). It is poorly understood in which situations thermal desorption of water (H2O) (Sandford & Allamandola 1993) is dominant, when grain-grain collisions that shatter ice mantles (Jones et al. 1996) are required, or when sputtering by energetic particles produced in shocks play a large role (Flower & Pineau Des Forêts 2010). Whatever the method, CH3OH is a pure grain mantle product.
Bottinelli et al. (2004b) and Bisschop et al. (2008) showed the importance of resolved interferometric observations of organic emission. By resolving components and their conditions, differences in the formation of organics can be uncovered. Abundances of some species cannot be produced by grain surface hydrogenation alone. A combination of grain surface reactions and gas phase formation and/or destruction is often required.
Shock desorption has been invoked to account for observed offsets of organic emission when visibly associated with outflowing material (e.g., Buckle & Fuller 2002). Shocks and their associated cavities also allow for additional energy injections not possible in spherical models. Warm gas on the surface of outflow cavity walls has been invoked to explain observed CO J = 6–5 emission (Spaans et al. 1995; van Kempen et al. 2009). There is no reason why this cannot be a physical driver for emission of organics, following the relatively high gas temperature of this component (Visser et al. 2012). An important constraint to the conditions is the amount of CH3OH destroyed, either through dissociative desorption during the sputtering or reactions with H in the shock. Recently, Suutarinen et al. (2014) found that comparison of CH3OH with H2O can probe the conditions of irradiated shocks.
Most likely, the various origins coexist. This is best shown by the ongoing work in intermediate mass protocluster OMC 2 FIRS 4 (Kama et al. 2010, 2013; López-Sepulcre et al. 2013). The small scales show more than four components, while the observed methanol emission cannot be tied to one component, even though >100 lines have been detected. Multiple components and origins are required.
The tightly packed proto-cluster NGC 2071, located at 422 pc (Carrasco-González et al. 2012; van Kempen et al. 2012) produces one of the most powerful outflows within 500 pc (Scoville et al. 1986; Butner et al. 1990). In combination with the relatively low stellar masses of all three protostars and a cleaner environment, it is a better candidate with which to differentiate between outflow driven scenarios and hot-core like origins or quantify the relative contributions of both. It is rich in molecular emission (Johnstone et al. 2003), at times showing two Gaussian components of different widths.
In this paper, we present new results using observations of emission lines of three organic compounds: methanol (CH3OH), formaldehyde (H2CO), and methyl cyanide (CH3CN). These three organic compounds are commonly used as tracers for chemical activity in nearby star forming regions (e.g., Jørgensen et al. 2011; Kama et al. 2013). Observations were obtained with ESA Herschel Space Observatory (Pilbratt et al. 2010) using the Heterodyne Instrument for the Far-Infrared (HIFI; de Graauw et al. 2010), and the Submillimeter Array (SMA). The aim of this paper is to determine the location, excitation, and physical conditions of the region(s) responsible for the organic emission in NGC 2071 and differentiate between a hot corino scenario or one related to the outflowing gas. Section 2 presents the observations, and subsequent results are listed in Sect. 3. The analysis is done in Sect. 4. The origin scenario is discussed in Sect. 5, with conclusions summarized in Sect. 6.
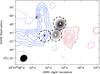 |
Fig. 1 Integrated line wings of 13CO emission (blue and red) around NGC 2071 obtained with the SMA. It is overplotted on the 1.3 mm continuum emission (grayscale) in steps of 3, 6, 9, 12σ (see van Kempen et al. 2012). Locations of continuum sources (A, B, and C) are labeled. The beam size of 3.4′′ × 2.9′′ is shown in a black ellipse in the lower left. Dashed circles indicate the regions integrated for organic emission, including region F (see text). |
Observational parameters.
2. Observations
Spectral line observations of HIFI (de Graauw et al. 2010) and the SMA were inspected for methanol (CH3OH), formaldehyde (H2CO) and/or methyl cyanide (CH3CN) emission lines. To aid the analysis into the conditions that set the chemistry the 987 and 752 GHz H2O lines are included in this paper (Suutarinen et al. 2014).
SMA observations of the line wings of 13CO J = 2–1 (see Fig. 1) are used as a reference for the location of the outflowing gas. Table 1 lists the observational settings of both the SMA and Herschel-HIFI observations. Data reduction was performed using a combination of the following software tools: the MIR package for IDL, MIRIAD, HIPE1 (Ott 2010) and CLASS in GILDAS2.
2.1. HIFI
HIFI3 observations of NGC 2071 were carried out within the scope of the WISH Key program (van Dishoeck et al. 2011), targeting rotational emission of H2O. All pointings were centered at a position with a Right Ascension of 05h47m04.4s and a Declination of 00d21m49s. Except the setting targeting the ground-state H2O line at 557 GHz (setting 2), all observations were done using DBS Fast Chop modes (see Table 1 for the observed HIFI bands and Observations Identification Numbers). After delivery, data were reprocessed with the default pipeline in HIPE 7.1 (Ott 2010) and calibration version HIFI_CAL_6_0. Further data reduction was done using HIPE 8.1. H and V spectra were averaged together prior to converting the data to the velocity scale. The WBS spectrometer provided a 4 GHz bandwidth with a 1.1 MHz frequency resolution (0.7 to 0.4 km s1). The beam of HIFI ranges from 18 to 41′′ much larger than the structure seen in van Kempen et al. (2012; see Table 1 and Fig. 1). Relative calibration errors are 15% for all Bands except the one in Band 5, which is 20%.
2.2. SMA
The SMA observed NGC 2071 in compact configuration on January 3rd 2010 using a bandwidth of 4 GHz centered at 230.538 GHz and 4 GHz centered at 219.634 GHz and a spectral resolution of 0.3 km s-1 4. The phase center was located at a Right Ascension of 05h47m04.7s and a Declination of + 00d21m44.0s. Continuum results were published in van Kempen et al. (2012). With a spatial resolution corresponding to ~1300 AU (3.4′′ × 2.9′′), the full extent of the flow is spatially resolved, as are the separations between most of the individual protostars (van Kempen et al. 2012). The noise levels were 4 mJy beam-1 for the continuum and 0.08 Jy beam-1 per 0.8 km s-1 bin. this corresponds to ~0.4 K in the 0.8 km s-1 bins. Calibration uncertainty in the lines was derived to be 15% after the model fitting of Uranus. We will follow the notation from van Kempen et al. (2012), in which the source IRS 3 is labeled as “A”, IRS 1 as “B” and IRS 5 as “C”. We note that the phase center is located in between “A” and “B”. As a result of the placement of correlator chunks, which optimized coverage for the CO isotopologues and continuum, several instrumental artifacts needed to be flagged at semi-regular intervals. The only one affecting emission lines of H2CO, CH3OH or CH3CN appears between the K = 1 and 2 transitions of the J = 12–11 ladder of CH3CN. The artificial feature is 8 channels wide with a regular increase per channel. Spectra were corrected by fitting and subtracting a step-function to these channels. Figure 2 presents the uncorrected CH3CN spectrum for source “A”.
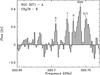 |
Fig. 2 CH3CN K = 12–11 ladder between 220.65 and 220.8 GHz observed by the SMA at the position of region “A”. The instrumental feature between the 2 and 0/1 blended transitions is labeled with “Instr”. |
3. Results
3.1. HIFI
In the HIFI bands, a total of 24 CH3OH emission lines were identified, but no CH3CN or H2CO lines were seen. The H2O lines are both very clearly detected with very broad line wings (>20 km s-1, see Fig. 4). The rms noise levels can be found in Table 1. More details on water emission will be in a forthcoming paper (McCoey & van Kempen, in prep.). Quantum numbers, rest frequencies, energy levels and velocity integrated flux densities of the detected transitions are listed in Table 2. We note that no lines were found in Band 5, which has a higher calibration uncertainty than the other Bands. As such the uncertainty for all lines in Table 2 is assumed to be 15%. Rest frequencies of all detections were checked against the molecular line survey of Kama et al. (2013). One feature was removed as questionable. Energy levels range from 75 to 500 Kelvin. The bulk of the lines are observed around frequencies of 766 GHz, within the Kup to Kl = − 3 to − 2 ladder (See Fig. 3). All detected lines have Kup = ≤ | 3 |. Lines are consistently ≈6 km s-1 wide. No evidence was found for an increase in line width as a function of energy level, as suggested by Kama et al. (2010). A very small shift in in velocity with respect to the source velocity is at times observed, but this is more likely to be an artifact of the methanol lines not being in the center of the HIFI bandpass and not a physical effect.
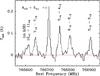 |
Fig. 3 Detected CH3OH lines observed with HIFI in 400 MHz centered at 766.75 GHz. We note that the 12+1–1 +0 line is from the lower sideband, with a rest frequency of 751.55 GHz. Channels are resampled to a width of 0.75 km s-1. The baseline is shown as a horizontal red line. At this frequency, the beam of HIFI is 26′′. |
Emission lines detected with HIFI.
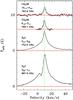 |
Fig. 4 HIFI Line profiles of the CH3OH 10+1–9+0 (763.9 GHz) and 6+2–5+1 (766.7 GHz) and H2O 211–202 (752.0 GHz) and 202–111 (987.9 GHz) transitions. The CH3OH lines are multiplied by a factor of 5. Spectra are binned to 0.3 km s-1 bins. Respective baselines are shown in red. The VLSR of NGC 2071 is shown in green. We note that the wings of the H2O lines extent beyond the horizontal scale. |
3.2. SMA
Table 3 lists the detected CH3OH, H2CO and CH3CN transitions with quantum numbers, rest frequencies, energy levels and integrated flux densities. For CH3OH, only transitions with Kup ≤ | 2 | are seen, with one line Kup = 0. For CH3CN, all detections are part of the K = 12–11 ladder around 220.7 GHz. All detected lines have line widths ranging between 5.9 to 8.0 km s-1 wide, similar to the line widths of CH3OH detected by HIFI. Emission is spatially resolved into three positions for most lines (see Fig. 5). Integrated flux densities are given for the three positions, labeled “A”, “B” and “F”. The “F” position is a position 4′′ west of B, with no continuum nor infra-red emission peak (van Kempen et al. 2012). Figure 1 shows “F” to be a position associated with entrained material. No velocity shifts were found between the three different positions.
Detected CH3OH, CH3CN and H2CO with the SMA.
The observed spatial distributions were fitted with Gaussian profiles with the goal to determine whether or not emission was spatially resolved. Spatial scales >1.5× the beam size along at least one axis were required. It was found that only H2CO emission from “F” and “B” is clearly spatially resolved. It is unresolved for “A”. CH3OH emission is predominantly unresolved at all three positions for all transitions. Only the CH3OH transition at 218.44 GHz hints at resolved emission at “F”, albeit only marginally (~ 1.2 × the beam). All CH3CN emission is unresolved at positions “A” and “B” and undetected at “F”. We note that SMA observations resolve out any structure larger than 13′′ (van Kempen et al. 2012). The narrow H2CO component seen in Johnstone et al. (2003) between 2.2 and 2.9 km s-1, is not detected and assumed to be resolved out. It thus originates within a component that is smoothly distributed on scales of ~4000 AU or larger.
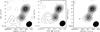 |
Fig. 5 H2CO 218.48 GHz (left), CH3OH 218.44 GHz (middle) and CH3CN 220.71 GHz (right) maps, revealing that the emission originates from the “A” and “B” cores and the blue flow (marked A, B and F). Contours are overplotted on the continuum emission from van Kempen et al. (2012) in 20, 40, 60 and 80% of the peak line integrated intensity, which is always located at core B. |
After correcting for the difference in beam size, the sum of the three regions seen in the H2CO 303–202 transition reproduces 96% of the emission listed in Johnstone et al. (2003). For the H2CO 322–221 transition, the 16 km s-1 wide component is not detected by the SMA. The sum of the three regions equals to 75% of the total intensity reported in Johnstone et al. (2003). It should be noted that the wide velocity component seen in Johnstone et al. (2003) was solely detected in the H2CO 322–221 transition, and not in any other line included in their study. For the 42–31 line at 218.44 GHz, the three regions reproduce 91% of the observed JCMT emission. Given the uncertainties in absolute flux calibration of both the JCMT (20%) and SMA (15%), organic emission seen with the JCMT is almost fully recovered by the SMA by summing the emission of the three regions. We thus assume that for all lines detected by the SMA, emission is produced in these three regions and not in any undetected component resolved out, or other regions within the JCMT beam.
4. Analysis
4.1. Excitation of CH3OH and H2CO
Most CH3OH and CH3CN transitions inherently possess high critical densities (109 cm-3 or higher, see Johnstone et al. 2003). As such, excitation conditions can reliably be derived using the one-dimensional non-LTE radiative transfer code RADEX (van der Tak et al. 2007) from line ratios. The transitions are assumed to be completely optically thin and fill the beam, following Kama et al. (2010). Optical depth effects and other radiative transfer effects such as IR pumping are discussed later.
A large grid of RADEX models was run to derive E-type CH3OH, H2CO and CH3CN emission line predictions between 215 and 1115 GHz, using datafiles provided by LAMDA5 (Schöier et al. 2005) with the upward rate coefficients calculated at the appropriate temperature. Temperatures ranged from 50 to 500 Kelvin, while densities were varied between 104 cm-3 and 109 cm-3.
Most collisional rate coefficient are limited to Jup = 15 and temperatures of 200 K. At higher kinetic temperatures, downward collisional rate coefficients of 200 K are used. The RADEX line width was set to 6 km s-1. A column density of only 107 cm-2 was chosen, since we are interested in line ratios of optically thin transitions. Differential beam dilution is corrected using the method described in the Appendix of B of Tafalla et al. (2010) assuming the regions are point sources. Dilution factors are thus proportional to  . However, test using the one-dimensional source structure (
 ) show little to no changes.
Predictions of line ratios were compared to the observed ratios of the five E-type CH3OH lines detected with the SMA for each region. Figure 6 shows the results of a Pearson’s χ2 test6. The errors on individual ratios are 21%. The ratios reveal clear differences in the physical conditions between the regions, presented in Fig. 6. The best fit found for region “F” is a density of 4 ± 0.1 × 107 cm-3. Region “A” is constrained to a density of 2 ± 0.8 × 107 cm-3, while region “B” is constrained to densities >2 × 108 cm-3. Temperatures are loosely constrained to values >100 Kelvin.
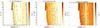 |
Fig. 6 Pearsons χ2 results of line ratios predicted by RADEX modeling and the observed ratio for all detected E-type CH3OH lines of the three regions (left: A, middle: B, right: F). The color-scales are chosen such that lighter color indicates lower χ2 values and better agreement with observed line ratio and models. Densities are well fitted with values of 2 × 107 cm-3 for region “A”, > 3 × 108 cm-3 for region “B” and 4 × 107 cm-3 for region “F”, |
Better constraints on the kinetic temperature can be obtained through comparison of the line ratio of H2CO 30,3–20,2 over 32,2–22,1 with the RADEX model. Figure 7 shows the resulting line ratios of our RADEX grid of these two H2CO lines. The observed ratios of the three regions are plotted at the densities derived using the χ2 tests of the CH3OH ratios. This results in temperature constraints of 215 K for region “A”, 150
 K for region “B” and 100
 K for region “F”. The error bar on the temperature can be significant, especially for regions “A” and “B”. Much higher temperatures (>400 K) are within uncertainty. This is in part due to the lack of collision rate coefficients above 300 K for H2CO. However, constraints on lower temperatures are much better. Even with these large error, all three regions are warmer than the surrounding envelope, but not hot (T> 500 K). Owing to the molecular structure of H2CO, there is no difference between using the 32,2–22,1 or 32,1–22,0 transition. Given the near identical line ratios of either with respect to the 30,3–20,2 line, the temperature constraint can be assumed to be robust and not affected by observational biases.
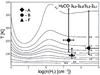 |
Fig. 7 Line ratio of H2CO 30,3–20,2 over 32,2–22,1 modeled with RADEX. Observed line ratios are shown with a diamond (A), circle (B) and triangle (F) at the best-fit densities derived using the CH3OH line ratios (see text). Error bars for the uncertainties originate from the line ratio error (21%). Errors on the densities originate from the χ2 fitting. Temperatures are 215 K (A), 150 K (B) and 100 K (F). |
The narrow range of constraints for “F” imply that the emission in that region comes from a more homogeneous medium than “A” or “B”. The less restrictive fits in density around the protostellar positions “A” and “B” likely indicate density gradients within the emitting region. The significant differences in density (2 × 107 cm-3 versus 3 × 108 cm-3) and, to a lesser extent, temperature (215 K versus 150 K) between “A” and “B” are surprising given the lack of difference in line width (6 km s-1 for both), individual line emission of the H2CO 32,2–22,1 line (109 versus 91 K km s-1), 30,3–20,2 line (267 vs. 213 K km s-1), resolved dust emission (0.13 Jy beam-1 versus 0.12 Jy beam-1, see Table 3 and Fig. 2 in van Kempen et al. 2012) or stellar (0.9 M⊙versus 0.5 M⊙) and individual envelope masses (8.2 M⊙versus 14.2 M⊙). The main difference between the two regions is that “B” powers the large NGC 2071 outflow, while “A” possesses a much weaker flow (Carrasco-González et al. 2012).
4.2. Optical depth
The assumption that the observed methanol lines are all optically thin must be investigated further. Using RADEX one can determine the column densities and in turn the associated optical depths. It should be noted that the solution is degenerate with an assumed source size within a single beam. Smaller source sizes require higher column densities and thus higher optical depths are to reproduce the same amount of emission. If the source fills the SMA beam, as assumed above, a column of 4 × 1015 cm-2 was derived to best fit the observed flux densities. In this model, optical depths are typically 0.01 or lower. RADEX shows that to produce optically thick lines with the observed emission, a column of 8 × 1017 cm-2 or higher is required. Such a column corresponds to a source size 14 times smaller than the SMA beam, equal to ~90 AU.
However, at these high column densities, some lines will mase, affecting line ratios. The 218.44 GHz line is a weak maser, but shows similar line strengths when masing. The largest effect is seen for the ratios between the 218.44, 220.08 and 229.76 GHz lines. At higher columns, RADEX shows the 229.76 line as an absorption feature of similar depth as the emission of the 218.44 GHz line. However, no absorption was seen. In addition, the 220.08 line should be 100 times brighter than the 218.44 GHz line, while a ratio of about 0.5 to 2.5 was observed. From this, we can thus exclude that the emission originates from a very small region with a very high column density. The theoretically largest column that correctly reproduces the observed line ratios is a few times 1016 cm-2, corresponding to an optical depth (τ) of 0.4. The assumption that all CH3OH emission is optically thin is thus justified.
Besides a high optical depth, IR pumping of low density (103 cm-3) methanol gas could also influence the observed line ratios for v = 0 rotationally excited transitions (Leurini et al. 2007). Observations of torsionally excited methanol lines (v = 1) are typically invoked to break the degeneracy. Although over 6 torsionally excited transitions were covered in the bandpass of the SMA, none were detected for the achieved sensitivity of (71 mJy in 2 km s-1 bins). In addition, no v = 1 transitions were detected in the HIFI bandpass. This indicates IR pumping has little to no effect on the methanol emission. RADEX experiments with a gray body radiation field and lower densities showed that although the ratios of non-masing lines are indeed reproduced, it is impossible to simultaneously quench all three maser lines and produce the correct ratios. It is possible to add a very small (<50 AU) IR pumped component to the observed ratios. This can account for 25% of the observed line strengths. Whether or not such a component is present requires deep observations of the v = 1 transitions, e.g., using the band around 241.2 GHz.
4.3. Excitation of CH3CN
RADEX results for CH3CN line ratios cannot improve on the solutions for the physical conditions obtained with H2CO and CH3OH, as all detected lines are part of the J=12–11 ladder. From the RADEX models we derive a kinetic temperature of 200 K or higher for “A” and ~150 K for “B”. These values are consistent with the results of CH3OH and H2CO. It is thus reasonable to assume that the CH3CN emission originates from the same gas as CH3OH and H2CO in “A” and “B”. However, CH3CN emission is absent from “F”.
With the optically thin assumption, the similarity of line ratios between CH3CN, H2CO and CH3OH in “A” and “B”, and the observed strength of the emission of H2CO and CH3OH in “F”, the relative abundance of CH3CN with respect to H2CO and CH3OH must be almost two orders of magnitude lower at “F” then in “A” and “B”. Excitation conditions cannot explain the lack of CH3CN emission at “F”.
4.4. Velocity profile: comparison to H2O
The behavior of the observed line ratio between CH3OH and H2O emission lines away from the source velocity differentiates between two potential formation routes of H2O (Suutarinen et al. 2014). If gas-phase CH3OH and H2O are created solely through grain mantle evaporation, the ratio will be flat. However, if gas-phase synthesis of H2O is taking place, the ratio will drop as more H2O is created from shocked material. A significant optical depth in the water line causes observed ratios to be higher than physical processes would produce. Although an optical depth cannot be derived because of a lack of observed isotopologues, it is hypothesized that the H2O 752 GHz may be affected near the line center (between 8.3 to 10.3 km s-1). In outflows of low-mass protostars (e.g., Kristensen et al. 2010), optical depths are factors of a few at line center.
However, owing to the high critical density of water transitions (>108 cm-3 for both the 987 and 752 GHz line), the assumed optically thick emission is most often effectively thin. The effects of water opacity on the ratio are still relatively small. See, e.g., Fig. 3 of Suutarinen et al. (2014). For velocities where optical depth may play a role, the ratio is overestimated by a factor of 2 at most.
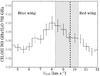 |
Fig. 8 Line ratio of the CH3OH 10+1–9+0 over the H2O 211–202 transitions, both rebinned to 0.5 km s-1. The VLSR is shown with a dashed line. The range of velocities where the high optical depth of the water line is hypothesized to affect the derived ratio is shown in gray. No correction has been applied (see text). |
Figure 8 shows the ratio of 763 101–90 CH3OH transition and the 752 211–202 H2O line. The observed CH3OH/H2O ratio clearly drops as a function of velocity on the blue wing. The red wing also is falling, although the number of channels not affected by optical depth is marginal. Velocities between 8.5 and 10.2 km s-1 are thought to be affected by optical depth. As seen in the lower excited 987 GHz H2O line, optical depth is expected to be at its highest there causing the ratios at these velocities to be higher.
Line ratios of other CH3OH/H2O combinations (e.g., the group of methanol lines at 766 GHz) show near identical profiles: A clear drop in the ratio on the blue side in combination with a drop on the red side and a middle likely affected by optical depth. Ratios derived using the 987 GHz H2O line are more affected by optical depth, but still reproduce the falling ratio of the blue wing.
5. Discussion: Origin of organic emission
Using the optically thin approximation, the observed spatial separation between the regions and lack of large-scale CH3OH emission, CH3OH HIFI detection originate solely in the three regions. The detected flux density for each line is a simple sum,  (1)where CH3OH is the total observed emission within the HIFI beam, RX the predicted emission from RADEX of region “A”, “B”, or “F” for that transition, X the relative contribution and C a constant to ensure the sum equals observed intensities.
If it is assumed XA, XB, and XF do not vary for individual CH3OH lines, and are thus not vectors themselves, the set of equations can be solved by rewriting the equation for individual CH3OH line contributions into a vector notation covering all the HIFI CH3OH lines,  (2)where CH3OH is a vector, one column wide, containing the HIFI-detected emission line flux densities, and RX are the vectors, again one column wide, containing the predicted fluxes obtained from RADEX for the 14 HIFI E-type methanol transitions with J ≤ 15. Higher J transitions are not available in the molecular datafile. A-type methanol is not included, since no constraints from the SMA are given for A-type methanol transitions. Even assuming they originate under identical conditions with an abundance ratio of 1:1, inclusion of A-type methanol does not contribute to the analysis below. C is the vector containing the constant C for each transition. Under the assumption that the source size is the same for all transitions, C will depend on the model parameters. Its only dependency is on the frequency of the transition. This known quantity determines the beam dilution in the HIFI beam. We realize that Eq. (2) is an oversimplification, as XA, XB, and XF may vary from transition to transition. Similarly, source sizes may become smaller for higher excited transitions. However, given the uncertainties in the observed emission, these simplifications produce acceptable results.
Solving Eq. (2) using a least squares method, optimal values of 13% for XA, 71% for XB and 16% for XF are derived. With constant calibration uncertainties (in the case for Herschel a conservative value of 10% on the flux densities is assumed), the square of the error on the relative contributions equals the mean error times the rank of the matrix divided by the number of transitions7. The solution actually has a rank of only 2 (as opposed to 3 as was expected). The reason for this reduction in rank is that emission contributions in the conditions for “F” and “B” are very similar for the transitions probed. These produce similar ladders and none of the transitions used can distinguish them. The statistical error on the values of 13, 71 and 16% is 4%.
For the detected SMA transitions, the mean of the individual relative contributions is indeed close to this value. Relative contributions of some of the individual transtions also adhere to the relation. For example, the CH3OH 3-2–4-1 line in Table 3, “A” contributes 17%, “B” contributes 58% and “F” contributes 25%. However, clear variations are visible. Stronger contributions from “F” are detected for some transitions. Whether or not these are introduced by optical depths effects because of the beam at “B”, or if the inferred density gradient at “B” comes into play, remains to be seen.
Tests using other density and temperature parameters for regions “A” and “B” (i.e., higher temperatures and densities) also show variations at the level of 5% in the inferred contributions.
Deviations in relative contributions for higher excitation lines were subsequently investigated. Changes larger than 20% in relative contributions to higher excitation lines (e.g., by forcing “A” to contribute 50% of the observed emission of a CH3OH line with Eup = 400 K) become very problematic. In such cases, HIFI detections with Eup< 250 K significantly violate the constraints set by the SMA detections. Variations of 5−10% are likely from transition to transition. In addition, emission from “B” and “F” cannot be disentangled from Herschel transitions alone. The percentages of “B” and “F” originate from the best solution in the least squares fitting and the mean of the SMA emission quantities.
The absence of molecular data beyond J = 15 likely hinders further interpretation. To improve on this analysis, a full radiative transfer model with power law exponents describing envelope structures is warranted. This is considered to be beyond the scope of this paper.
In the end, the emission contribution from each region to all HIFI detections are estimated to be:
-
15–20% originates in region “A”
-
60–70% in region “B”
-
15–25% in region “F”.
Typical spherical envelope models with power-law density profiles show the derived higher densities of a few times 107 cm-3 to a few times 108 cm-3 to be located on scales of ≃100 AU. Gas temperatures of 150−200 K are located at scales of 50 AU or less, very close to the inner edge of the model (Shirley et al. 2002; Jørgensen et al. 2002; Kristensen et al. 2012). Envelopes around the individual NGC 2071 sources have been found to be very similar to these typical low-mass protostellar envelopes (van Kempen et al. 2012).
A scenario in which organics formed within the icy grain mantles, were subsequently liberated by either sputtering or grain-grain collisions and are currently emitting in a compressed, UV heated gas component is much more likely. Recently, Kristensen et al. (2013) found kinematic components in H2O resolved lines consistent with dissociative jet shocks in the inner 100 AU to explain distinct velocity components in H2O spectra. Such components produce emission offset from the central velocity and as such cannot originate in a hot-core like environment. They are too powerful to be associated with potential non-dissociative shocks along the outflow cavity wall. An irradiated shock was inferred from the low abundances in that component.
Outflows are known to be present at the smallest scales: “B” is known to be the launching point of the large-scale bipolar jet of NGC 2071 (Skinner et al. 2009). “A” is a source of strong water masers. The maser spots display significant velocity shifts, indicative of jet activity (Torrelles et al. 1998; Carrasco-González et al. 2012).
5.1. Evidence for CH3OH destruction and H2O gas-phase synthesis
The decreasing ratio of the line profiles (see Fig. 8) shows that the chemistry in NGC 2071 is likely similar as that found for NGC 1333 IRAS 4A and 4B (Suutarinen et al. 2014). Atomic hydrogen formed in the shock is able to destroy CH3OH through chemical reactions featuring hydrogen extraction, e.g., H + CH3OH → H2 + CH2OH or H + CH3OH → H2 + CH3O (Baulch 2005). Both products are also quickly destroyed. All these reactions have activation energies of ~800 K, much lower than similar reactions capable of destroying H2O (activation energy of ~104 K). Gas-phase synthesis of H2O apparently can take place along the entire flow, given the brightness of the lines. Methanol emission is constrained to regions “A”, “B” and “F” by local physical conditions. Only regions of sufficient density (107 cm-3) can shield methanol from the high-temperature gas and subsequent dissociation. The high spatial resolution observations (Fig. 5) show that the regions where these physical conditions occur are small (<1500 AU in size). Observationally, we can conclude that the most likely location of these regions is in the neighborhood of protostars. This is not surprising considering envelope densities. However, correct conditions can also occur elsewhere, with no protostar nearby (region “F”).
5.2. Evidence for ice processing of CH3CN
The main difference between CH3CN and CH3OH is its formation. Both form predominantly on grain surfaces, but their reactions proceed differently under cold conditions. CH3CN is mainly formed through CN reacting with CO and other carbon containing species, while CH3OH is a hydrogenation product of CO. At low temperatures, hydrogen moves freely. However, thanks to the low mobility of CN, CH3CN formation requires heating and/or irradiation. Garrod et al. (2008) show an increase in more than order of magnitude in both gas and ice abundances for CH3CN as a function of time in various warm-up scenarios, while the CH3OH or H2CO formation remains unaltered compared to the cold phase formation. Additional gas-phase formation routes for CH3CN after grain mantle evaporation cannot be invoked, as these typically produce abundances almost two orders of magnitude lower than the grain surface formation route (see Figs. 7 to 9 and Appendix 2 of Garrod et al. 2008).
At region “F”, little to no ice processing must have taken place owing to the absence irradiation/heating at earlier stages, as opposed to the presence of a protostar at “A” and “B”. The young dynamical age of the NGC 2071 outflow (<104 yr, van Kempen et al., in prep.) further corroborates this, limiting the production of CH3CN.
6. Conclusions
This paper presented new data obtained with the SMA and Herschel-HIFI on the emission of organics around the cluster NGC 2071 and its outflow. The data were analyzed using a non-LTE radiative transfer code. The following conclusions are drawn:
-
All organic emission detected by HIFI and the SMA observations originates in two or three regions, labeled “A”, “B” and “F”. “A” and “B” are the positions of the two central protostars, while “F” is a shock position in the blue outflow. “F” is spatially resolved in some lower excitation lines, but does not emit in CH3CN.
-
Using the non-LTE radiative transfer code RADEX, physical conditions of the three individual regions were constrained using a χ2 analysis of the H2CO and CH3OH emission. Densities higher than 107 cm-3 (108 cm-3 in the case of “B”) and temperatures of 100 K or higher were derived.
-
All HIFI CH3OH detected are a sum of the emission of the three regions. On average 60−70% originates from “B”, 15−20% from “A” and 15−25% from “F”. No line originates solely from either “B” (the densest region) or “A” (the hottest region).
-
The high densities (> 107 cm-3) of the regions shield the gas-phase CH3OH. Everywhere else, CH3OH is destroyed through high-temperature reactions with hydrogen and/or through destructive sputtering.
-
The significant difference between CH3OH and H2O line wing shapes and extent suggests H2O formation through gas-phase synthesis along the flow.
-
The lack of CH3CN emission at “F” is attributed to a difference in ice processing history.
HCSS/HSpot/HIPE is a joint development (are joint developments) by the Herschel Science Ground Segment Consortium, consisting of ESA, the NASA Herschel Science Center, and the HIFI, PACS and SPIRE consortia.
GILDAS is a software package developed by IRAM to reduce and analyze astronomical data; http://www.iram.fr/IRAMFR/GILDAS
HIFI has been designed and built by a consortium of institutes and university departments from across Europe, Canada and the United States under the leadership of SRON Netherlands Institute for Space Research, Groningen, The Netherlands and with major contributions from Germany, France and the US. Consortium members are: Canada: CSA, U.Waterloo; France: CESR, LAB, LERMA, IRAM; Germany: KOSMA, MPIfR, MPS; Ireland, NUI Maynooth; Italy: ASI, IFSI-INAF, Osservatorio Astrofisico di Arcetri- INAF; Netherlands: SRON, TUD; Poland: CAMK, CBK; Spain: Observatorio Astronómico Nacional (IGN), Centro de Astrobiología (CSIC-INTA). Sweden: Chalmers University of Technology – MC2, RSS GARD; Onsala Space Observatory; Swedish National Space Board, Stockholm University – Stockholm Observatory; Switzerland: ETH Zurich, FHNW; USA: Caltech, JPL, NHSC.
The calibrated data is available through the Radio Telescope Data Center hosted by the Smithsonian Astrophysical Observatory http://www.cfa.harvard.edu/rtdc/
The Leiden Atomic and Molecular DAtabase: See http://www.strw.leidenuniv.nl/~moldata/
Pearson’s test is defined as  ) with Ri the observed ratio and Pi the calculated ratio over a total of n ratios, in which the smallest χ2 gives the best fit.
The error σ is calculated from  with σf the mean flux density error, M the rank of the matrix and N the number of entries.
Acknowledgments
The research of Tim van Kempen is made possible by the Allegro ARC node. Michel Fich, Carolyn McCoey and Sam Tisi are supported in this work by a Discovery Grant from NSERC and a Space Science Enhancement Program grant from the Canadian Space Agency. Doug Johnstone is supported by the National Research Council of Canada and by a Natural Sciences and Engineering Research Council of Canada (NSERC) Discovery Grant. We thank Mihkel Kama for useful discussions on methanol detections using HIFI. Michiel Hogerheijde and Floris van der Tak are thanked for assistance on RADEX. The WISH team, in particular Silvia Leurini, is thanked for usefull discussions.
References
- Baulch, D. L. 2005, J. Phys. Chem. Ref. Data, 34, 757 [NASA ADS] [CrossRef] [Google Scholar]
- Bisschop, S. E., Jørgensen, J. K., Bourke, T. L., Bottinelli, S., & van Dishoeck, E. F. 2008, A&A, 488, 959 [NASA ADS] [CrossRef] [EDP Sciences] [Google Scholar]
- Bottinelli, S., Ceccarelli, C., Lefloch, B., et al. 2004a, ApJ, 615, 354 [NASA ADS] [CrossRef] [Google Scholar]
- Bottinelli, S., Ceccarelli, C., Neri, R., et al. 2004b, ApJ, 617, L69 [NASA ADS] [CrossRef] [Google Scholar]
- Buckle, J. V., & Fuller, G. A. 2002, A&A, 381, 77 [Google Scholar]
- Butner, H. M., Evans, N. J. I., Harvey, P. M., et al. 1990, ApJ, 364, 164 [NASA ADS] [CrossRef] [Google Scholar]
- Carrasco-González, C., Osorio, M., Anglada, G., et al. 2012, ApJ, 746, 71 [NASA ADS] [CrossRef] [Google Scholar]
- Caux, E., Kahane, C., Castets, A., et al. 2011, A&A, 532, A23 [NASA ADS] [CrossRef] [EDP Sciences] [Google Scholar]
- Cazaux, S., Tielens, A. G. G. M., Ceccarelli, C., et al. 2003, ApJ, 593, L51 [NASA ADS] [CrossRef] [Google Scholar]
- Ceccarelli, C., Caselli, P., Herbst, E., Tielens, A. G. G. M., & Caux, E. 2007, Protostars and Planets V (Tucson: University of Arizona), 47 [Google Scholar]
- Chandler, C. J., Brogan, C. L., Shirley, Y. L., & Loinard, L. 2005, ApJ, 632, 371 [NASA ADS] [CrossRef] [Google Scholar]
- Comito, C., Schilke, P., Phillips, T. G., et al. 2005, ApJS, 156, 127 [NASA ADS] [CrossRef] [Google Scholar]
- de Graauw, T., Helmich, F. P., Phillips, T. G., et al. 2010, A&A, 518, L6 [NASA ADS] [CrossRef] [EDP Sciences] [Google Scholar]
- Flower, D. R., & Pineau Des Forêts, G. 2010, MNRAS, 406, 1745 [NASA ADS] [Google Scholar]
- Garrod, R. T., Weaver, S. L. W., & Herbst, E. 2008, ApJ, 682, 283 [NASA ADS] [CrossRef] [Google Scholar]
- Johnstone, D., Boonman, A. M. S., & van Dishoeck, E. F. 2003, A&A, 412, 157 [NASA ADS] [CrossRef] [EDP Sciences] [Google Scholar]
- Jones, A. P., Tielens, A. G. G. M., & Hollenbach, D. J. 1996, ApJ, 469, 740 [NASA ADS] [CrossRef] [Google Scholar]
- Jørgensen, J. K., Schöier, F. L., & van Dishoeck, E. F. 2002, A&A, 389, 908 [NASA ADS] [CrossRef] [EDP Sciences] [Google Scholar]
- Jørgensen, J. K., Bourke, T. L., Nguyen Luong, Q., & Takakuwa, S. 2011, A&A, 534, A100 [NASA ADS] [CrossRef] [EDP Sciences] [Google Scholar]
- Jørgensen, J. K., Favre, C., Bisschop, S. E., et al. 2012, ApJ, 757, L4 [NASA ADS] [CrossRef] [Google Scholar]
- Jørgensen, J. K., Visser, R., Sakai, N., et al. 2013, ApJ, 779, L22 [NASA ADS] [CrossRef] [Google Scholar]
- Kama, M., Dominik, C., Maret, S., et al. 2010, A&A, 521, L39 [NASA ADS] [CrossRef] [EDP Sciences] [Google Scholar]
- Kama, M., López-Sepulcre, A., Dominik, C., et al. 2013, A&A, 556, A57 [Google Scholar]
- Kristensen, L. E., Visser, R., van Dishoeck, E. F., et al. 2010, A&A, 521, L30 [NASA ADS] [CrossRef] [EDP Sciences] [Google Scholar]
- Kristensen, L. E., van Dishoeck, E. F., Bergin, E. A., et al. 2012, A&A, 542, A8 [NASA ADS] [CrossRef] [EDP Sciences] [Google Scholar]
- Kristensen, L. E., van Dishoeck, E. F., Benz, A. O., et al. 2013, A&A, 557, A23 [NASA ADS] [CrossRef] [EDP Sciences] [Google Scholar]
- Kurtz, S., Cesaroni, R., Churchwell, E., Hofner, P., & Walmsley, C. M. 2000, Protostars and Planets IV (Tucson: University of Arizona Press), eds. V. Mannings, A. P. Boss, & S. S. Russel, 299 [Google Scholar]
- Leurini, S., Schilke, P., Wyrowski, F., & Menten, K. M. 2007, A&A, 466, 215 [NASA ADS] [CrossRef] [EDP Sciences] [Google Scholar]
- López-Sepulcre, A., Taquet, V., Sánchez-Monge, Á., et al. 2013, A&A, 556, A62 [NASA ADS] [CrossRef] [EDP Sciences] [Google Scholar]
- Maret, S., Ceccarelli, C., Tielens, A. G. G. M., et al. 2005, A&A, 442, 527 [NASA ADS] [CrossRef] [EDP Sciences] [Google Scholar]
- Öberg, K. I., Bottinelli, S., & van Dishoeck, E. F. 2009, A&A, 494, L13 [NASA ADS] [CrossRef] [EDP Sciences] [Google Scholar]
- Ott, S. 2010, in Astronomical Data Analysis Software and Systems XIX. Proc. of a Conf. held October 4−8, 139 [Google Scholar]
- Pilbratt, G. L., Riedinger, J. R., Passvogel, T., et al. 2010, A&A, 518, L1 [CrossRef] [EDP Sciences] [Google Scholar]
- Sandford, S. A., & Allamandola, L. J. 1993, ApJ, 417, 815 [NASA ADS] [CrossRef] [PubMed] [Google Scholar]
- Schöier, F. L., van der Tak, F. F. S., van Dishoeck, E. F., & Black, J. H. 2005, A&A, 432, 369 [NASA ADS] [CrossRef] [EDP Sciences] [Google Scholar]
- Scoville, N. Z., Sargent, A. I., Sanders, D. B., et al. 1986, ApJ, 303, 416 [NASA ADS] [CrossRef] [Google Scholar]
- Shirley, Y. L., Evans, N. J. I., & Rawlings, J. M. C. 2002, ApJ, 575, 337 [NASA ADS] [CrossRef] [Google Scholar]
- Skinner, S. L., Sokal, K. R., Megeath, S. T., et al. 2009, ApJ, 701, 710 [NASA ADS] [CrossRef] [Google Scholar]
- Spaans, M., Hogerheijde, M. R., Mundy, L. G., & van Dishoeck, E. F. 1995, ApJ, 455, L167 [NASA ADS] [Google Scholar]
- Suutarinen, A. N., Kristensen, L. E., Mottram, J. C., Fraser, H. J., & van Dishoeck, E. F. 2014, MNRAS, 440, 1844 [NASA ADS] [CrossRef] [Google Scholar]
- Tafalla, M., Santiago-García, J., Hacar, A., & Bachiller, R. 2010, A&A, 522, A91 [NASA ADS] [CrossRef] [EDP Sciences] [Google Scholar]
- Takakuwa, S., Mikami, H., & Saito, M. 1998, ApJ, 501, 501, 723 [NASA ADS] [CrossRef] [Google Scholar]
- Torrelles, J. M., Gómez, J. F., Rodríguez, L. F., et al. 1998, ApJ, 505, 756 [NASA ADS] [CrossRef] [Google Scholar]
- van der Tak, F. F. S., van Dishoeck, E. F., & Caselli, P. 2000, A&A, 361, 327 [NASA ADS] [Google Scholar]
- van der Tak, F. F. S., Black, J. H., Schöier, F. L., Jansen, D. J., & van Dishoeck, E. F. 2007, A&A, 468, 627 [NASA ADS] [CrossRef] [EDP Sciences] [Google Scholar]
- van Dishoeck, E. F., Blake, G. A., Jansen, D. J., & Groesbeck, T. D. 1995, ApJ, 447, 760 [NASA ADS] [CrossRef] [Google Scholar]
- van Dishoeck, E. F., Kristensen, L. E., Benz, A. O., et al. 2011, PASP, 123, 138 [NASA ADS] [CrossRef] [Google Scholar]
- van Kempen, T. A., van Dishoeck, E. F., Güsten, R., et al. 2009, A&A, 501, 633 [NASA ADS] [CrossRef] [EDP Sciences] [Google Scholar]
- van Kempen, T. A., Longmore, S. N., Johnstone, D., Pillai, T., & Fuente, A. 2012, ApJ, 751, 137 [NASA ADS] [CrossRef] [Google Scholar]
- Visser, R., Kristensen, L. E., Bruderer, S., et al. 2012, A&A, 537, A55 [NASA ADS] [CrossRef] [EDP Sciences] [Google Scholar]
All Tables
All Figures
|
Fig. 1 Integrated line wings of 13CO emission (blue and red) around NGC 2071 obtained with the SMA. It is overplotted on the 1.3 mm continuum emission (grayscale) in steps of 3, 6, 9, 12σ (see van Kempen et al. 2012). Locations of continuum sources (A, B, and C) are labeled. The beam size of 3.4′′ × 2.9′′ is shown in a black ellipse in the lower left. Dashed circles indicate the regions integrated for organic emission, including region F (see text). |
| In the text | |
|
Fig. 2 CH3CN K = 12–11 ladder between 220.65 and 220.8 GHz observed by the SMA at the position of region “A”. The instrumental feature between the 2 and 0/1 blended transitions is labeled with “Instr”. |
| In the text | |
|
Fig. 3 Detected CH3OH lines observed with HIFI in 400 MHz centered at 766.75 GHz. We note that the 12+1–1 +0 line is from the lower sideband, with a rest frequency of 751.55 GHz. Channels are resampled to a width of 0.75 km s-1. The baseline is shown as a horizontal red line. At this frequency, the beam of HIFI is 26′′. |
| In the text | |
|
Fig. 4 HIFI Line profiles of the CH3OH 10+1–9+0 (763.9 GHz) and 6+2–5+1 (766.7 GHz) and H2O 211–202 (752.0 GHz) and 202–111 (987.9 GHz) transitions. The CH3OH lines are multiplied by a factor of 5. Spectra are binned to 0.3 km s-1 bins. Respective baselines are shown in red. The VLSR of NGC 2071 is shown in green. We note that the wings of the H2O lines extent beyond the horizontal scale. |
| In the text | |
|
Fig. 5 H2CO 218.48 GHz (left), CH3OH 218.44 GHz (middle) and CH3CN 220.71 GHz (right) maps, revealing that the emission originates from the “A” and “B” cores and the blue flow (marked A, B and F). Contours are overplotted on the continuum emission from van Kempen et al. (2012) in 20, 40, 60 and 80% of the peak line integrated intensity, which is always located at core B. |
| In the text | |
|
Fig. 6 Pearsons χ2 results of line ratios predicted by RADEX modeling and the observed ratio for all detected E-type CH3OH lines of the three regions (left: A, middle: B, right: F). The color-scales are chosen such that lighter color indicates lower χ2 values and better agreement with observed line ratio and models. Densities are well fitted with values of 2 × 107 cm-3 for region “A”, > 3 × 108 cm-3 for region “B” and 4 × 107 cm-3 for region “F”, |
| In the text | |
|
Fig. 7 Line ratio of H2CO 30,3–20,2 over 32,2–22,1 modeled with RADEX. Observed line ratios are shown with a diamond (A), circle (B) and triangle (F) at the best-fit densities derived using the CH3OH line ratios (see text). Error bars for the uncertainties originate from the line ratio error (21%). Errors on the densities originate from the χ2 fitting. Temperatures are 215 K (A), 150 K (B) and 100 K (F). |
| In the text | |
|
Fig. 8 Line ratio of the CH3OH 10+1–9+0 over the H2O 211–202 transitions, both rebinned to 0.5 km s-1. The VLSR is shown with a dashed line. The range of velocities where the high optical depth of the water line is hypothesized to affect the derived ratio is shown in gray. No correction has been applied (see text). |
| In the text | |
Current usage metrics show cumulative count of Article Views (full-text article views including HTML views, PDF and ePub downloads, according to the available data) and Abstracts Views on Vision4Press platform.
Data correspond to usage on the plateform after 2015. The current usage metrics is available 48-96 hours after online publication and is updated daily on week days.
Initial download of the metrics may take a while.