Fig. 1
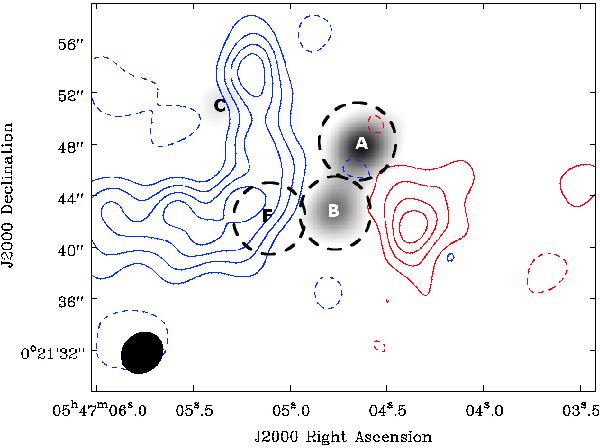
Integrated line wings of 13CO emission (blue and red) around NGC 2071 obtained with the SMA. It is overplotted on the 1.3 mm continuum emission (grayscale) in steps of 3, 6, 9, 12σ (see van Kempen et al. 2012). Locations of continuum sources (A, B, and C) are labeled. The beam size of 3.4′′ × 2.9′′ is shown in a black ellipse in the lower left. Dashed circles indicate the regions integrated for organic emission, including region F (see text).
Current usage metrics show cumulative count of Article Views (full-text article views including HTML views, PDF and ePub downloads, according to the available data) and Abstracts Views on Vision4Press platform.
Data correspond to usage on the plateform after 2015. The current usage metrics is available 48-96 hours after online publication and is updated daily on week days.
Initial download of the metrics may take a while.