Free Access
Fig. 8
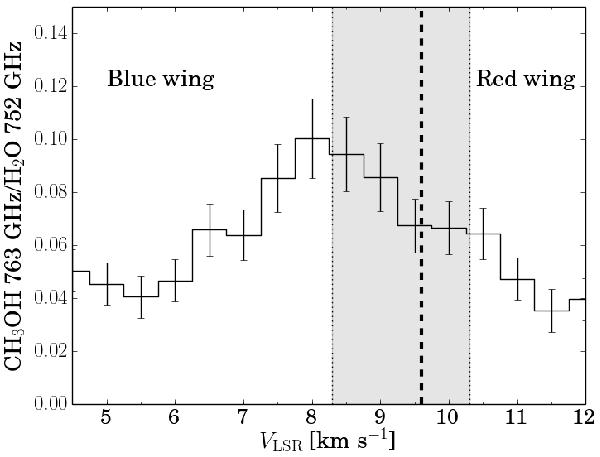
Line ratio of the CH3OH 10+1–9+0 over the H2O 211–202 transitions, both rebinned to 0.5 km s-1. The VLSR is shown with a dashed line. The range of velocities where the high optical depth of the water line is hypothesized to affect the derived ratio is shown in gray. No correction has been applied (see text).
Current usage metrics show cumulative count of Article Views (full-text article views including HTML views, PDF and ePub downloads, according to the available data) and Abstracts Views on Vision4Press platform.
Data correspond to usage on the plateform after 2015. The current usage metrics is available 48-96 hours after online publication and is updated daily on week days.
Initial download of the metrics may take a while.