Fig. 7
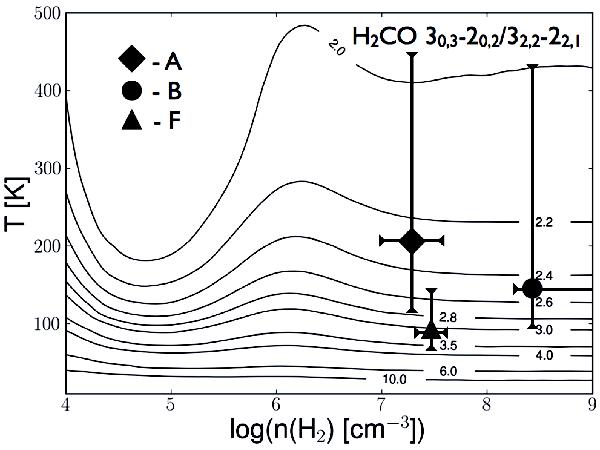
Line ratio of H2CO 30,3–20,2 over 32,2–22,1 modeled with RADEX. Observed line ratios are shown with a diamond (A), circle (B) and triangle (F) at the best-fit densities derived using the CH3OH line ratios (see text). Error bars for the uncertainties originate from the line ratio error (21%). Errors on the densities originate from the χ2 fitting. Temperatures are 215 K (A), 150 K (B) and 100 K (F).
Current usage metrics show cumulative count of Article Views (full-text article views including HTML views, PDF and ePub downloads, according to the available data) and Abstracts Views on Vision4Press platform.
Data correspond to usage on the plateform after 2015. The current usage metrics is available 48-96 hours after online publication and is updated daily on week days.
Initial download of the metrics may take a while.