Fig. 6
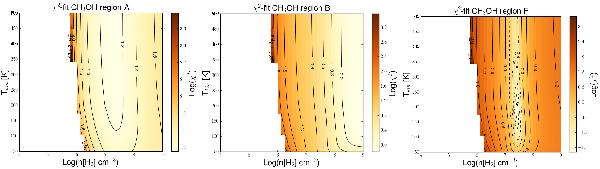
Pearsons χ2 results of line ratios predicted by RADEX modeling and the observed ratio for all detected E-type CH3OH lines of the three regions (left: A, middle: B, right: F). The color-scales are chosen such that lighter color indicates lower χ2 values and better agreement with observed line ratio and models. Densities are well fitted with values of 2 × 107 cm-3 for region “A”, > 3 × 108 cm-3 for region “B” and 4 × 107 cm-3 for region “F”,
Current usage metrics show cumulative count of Article Views (full-text article views including HTML views, PDF and ePub downloads, according to the available data) and Abstracts Views on Vision4Press platform.
Data correspond to usage on the plateform after 2015. The current usage metrics is available 48-96 hours after online publication and is updated daily on week days.
Initial download of the metrics may take a while.