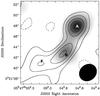
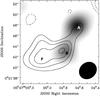
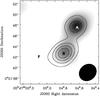
Fig. 5
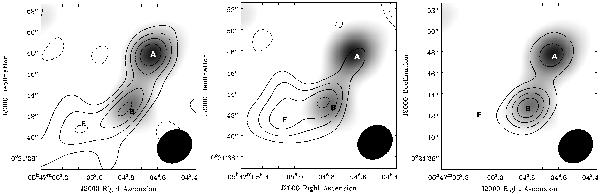
H2CO 218.48 GHz (left), CH3OH 218.44 GHz (middle) and CH3CN 220.71 GHz (right) maps, revealing that the emission originates from the “A” and “B” cores and the blue flow (marked A, B and F). Contours are overplotted on the continuum emission from van Kempen et al. (2012) in 20, 40, 60 and 80% of the peak line integrated intensity, which is always located at core B.
Current usage metrics show cumulative count of Article Views (full-text article views including HTML views, PDF and ePub downloads, according to the available data) and Abstracts Views on Vision4Press platform.
Data correspond to usage on the plateform after 2015. The current usage metrics is available 48-96 hours after online publication and is updated daily on week days.
Initial download of the metrics may take a while.