| Issue |
A&A
Volume 566, June 2014
|
|
|---|---|---|
| Article Number | A29 | |
| Number of page(s) | 12 | |
| Section | Interstellar and circumstellar matter | |
| DOI | https://doi.org/10.1051/0004-6361/201423727 | |
| Published online | 04 June 2014 | |
Ubiquitous argonium (ArH+) in the diffuse interstellar medium: A molecular tracer of almost purely atomic gas
1
I. Physikalisches Institut der Universität zu Köln,
Zülpicher Str. 77, 50937
Köln, Germany
e-mail:
This email address is being protected from spambots. You need JavaScript enabled to view it.
2
The Johns Hopkins University, Baltimore, MD
21218,
USA
3
Department of Astronomy, The University of Michigan,
500 Church Street, Ann Arbor, MI
48109-1042,
USA
4
California Institute of Technology, Pasadena, CA
91125,
USA
5
Sorbonne Universités, Université Pierre et Marie Curie, Paris 6,
CNRS, Observatoire de Paris, UMR 8112 LERMA, Paris, France
6
LERMA, CNRS UMR 8112, Observatoire de Paris & École
Normale Supérieure, 24 rue
Lhomond, 75005
Paris,
France
7
Department of Earth and Space Sciences, Chalmers University of
Technology, Onsala Space Observatory, 439 92
Onsala,
Sweden
8
Astronomy Department, University of Maryland,
College Park, MD
20742,
USA
9
Jet Propulsion Laboratory, California Institute of
Technology, Pasadena,
CA
91109,
USA
10
Max-Planck-Institut für Radioastronomie,
Auf dem Hügel 69, 53121
Bonn,
Germany
Received:
28
February
2014
Accepted:
29
March
2014
Abstract
Aims. We describe the assignment of a previously unidentified interstellar absorption line to ArH+ and discuss its relevance in the context of hydride absorption in diffuse gas with a low H2 fraction. The confidence of the assignment to ArH+ is discussed, and the column densities are determined toward several lines of sight. The results are then discussed in the framework of chemical models, with the aim of explaining the observed column densities.
Methods. We fitted the spectral lines with multiple velocity components, and determined column densities from the line-to-continuum ratio. The column densities of ArH+ were compared to those of other species, tracing interstellar medium (ISM) components with different H2 abundances. We constructed chemical models that take UV radiation and cosmic ray ionization into account.
Results. Thanks to the detection of two isotopologues, 36ArH+ and 38ArH+, we are confident about the carrier assignment to ArH+. NeH+ is not detected with a limit of [NeH+]/[ArH+] ≤ 0.1. The derived column densities agree well with the predictions of chemical models. ArH+ is a unique tracer of gas with a fractional H2 abundance of 10-4 − 10-3 and shows little correlation to H2O+, which traces gas with a fractional H2 abundance of ≈0.1.
Conclusions. A careful analysis of variations in the ArH+, OH+, H2O+, and HF column densities promises to be a faithful tracer of the distribution of the H2 fractional abundance by providing unique information on a poorly known phase in the cycle of interstellar matter and on its transition from atomic diffuse gas to dense molecular gas traced by CO emission. Abundances of these species put strong observational constraints upon magnetohydrodynamical (MHD)simulations of the interstellar medium, and potentially could evolve into a tool characterizing the ISM. Paradoxically, the ArH+ molecule is a better tracer of almost purely atomic hydrogen gas than Hi itself, since Hi can also be present in gas with a significant molecular content, but ArH+ singles out gas that is >99.9% atomic.
Key words: astrochemistry / line: identification / molecular processes / ISM: abundances / ISM: molecules / ISM: structure
© ESO, 2014
1. Introduction
Light hydrides of the type ZHn or ZH are important diagnostics of the chemical and physical conditions in space. Their lower
energy rotational transitions occur for the most part at terahertz frequencies (far-infrared
wavelengths). This frequency region can only be accessed to a limited extent from the
ground, even at elevated sites, because of strong atmospheric absorptions of
H2O and, to a
lesser degree, O2 and
other molecules. The Herschel Space Observatory (Pilbratt et al. 2010) has provided a powerful new probe of the
submillimeter and far-infrared spectral regions, which greatly expands upon the capabilities
afforded by earlier missions, such as the Kuiper Airborne Observatory (KAO;
Cameron 1976), the Infrared Space Observatory (ISO;
Kessler et al. 1996), and others, or from ground
with the Caltech Submillimeter Observatory (CSO; Phillips
1990) or the Atacama Pathfinder EXperiment (APEX; Güsten et al. 2006).
are important diagnostics of the chemical and physical conditions in space. Their lower
energy rotational transitions occur for the most part at terahertz frequencies (far-infrared
wavelengths). This frequency region can only be accessed to a limited extent from the
ground, even at elevated sites, because of strong atmospheric absorptions of
H2O and, to a
lesser degree, O2 and
other molecules. The Herschel Space Observatory (Pilbratt et al. 2010) has provided a powerful new probe of the
submillimeter and far-infrared spectral regions, which greatly expands upon the capabilities
afforded by earlier missions, such as the Kuiper Airborne Observatory (KAO;
Cameron 1976), the Infrared Space Observatory (ISO;
Kessler et al. 1996), and others, or from ground
with the Caltech Submillimeter Observatory (CSO; Phillips
1990) or the Atacama Pathfinder EXperiment (APEX; Güsten et al. 2006).
Observations of hydride molecules, in particular of H2O, in interstellar space, but also
in solar system objects, were among the important goals of the Herschel
mission. In fact, the cationic hydrides H2O+ (Ossenkopf et al.
2010), H2Cl+ (Lis et al. 2010),
and HCl+ (De Luca et al. 2012) were detected with Herschel
for the first time in the ISM. While the SH radical has its fundamental transition
at a frequency that was inaccessible to the high-resolution Heterodyne Instrument for
Far-Infrared Astronomy (HIFI; de Graauw et al. 2010),
it has been detected (Neufeld et al. 2012) with the
German REceiver At Terahertz frequencies (GREAT; Heyminck et
al. 2012) onboard the Stratospheric Observatory For Infrared Astronomy (SOFIA;
Young et al. 2012; Krabbe et al. 2013). OH+ (Wyrowski et al.
2010) and SH+ (Menten et al. 2011)
were detected with APEX from the ground shortly before Herschel, but many
additional observations were carried out with HIFI, (e.g., Godard et al. 2012). Several hydrides, e.g., OH+ and H2O+, were found to be widespread with
surprisingly high column densities, not only in Galactic sources (Gerin et al. 2010; Ossenkopf et al.
2010; Neufeld et al. 2010), but also in
external galaxies (Weiß et al. 2010; van der Werf et al. 2010; González-Alfonso et al. 2013). As both cations react fast with H2 to form H2O+ and H3O+, respectively, it was suspected
that these molecules reside in mostly atomic gas, which contains little H2 (Gerin et al. 2010). Detailed model calculations suggest that the abundances of
OH+ and
H2O+ are particularly high in gas with
molecular fraction of around 0.05 to 0.1 (Neufeld et al.
2010; Hollenbach et al. 2012). The
comparatively high column densities observed for these two molecular cations also require
cosmic ray ionization rates in the diffuse ISM to be considerably higher than that in the
dense ISM (Neufeld et al. 2010; Hollenbach et al. 2012; Indriolo et al.
2012). However, evidence for high ionization rates in the diffuse ISM, in the range
10-16 −
10-15 s-1, has been presented already earlier to explain the
amount of H in the diffuse ISM (McCall et al. 1998; Liszt 2003; Indriolo
& McCall 2012). Even higher cosmic ray ionization rates were estimated for
active galaxies such as NGC 4418 and Arp 220 (González-Alfonso et al. 2013, >10-13 s-1).
in the diffuse ISM (McCall et al. 1998; Liszt 2003; Indriolo
& McCall 2012). Even higher cosmic ray ionization rates were estimated for
active galaxies such as NGC 4418 and Arp 220 (González-Alfonso et al. 2013, >10-13 s-1).
Spectral line surveys of the massive and very luminous Galactic Center sources Sagittarius B2(M) and (N) were carried out across the entire frequency range of HIFI within the guaranteed time key project HEXOS, (Bergin et al. 2010). A moderately strong absorption feature was detected toward both sources near 617.5 GHz, but the carrier proved very difficult to assign (Schilke et al. 2010; Müller et al. 2013). This feature appears at all velocity components associated with diffuse, foreground gas, but is conspicuously absent at velocities related to the sources themselves, suggesting that the carrier resides only in very diffuse gas. The absorption line was detected toward other continuum sources as well during subsequent dedicated observations (within the guaranteed time key project PRISMAS; Gerin et al. 2010; Müller et al. 2013).
Very recently, Barlow et al. (2013) observed a line in emission at the same frequency toward the Crab Nebula supernova remnant, which they assigned to the J = 1 − 0 transition of argonium 36ArH+ at 617.525 GHz. In addition, they observed the J = 2−1 transition at 1234.602 GHz. Here we present evidence that 36ArH+ is also responsible for the absorption features detected in the HEXOS and PRISMAS spectra.
2. Observations
The 617.5 GHz features were first discovered in absorption in the full spectral scans of Sagittarius B2(M)1 and (N)2 carried out between 2010 March and 2011 April using Herschel/HIFI, within the framework of the HEXOS guaranteed time key Program. The data presented here have been re-reduced using an improved version of the HIFI pipeline, which results in significantly lower noise levels in the high-frequency HEB mixer bands. The line survey data have been calibrated with HIPE version 10.0 (Roelfsema et al. 2012) and the resulting double-sideband (DSB) spectra were subsequently reduced using the GILDAS CLASS3 package. Basic data reduction steps included removal of spurious features or otherwise unusable portions of the spectra. The continuum emission was then subtracted from the DSB scans by fitting a low-order polynomial (typically first, in a few cases second order). The continuum-subtracted DSB data were deconvolved (sideband separation through pure χ2 minimization; Comito & Schilke 2002) to provide a single-sideband (SSB) spectrum for each HIFI band. A linear least squares fit of the subtracted continuum values as a function of the LO frequency provided a reliable (unaffected by spectral features) parametrization of the continuum variability across each HIFI band, which was then folded back into the deconvolved, continuum-subtracted SSB spectra. Finally, the overall Sagittarius B2(M) and (N) continuum was rendered self-consistent in two steps: the first adjustment consisted of an additive factor for each band, to achieve a zero-continuum level for the saturated absorption features; the second adjustment required a multiplicative factor, in order for the continuum values in overlap regions between bands to be consistent with one another.
3. Spectroscopy
The noble gas hydride cations NgH+, with Ng heavier than helium, are isoelectronic with the
hydrogen halides HX; HeH+ is isoelectronic with H2 with
 ground
electronic states. All non-radioactive noble gas hydride cations have been thoroughly
characterized both spectroscopically and kinetically.
ground
electronic states. All non-radioactive noble gas hydride cations have been thoroughly
characterized both spectroscopically and kinetically.
On Earth, 40Ar with an isotopic abundance of 99.6% is by far the dominant isotope (Berglund & Wieser 2011), but the terrestrial 40Ar originates almost exclusively from the radioactive decay of 40K. Solar and interstellar argon is dominated by 36Ar (~84.6%), followed by 38Ar (~15.4%), with only traces of 40Ar (~0.025%) (Wieler 2002).
3.1. Rest frequencies
Rest frequencies of 36ArH+, 38ArH+, and 20NeH+ (which was in the frequency range of the survey) were taken from the Cologne Database for Molecular Spectroscopy (CDMS, Müller et al. 2001, 2005)4. Extensive rotational and rovibrational data were critically evaluated and combined in one global fit for either molecular cation taking the breakdown of the Born-Oppenheimer approximation into account.
The most important spectroscopic data in the case of ArH+ are the measurements of rotational transitions of 40ArH+ (Brown et al. 1988; Liu et al. 1987) and of the J = 1−0 transitions of 36ArD+, 38ArD+, and 40ArD+ (Bowman et al. 1983). Additional data comprise further rotational transition frequencies of 40ArD+ (Odashima et al. 1999), as well as rovibrational data of 40ArH+ (Brault & Davis 1982; Johns 1984), 36ArH+, and 38ArH+ (Filgueira & Blom 1988), and of 40ArD+ (Johns 1984). Very recently, Cueto et al. (2014) reported rovibrational transition frequencies, which were rather accurate by infrared standards (≈3–4 MHz), but only of modest accuracy by microwave standards. Inclusion of these data, therefore, did not change the frequencies and uncertainties significantly.
Rotational spectra of 20NeH+, 22NeH+, 20NeD+, and 22NeD+ were published by Matsushima et al. (1998). Additional, mostly rovibrational, data were taken from Wong et al. (1982); Ram et al. (1985); Liu et al. (1987); Civiš et al. (2004). The electric dipole moments of ArH+ and NeH+ (2.2 D and 3.0 D, respectively) were taken from quantum chemical calculations (Cheng et al. 2007). Other transition frequencies used in the analysis were taken from the CDMS and JPL (Müller et al. 2001, 2005; Pickett et al. 1998) catalogs. Specifically, the methanimine (H2CNH) entry, based on Dore et al. (2012), was taken from the CDMS, while the methylamine (CH3NH2) entry, based on Ilyushin et al. (2005), was taken from the JPL catalog.
4. Results
We report here the detection of an absorption line we identify with 36ArH+(1–0) toward a number of strong continuum sources, viz. SgrB2(M) and SgrB2(N) from the HEXOS key Program (Bergin et al. 2010), G34.26+0.15, W31C (G10.62-0.39), W49(N), and W51e, from the PRISMAS key Program (Gerin et al. 2010). These sources are star-forming regions that provide strong continuum background illumination for absorption studies of foreground material. Their being star-forming regions, however opens also the possibility of the background continuum being contaminated by source-intrinsic emission lines. The molecular cation is observed at all velocities corresponding to diffuse molecular clouds on the line of sight toward these sources, but is conspicuously absent (or very weak) at velocities related to the sources themselves. We report also upper limits on the column densities of 20NeH+ toward SgrB2(M) and (N).
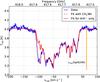 |
Fig. 1 Spectrum of 36ArH+(1–0) toward SgrB2(M), with fit including the H2CNH line blending at –110 km s-1 (see Fig. 3) as a dashed red line, and fit of 36ArH+ only in red.Note the lack of absorption at the source velocity 64 km s-1, indicated by the vertical orange marker. |
In principle, the differential rotation of the Milky Way separates spectral features at different Galactocentric radii into distinct locations in velocity space (see, e.g., Vallée 2008). Table 1 lists the different velocity components detectable along the sight-line to the Galactic Center, with the color referring to Fig. 4. The distance determination and hence the assignment to specific spiral arms is complicated due to the streaming motions in the arms (Reid et al. 2009). Particularly, given the kind of gas the ArH+ line is tracing (see discussion below), we also have to allow for the possibility of detecting inter-arm gas. The exact location of the Galactic center gas observed toward the SgrB2 sources within the Central Molecular Zone is not easily established, due to the non-circular orbits in the Bar potential (Rodriguez-Fernandez & Combes 2008).
Barlow et al. (2013) detected the (1–0) and (2–1) transitions of 36ArH+ in emission toward the Crab Nebula, the remnant of supernova 1054. The OH+ ion was detected in the same spectra, and both ions are probably excited mainly by warm electrons in the same filaments and knots that show low-ionization atomic lines in the visible spectrum and H2 emission lines in the infrared. The conditions in the general ISM we observe, and hence the chemistry, are very different.
In SgrB2(M), we detect only one very wide line, in absorption, which does not absorb at the source intrinsic velocity (see Fig. 1). The breadth of the absorption features introduces a potential uncertainty in the identification, which is definitively resolved by the observation of two different isotopic forms of ArH+. Our non-detection of the (2–1) line, which is also covered by the survey, is not surprising, since the molecule possesses a very high dipole moment, thus the transitions have a high critical density, and therefore, in the absence of high density or a very strong FIR field, most of the population will be in the rotational ground state. Fortunately, the 38ArH+(1–0) line is covered in the observation as well, and, although blended with the CH3OH(4−2,3−3−1,3) absorption line, mirrors the absorption pattern of the 36ArH+(1–0) so closely that we do not have any doubt about the correct identification of the carrier as 36ArH+ (Fig. 2). The fit was conducted with the solar system value of 36Ar/38Ar = 5.6, which seems to reproduce the 38ArH+(1–0) line well.Both 36Ar and 38Ar are mostly produced in explosive nucleosynthesis through oxygen burning (Woosley et al. 2002).
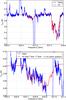 |
Fig. 2 Spectra with predictions for 36ArH+ and 38ArH+ (top) and zoom in to 38ArH+ (bottom). The 38ArH+ spectrum is scaled from 36ArH+ assuming as 36Ar/38Ar ratiothe solar system value of 5.6. |
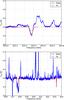 |
Fig. 3 The H2CNH(22,0 − 11,1) line with fit (top) and the two H2CNH lines (bottom). |
The 36ArH+ line is blended (at a velocity of about –110 km s-1) with the H2CNH(22,1−11,0) absorption feature at 617.873 GHz (Fig. 3). The strength of this feature can be estimated, since at 623.292 GHz one finds the H2CNH(22,0−11,1) line, which is almost identical in excitation and line strength (Fig. 3). However, the H2CNH(22,0−11,1) line seems to be itself contaminated with the flank of the adjacent CH3NH2(92,6 − 81,6) emission line and thus the absorption could well be underestimated. The strength of the –110 km s-1 ArH+ absorption component should therefore be regarded as a lower limit. The NeH+(1–0) line at 1039.3 GHz is also covered by the survey and is not detected. Assuming the same excitation conditions, we get a lower limit of [ArH+]/[NeH+] ≥ 10. Although Ne is about 30 times more abundant than Ar, this result is not unexpected, given the different ionization potentials of these species (see Sect. 5).
The column densities were determined using the XCLASS@CASA program5 (Möller et al., in prep.), which fits the absorption spectrum with multiple Gaussian components in opacity (hence taking the line shape changes due to opacity into account), assuming an excitation temperature of 2.7 K, using MAGIX (Möller et al. 2013).
In Fig. 4, we show the ArH+ column density determined in this way, together with the H2 column density, determined from HF absorption, the H2O+ column density, which traces diffuse gas with an H2/H fraction of 5–10% (Neufeld et al. 2010), atomic hydrogen from Winkel et al. (in prep.), and the ArH+ abundance relative to atomic hydrogen. The latter is justified by our result from Sect. 5, which shows that ArH+ traces gas with a H2/H of ≈10-3. The plots are ordered in descending abundance of the species with respect to H2. ArH+ does not correlate either with molecular gas traced by HF, or the diffuse gas traced by H2O+, which points to different molecular fractions of gas traced by ArH+ (f(H2) ≈ 10-3) and H2O+ (f(H2) ≈ 0.1).
The ArH+ abundance varies between3 × 10-8 and 5 × 10-11, except at very strong Hi peaks, and seems to vary smoothly with velocity, with the highest values achieved at the lowest velocities – which however can be affected by the blending with H2CNH. Both ArH+ and H2O+ show a distribution in velocity that is more or less continuous and – unlike HF – does not show any breaks associated with the different spiral arm/Galactic Center velocity components. This velocity structure points to the gas responsible for the ArH+ and H2O+ not only tracing spiral arms, but a more continuous mass distribution including interarm gas, which appears to be less molecular (Sawada et al. 2012a,b).
In Fig. 5, we show the fit toward SgrB2(N). It morphologically looks very different from that toward SgrB2(M), which opens the exciting possibility to study the variation of the ArH+ column density between two nearby lines-of-sight, as have been seen for H3O+ toward the same sightlines (Lis et al. 2014). However, there is still contamination by emission lines from the background source, which is more pronounced for SgrB2(N) than for SgrB2(M). An investigation of all emission lines from the survey, which is planned, would enable us to predict the background source emission, and therefore the variation of ArH+. At present, however, this investigation has not yet been completed, and in the absence of solid evidence we take the prudent approach of assuming that most of the variations are due to emission line contamination.
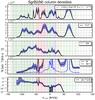 |
Fig. 4 Column density per km s-1 of HF, H2O+, ArH+, and H, in descending order of f(H2) traced by the species. The color coding of the frequencies is explained in Table 1. The error estimate for ArH+ was done using the MAGIX Interval Nested Sampling algorithm (Möller et al. 2013), which implements a Markov chain Monte Carlo (MCMC) method to calculate the Bayesian evidence and Bayesian confidence interval. Hi column density errors were calculated by propagating uncertainties from the input emission and absorption spectra using a Monte-Carlo sampling technique. For the other species, a ±20% error of the column densities was assumed. The uncertainty is marked by the blue shading around the curves. |
In Figs. 6 and 7 we show the data obtained toward the PRISMAS sources G34.25+0.15, W31C (G10.6), W49N, and W51e, together with ArH+ and H column densities (Winkel et al., in prep.) and ArH+ abundances relative to H. ArH+ is weak or absent toward the source envelopes. In the following, we briefly describe the individual sources, following the discussion in Godard et al. (2012) and Flagey et al. (2013).
G34.26+0.15:
has a source intrinsic velocity of vLSR = 58 km s-1. The ArH+ absorption at ≈60 km s-1 is associated with a strong absorption feature tracing infalling material. Foreground gas is detected at velocities between 0 and 45 km s-1.
W31C:
has a source intrinsic velocity of vLSR = −2 km s-1. Foreground gas is detected between ≈10 and 50 km s-1. The strongest feature appears at 40 km s-1, at the same velocity as H3O+ absorption. There could be a weak and broad ArH+ absorption associated with this source.
W49N:
has a source intrinsic velocity of vLSR = 10 km s-1. This sight-line presents the strongest ArH+ absorption outside the Galactic center. Given the large distance (11.4 kpc). the line of sight crosses two spiral arms. The absorption is stronger in the 65 km s-1 feature, associated with the Sagittarius spiral arm. The weak absorption near 10 km s-1 may be associated with W49 itself.
W51e:
has a source intrinsic velocity of vLSR = 57 km s-1. Foreground absorption appears between 0 and 45 km s-1 and there is a deep absorption near 65 km s-1 associated with an infalling layer in the W51 complex. The gas near 22 km s-1 is prominent in CH+ and C+, not in molecular lines but shows up weakly in HF and H2O. Some of the Hi signal could be associated with the outflow in W51e.
The spectra also show that there is no very tight correlation with the gas traced by OH+ and H2O+. The ArH+ abundances relative to H are similar to those measured on the SgrB2 sightlines, viz. 3 × 10⁻⁹ and 10-11. The Hi data toward all sources have some high column density spikes that are probably artifacts related to high opacity regions and the corresponding ArH+ abundance should be disregarded. The continuity of the ArH+ absorption and the large width may indicate that some features are associated with the interarm gas.
5. Chemistry of argon in diffuse interstellar clouds
5.1. Basic features of argon chemistry
The interstellar chemistry of the element argon shows several noteworthy features that we list below.
-
1)
The ionization potential of atomic argon,IP(Ar) = 15.76 eV,is greater than that of hydrogen,IP(H) = 13.5986 eV.As a result, argon is shielded from ultraviolet radiation capable ofionizing it, and is primarily neutral in the cold neutral medium.
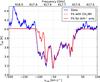
Fig. 5 Fit of SgrB2(N). The H2CNH(22,0 − 11,1) lines (here with the additional 80 km s-1 component) has been taken out the same way as for SgrB2(M). There has been no correction for emission lines from the background source, which most likely distort the absorption profile.
Table 2Reaction list.
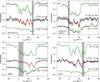
Fig. 6 Observations of OH+, H2O+, and ArH+ toward PRISMAS sources. The green lines for OH+ and H2O+, whose transitions have hyperfine structure, give the deconvolved strength of the main hyperfine component.The red lines are fits to the ArH+ spectra used in calculating the column densities presented in Fig. 7. Note that ArH+ spectra have been scaled up to more clearly show the absorption profiles. Vertical dashed lines and gray shaded regions mark the systemic velocity and velocity dispersion observed for background sources. All OH+ and H2O+ spectra in these sight lines will be presented and analyzed in detail by Indriolo et al. (in prep.). Analyses of OH+ and H2O+ that only utilized a subset of the eventual data have been performed for W31C (Gerin et al. 2010), W49N (Neufeld et al. 2010), and W51 (Wyrowski et al. 2010; Indriolo et al. 2012).
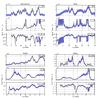
Fig. 7 Column density per km s-1 of ArH+ and H and abundance of ArH+ relative to H toward the PRISMAS sources. The H column densities come from Winkel et al. (in prep.). The uncertainty is marked by the blue shading around the curves.
-
2)
The proton affinity of argon, PA(Ar) = 369 kJ mol-1 (Hunter & Lias 1998), is smaller than that of molecular hydrogen, PA(H2) = 422 kJ mol-1. As a result, proton transfer from H
 to Ar is endothermic, with an endothermicity equivalent to 6400 K (Villinger et al.
1982). Moreover, the argonium ion, ArH+, can be destroyed by means of an exothermic
proton transfer to H2, as well to other neutral species with proton
affinities greater than that of Ar: these include C, N, CO, and O (Rebrion et al.
1989; Bedford & Smith 1990). Most importantly, however, the proton affinity
of Ar is larger than that of atomic hydrogen: thus, ArH+ is not destroyed by
reaction with atomic hydrogen in the cold diffuse medium.
to Ar is endothermic, with an endothermicity equivalent to 6400 K (Villinger et al.
1982). Moreover, the argonium ion, ArH+, can be destroyed by means of an exothermic
proton transfer to H2, as well to other neutral species with proton
affinities greater than that of Ar: these include C, N, CO, and O (Rebrion et al.
1989; Bedford & Smith 1990). Most importantly, however, the proton affinity
of Ar is larger than that of atomic hydrogen: thus, ArH+ is not destroyed by
reaction with atomic hydrogen in the cold diffuse medium. -
3)
The ionization potential of atomic argon, IP(Ar) = 15.76 eV, is smaller than IP(H) + D0(H2) = 18.09 eV, where D0(H2) = 4.48 eV is the dissociation energy of H2. As a result, the dissociative charge transfer reaction Ar+ + H2 → Ar + H + H+ is endothermic and negligibly slow at the temperature of diffuse interstellar clouds. Thus, in the reaction of Ar+ and H2, the primary product channel leads to the formation of ArH+ via the H atom abstraction reaction Ar+ + H2 → ArH+ + H. This thermochemistry is different from that of the more abundant noble gas elements He and Ne, which have ionization potentials (24.5874 eV and 21.5645 eV respectively) in excess of IP(H) + D0(H2); those elements do not efficiently form a hydride cation through reaction of their cation with H2, because the product channel is dominated by dissociative charge transfer.
-
4)
Dissociative recombination (DR) of ArH+ (i.e., ArH+ + e → Ar + H) is unusually slow. While almost all diatomic molecular ions, including HeH+ and NeH+ (Takagi 2004; Mitchell et al. 2005a), undergo rapid dissociative recombination (DR) at the temperatures of diffuse clouds (≲100 K) – with typical rate coefficients ~10-7 cm3 s-1 – recent storage ring measurements of the DR of ArH+ have found the process too slow to measure at energies below 2.5 eV (Mitchell et al. 2005b). While peaks in the DR cross-section have been found at electron energies of 7.5, 16, and 26 eV, and are readily understood with reference to the potential energy curves for ArH+, these higher energies are not relevant in cold interstellar gas clouds. Thus, the experimental data place an upper limit of 10-9 cm3 s-1 on the DR rate coefficient at interstellar temperatures.
-
5)
The photodissociation rate for ArH+ is unusually small. At wavelengths beyond the Lyman limit (i.e., >912 Å) photodissociation is dominated by transitions to a repulsive B1Π state, with a vertical excitation energy of 11.2 eV, and to a repulsive A
 state, with an excitation energy of 15.8 eV (Alexseyev et al. 2007). The former
transition has an unusually small dipole moment (0.13 D), while the latter provides
a strong absorption feature that has its peak shortward of the Lyman limit. Recent
theoretical calculations of the photodissociation cross-section have been performed
by Alexseyev et al. (2007) using the multireference Spin-Orbit Configuration
Interaction approach. Adopting this cross-section, we estimate a photodissociation
rate of only 1.0 × 10⁻¹¹
s-1 for an unshielded ArH+ molecule exposed to the
mean interstellar radiation field (ISRF) given by Draine (1978). This value is more
than two orders of magnitude smaller than that for the isoelectronic HCl molecule
(Neufeld & Wolfire 2009).A similar estimate of the ArH+ photodissociation rate
was obtained from the same theoretical cross-sections by Roueff et al. (2014)
state, with an excitation energy of 15.8 eV (Alexseyev et al. 2007). The former
transition has an unusually small dipole moment (0.13 D), while the latter provides
a strong absorption feature that has its peak shortward of the Lyman limit. Recent
theoretical calculations of the photodissociation cross-section have been performed
by Alexseyev et al. (2007) using the multireference Spin-Orbit Configuration
Interaction approach. Adopting this cross-section, we estimate a photodissociation
rate of only 1.0 × 10⁻¹¹
s-1 for an unshielded ArH+ molecule exposed to the
mean interstellar radiation field (ISRF) given by Draine (1978). This value is more
than two orders of magnitude smaller than that for the isoelectronic HCl molecule
(Neufeld & Wolfire 2009).A similar estimate of the ArH+ photodissociation rate
was obtained from the same theoretical cross-sections by Roueff et al. (2014) -
6)
The primary cosmic ray ionization rate for Ar is an order of magnitude larger than that for H (Kingston 1965; Jenkins 2013).
As is always the case in interstellar chemistry (Neufeld & Wolfire 2009; hereafter NW09), basic thermochemical facts (i.e., 1 through 3 above) play a key role. Clearly, (1) and (2) above are detrimental to the production and survival of argonium in the interstellar medium, while (3) enhances the production rate relative to HeH+ and NeH+. Two unusual features of the kinetics of ArH+ (4 and 5) enhance its survival in the diffuse ISM, while consideration (6) enhances the production of Ar+ relative to that of H+.
5.2. Diffuse cloud models
In modeling the chemistry of argonium in diffuse molecular clouds, we have modified the diffuse cloud model presented by NW09 and Hollenbach et al. (2012) by the addition of the reactions listed in Table 2. In this reaction network, ArH+ is produced in a two step process, in which atomic argon undergoes ionization by cosmic rays, and the resultant Ar+ ion reacts with H2 to form ArH+. ArH+ is destroyed by photodissociation, or by transferring a proton to a neutral species (primarily O or H2) of larger proton affinity than Ar. We note here that in our model we cannot distinguish if the primary ionization is caused by cosmic rays or X-rays, which can play a role in the Galactic center.
In Fig. 8 we show the resultant Ar+ and ArH+ abundances for our standard diffuse cloud model. Here, a cloud with an assumed density, nH, of 50 H nuclei per cm-3, is modeled as a slab that is irradiated from both sides by a UV radiation field of intensity equal to that of the mean ISRF (Draine 1978). The assumed primary cosmic ray ionization rate for atomic hydrogen is ζp(H) = 2 × 10-16 s-1. Results are shown as a function of depth below the cloud surface, measured in terms of visual extinction, AV = 5.9 × 10⁻²²NH cm2 mag when NH is the column density in cm-2. For the model shown in Fig. 8, the total visual extinction through the slab is AV(tot) = 0.3 mag, and thus the slab midplane is located at AV = 0.15 mag.
In Fig. 9, the rates of formation (dashed lines) and destruction (solid lines) by various processes are shown for Ar+ (upper panel) and ArH+ (lower panel). The upper panel of Fig. 9 shows that – even close to the cloud surface where the molecular fraction is smallest – the destruction of Ar+ is dominated by reaction with H2 to form ArH+. Competing pathways, including mutual neutralization with PAH cations, charge transfer with neutral PAHs, and radiative recombination are almost negligible for molecular hydrogen fractions ≳10-4. Thus, once the molecular fraction exceeds 10-4, more than 75% of Ar ionizations lead to the formation of ArH+.
The lower panel of Fig. 9 indicates that the
destruction of ArH+
is dominated by three processes: proton transfer to H2, proton transfer to atomic
oxygen, and photodissociation. Setting the Ar ionization rate equal to the rate of
ArH+ destruction
via these three processes, we may approximate the predicted ArH+ abundance by the equation
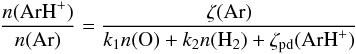 (1)where
k1 = 8 ×
10-10 cm3 s-1 is the rate
coefficient for proton transfer to H2, k2 (assumed equal to k1) is the rate
coefficient for proton transfer to O, and ζpd(ArH+) is the
photodissociation rate for ArH+ (equal to 1.1
× 10-11χUVs-1 in the
limit of no shielding, where χUV is the intensity of the ISRF in
units of the mean Galactic value given by Draine 1978). The numerator in Eq. (1) is the total ionization rate for Ar, which,
following Jenkins (2013), we take as (10 +
3.85φ)ζp(H),
where φ is
the number of secondary ionizations of H per primary ionization. Using the fit to
φ given by
Dalgarno et al. (1999), we find that φ ranges from 0.48 to 0.26 within the standard
cloud model presented here. Adopting the middle of that range, we find that
ζ(Ar) ~
11.4ζp(H).
(1)where
k1 = 8 ×
10-10 cm3 s-1 is the rate
coefficient for proton transfer to H2, k2 (assumed equal to k1) is the rate
coefficient for proton transfer to O, and ζpd(ArH+) is the
photodissociation rate for ArH+ (equal to 1.1
× 10-11χUVs-1 in the
limit of no shielding, where χUV is the intensity of the ISRF in
units of the mean Galactic value given by Draine 1978). The numerator in Eq. (1) is the total ionization rate for Ar, which,
following Jenkins (2013), we take as (10 +
3.85φ)ζp(H),
where φ is
the number of secondary ionizations of H per primary ionization. Using the fit to
φ given by
Dalgarno et al. (1999), we find that φ ranges from 0.48 to 0.26 within the standard
cloud model presented here. Adopting the middle of that range, we find that
ζ(Ar) ~
11.4ζp(H).
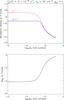 |
Fig. 8 Abundances of Ar+ and ArH+ as function of AV (upper panel) and f(H2) (lower panel). The elemental abundance of Ar is 3.2 × 10⁻⁶, so most of the Argon is still neutral. |
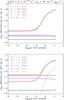 |
Fig. 9 Rates of formation (dashed lines) and destruction (solid lines) by various processes are shown for Ar+ (upper panel) and ArH+ (lower panel). |
Now assuming an atomic oxygen abundance of 3.9
× 10-4 relative to H nuclei, and assuming a solar argon
abundance of 3.2 ×
10-6 (Lodders 2010), we find that Eq. (1) may be rewritten as ![Mathematical equation: \begin{eqnarray} {n({\rm ArH}^+) \over n_{\rm H}} = {1.2 \times 10^{-10} \zeta_{\rm p} ({\rm H})_{-16} \over n_2[1+1280 f({\rm H}_2)] + 0.35 \chi_{\rm UV} \times f_A}\label{eq2} \end{eqnarray}](/articles/aa/full_html/2014/06/aa23727-14/aa23727-14-eq108.png) (2)where
n2 =
nH/ 100 cm-3,
ζp(H)-16 = ζp(H)
/ 10-16 s-1, f(H2) =
2n(H2)
/nH is the molecular
fraction, and fA is the factor by
which the photodissociation rate for ArH+ is reduced by attenuation. For the isotropic
illumination that we assume, fA = [
E2(3.6 AV) +
E2(3.6 [
AV(tot) −
AV ] ) ] /
2, where E2 is an exponential integral; for the
AV(tot) = 0.3 mag
model, fA varies from 0.56
at the cloud surface to 0.30 at the cloud center. Figure 10 shows the Ar+ and ArH+ abundances as a function of the molecular fraction. For
molecular fractions in excess of ~10-4, Eq. (2) reproduces the exact behavior to within 15%.
(2)where
n2 =
nH/ 100 cm-3,
ζp(H)-16 = ζp(H)
/ 10-16 s-1, f(H2) =
2n(H2)
/nH is the molecular
fraction, and fA is the factor by
which the photodissociation rate for ArH+ is reduced by attenuation. For the isotropic
illumination that we assume, fA = [
E2(3.6 AV) +
E2(3.6 [
AV(tot) −
AV ] ) ] /
2, where E2 is an exponential integral; for the
AV(tot) = 0.3 mag
model, fA varies from 0.56
at the cloud surface to 0.30 at the cloud center. Figure 10 shows the Ar+ and ArH+ abundances as a function of the molecular fraction. For
molecular fractions in excess of ~10-4, Eq. (2) reproduces the exact behavior to within 15%.
While astrochemical models predict molecular abundance ratios as a function of position within a gas cloud, astronomical observations measure column density ratios averaged along the line-of-sight. Accordingly, we have calculated the column-averaged ArH+ abundance, N(ArH+) /NH, for a series of models with different assumed AV(tot). In the upper and middle panels of Fig. 11, we plot the N(ArH+) /NH ratio and the average molecular fraction, 2N(H2) /NH, as a function of AV(tot), while in the lower panel we show the column-averaged ArH+ abundance as a function of molecular fraction. Given the cosmic ray ionization rate ζp(H) = 2 × 10-16 s-1 and the gas density nH = 50 cm-3 assumed in our standard model, peak N(ArH+) /NH ratios ~2 × 10⁻¹⁰ are achieved within small clouds of total visual extinction ≲0.01 mag, within which the average molecular fraction is ≲10-3. The predicted peak abundances scale linearly with the assumed cosmic ray ionization rate and, for weak UV fields, inversely with the density. For UV fields higher than χUV = n2 [ 1 + 1200f(H2) ] / (0.35fA), i.e., for χUV ≈ 10n2, photodissociation is the dominant process.
For the standard cosmic ray ionization rates assumed in our diffuse cloud models, the peak ArH+ abundances, predicted to be ≈2 × 10⁻¹⁰ relative to H, fall near the lower end of the observed range reported in Sect. 4. Higher observed abundances may indicate local enhancements in the cosmic ray ionization rate. Along the sight–line to Sgr B2 (M), the observed ArH+/H ratio is largest for velocities corresponding to X2 orbits in the Galactic Center: these are indeed exactly the cloud velocities for which the largest cosmic ray ionization rate would be expected.
The diffuse cloud models presented in Sect. 5.2 provide a natural explanation for why ArH+ is present in the diffuse arm and interarm gas, but absent in the denser gas associated with the background continuum sources: owing to its rapid destruction by H2, the predicted ArH+ abundance falls rapidly once the molecular fraction exceeds ≈10-3. Thus, both theory and observation suggest that argonium is the molecule that paradoxically abhors molecular clouds.
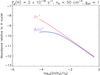 |
Fig. 10 Same as Fig. 8, except with the Ar+ and ArH+ abundances shown as a function of molecular fraction. |
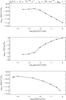 |
Fig. 11 Column-averaged ArH+ abundance, N(ArH+) /NH (top panel), and average molecular fraction, 2N(H2) /NH, as a function of AV(tot). Bottom panel: column-averaged ArH+ abundance versus average molecular fraction, 2N(H2) /NH. |
We have also run Turbulent Dissipation Region (TDR; Godard et al. 2009) models, but have found that they predict no significant
enhancement of ArH+. This is not surprising, since the only endothermic
production rate in Table 2, the reaction of
H
with Ar, is only important in regions of large molecular fraction, where
ArH+ is rapidly
removed. Although we did not find the elevated temperatures due to enhanced viscous
dissipation and ion-neutral friction in regions of intermittent turbulent dissipation to
be important in driving endothermic reactions of relevance to the production of
ArH+, these
regions are possible sites of cosmic ray acceleration because they are associated with
intense current sheets (Momferratos et al. 2014).
6. Summary
We confidently assign the 617.5 GHz line to the carrier 36ArH+, since features of 38ArH+ were also detected toward Sgr B2(M) and (N) with 36Ar/38Ar ratios close to, but probably smaller than in the solar neighborhood. The line surveys cover the frequency of the J = 1−0 transition of 20NeH+ and even though Ne is much more abundant in space than Ar, we do not observe neonium absorption. This difference is in line with expectations based on the much higher ionization potential of Ne.
Our chemical calculations show that ArH+ can exist only in low-density gas with a low H2 fraction (f(H2) ≈ 10-4−10-3), and a weak UV field, while an enhanced cosmic ray flux can boost its abundance. OH+ and H2O+ trace gas with a larger H2 fraction of 0.1, and are therefore complementary probes (Gerin et al. 2010; Neufeld et al. 2010; Hollenbach et al. 2012). It is noteworthy, in this context, that the ArH+ and H2O+ column densities are not well-correlated, although one would assume that ArH+ and H2O+ both trace the stratified PDR structures of diffuse clouds, ArH+ the very outer edge, and H2O+ gas deeper in. It appears that this picture is too simplistic. The aforementioned tracers OH+ and H2O+ trace partly molecular gas, while the so-called CO-dark gas, which is predominantly molecular, but does not contain significant abundances of CO, is best traced by HF, CH, H2O, or HCO+ (Qin et al. 2010; Sonnentrucker et al. 2010; Flagey et al. 2013), but also by [Cii] (Langer et al. 2014), which however is not very specific to this component. The careful analysis of column density variations in these tracers promises to disentangle the distribution of the H2 fraction, providing a direct observational probe on the poorly known transition of primarily atomic diffuse gas to dense molecular gas traced by CO emission, putting strong constraints upon magnetohydrodynamical simulations for the interstellar gas (e.g. Micic et al. 2012; Levrier et al. 2012) and thus potentially evolving into a tool to characterize the ISM. Paradoxically, ArH+ actually is a better tracer of almost purely atomic gas than the Hi line, because with the column density of H we see gas that could be 0.1%, 1%, or 50% molecular, while ArH+ singles out gas which is more than 99.9% atomic.
However, the possibilities of getting more data are limited. While both the 909 GHz OH+ line and the 607 GHz para-H2O+ line can be observed under very good weather conditions from very good sites on the ground (see, e.g. Wyrowski et al. 2010), ArH+, due to its proximity to the 620.7 GHz water line, is extremely difficult even from excellent sites. Receivers covering these frequencies with SOFIA would therefore be highly beneficial. The other possibility to get access to these species are toward redshifted galaxies. There, however, OH+ and H2O+ are often seen in emission, indicating very different excitation conditions. ArH+ has not been found in extragalactic sources yet, but could be a very good tracer of cosmic rays in diffuse gas with little UV penetration.
Herschel OBSIDs: 1342191565.
Herschel OBSIDs: 1342206364.
Acknowledgments
HIFI has been designed and built by a consortium of institutes and university departments from across Europe, Canada and the United States under the leadership of SRON Netherlands Institute for Space Research, Groningen, The Netherlands and with major contributions from Germany, France and the US. Consortium members are: Canada: CSA, U.Waterloo; France: CESR, LAB, LERMA, IRAM; Germany: KOSMA, MPIfR, MPS; Ireland, NUI Maynooth; Italy: ASI, IFSI-INAF, Osservatorio Astrofisico di Arcetri- INAF; Netherlands: SRON, TUD; Poland: CAMK, CBK; Spain: Observatorio Astronomico Nacional (IGN), Centro de Astrobiologia (CSIC-INTA). Sweden: Chalmers University of Technology – MC2, RSS & GARD; Onsala Space Observatory; Swedish National Space Board, Stockholm University – Stockholm Observatory; Switzerland: ETH Zurich, FHNW; USA: Caltech, JPL, NHSC. H.S.P.M. is very grateful to the Bundesministerium für Bildung und Forschung (BMBF) for initial support through project FKZ 50OF0901 (ICC HIFI Herschel) aimed at maintaining the Cologne Database for Molecular Spectroscopy, CDMS. This support has been administered by the Deutsches Zentrum für Luft- und Raumfahrt (DLR). Part of this work was supported by the German Deutsche Forschungsgemeinschaft in the Collaborative Research Center SFB956, and by the German Ministry of Science (BMBF) trough contract 05A11PK3. This work also has been supported by NASA through an award issued by JPL/Caltech. We thank Christian Endres for tireless work on the molecular line catalog implementation.
References
- Alekseyev, A. B., Liebermann, H.-P., & Buenker, R. J. 2007, Phys. Chem. Chem. Phys., 9, 5088 [Google Scholar]
- Barlow, M. J., Swinyard, B. M., Owen, P. J., et al. 2013, Science, 342, 1343 [NASA ADS] [CrossRef] [PubMed] [Google Scholar]
- Bedford, D. K., & Smith, D. 1990, Intl. J. Mass Spectrom. Ion Process., 98, 179 [NASA ADS] [CrossRef] [Google Scholar]
- Bergin, E. A., Phillips, T. G., Comito, C., et al. 2010, A&A, 521, L20 [NASA ADS] [CrossRef] [EDP Sciences] [Google Scholar]
- Berglund, M., & Wieser, M. E. 2011, Pure Appl. Chem., 83, 397 [CrossRef] [Google Scholar]
- Bowman, W. C., Plummer, G. M., Herbst, E., & de Lucia, F. C. 1983, J. Chem. Phys., 79, 2093 [NASA ADS] [CrossRef] [Google Scholar]
- Brault, J. W., & Davis, S. P. 1982, Phys. Scr., 25, 268 [NASA ADS] [CrossRef] [Google Scholar]
- Brown, J. M., Jennings, D. A., Vanek, M., Zink, L. R., & Evenson, K. M. 1988, J. Mol. Spectrosc., 128, 587 [Google Scholar]
- Cameron, R. M. 1976, Sky Telesc., 52, 327 [NASA ADS] [Google Scholar]
- Civiš, S., Šebera, J., Špirko, V., et al. 2004, J. Mol. Struct., 695, 5 [NASA ADS] [CrossRef] [Google Scholar]
- Cheng, M., Brown, J. M., Rosmus, P., et al. 2007, Phys. Rev. A, 75, 012502 [NASA ADS] [CrossRef] [Google Scholar]
- Chin, Y.-N., Henkel, C., Whiteoak, J. B., Langer, N., & Churchwell, E. B. 1996, A&A, 305, 960 [NASA ADS] [Google Scholar]
- Comito, C., & Schilke, P. 2002, A&A, 395, 357 [NASA ADS] [CrossRef] [EDP Sciences] [Google Scholar]
- Cueto, M., Cernicharo, J., Barlow, M. J., et al. 2014, ApJ, 783, L5 [NASA ADS] [CrossRef] [Google Scholar]
- Dalgarno, A., Yan, M., & Liu, W. 1999, ApJS, 125, 237 [NASA ADS] [CrossRef] [Google Scholar]
- de Graauw, T., Helmich, F. P., Phillips, T. G., et al. 2010, A&A, 518, L6 [NASA ADS] [CrossRef] [EDP Sciences] [Google Scholar]
- De Luca, M., Gupta, H., Neufeld, D., et al. 2012, ApJ, 751, L37 [NASA ADS] [CrossRef] [Google Scholar]
- Dore, L., Bizzocchi, L., & Degli Esposti, C. 2012, A&A, 544, A19 [NASA ADS] [CrossRef] [EDP Sciences] [Google Scholar]
- Draine, B. T. 1978, ApJS, 36, 595 [NASA ADS] [CrossRef] [Google Scholar]
- Filgueira, R. R., & Blom, C. E. 1988, J. Mol. Spectrosc., 127, 279 [Google Scholar]
- Flagey, N., Goldsmith, P. F., Lis, D. C., et al. 2013, ApJ, 762, 11 [NASA ADS] [CrossRef] [Google Scholar]
- Gerin, M., de Luca, M., Black, J., et al. 2010, A&A, 518, L110 [NASA ADS] [CrossRef] [EDP Sciences] [Google Scholar]
- Godard, B., Falgarone, E., & Pineau Des Forêts, G. 2009, A&A, 495, 847 [NASA ADS] [CrossRef] [EDP Sciences] [Google Scholar]
- Godard, B., Falgarone, E., Gerin, M., et al. 2012, A&A, 540, A87 [NASA ADS] [CrossRef] [EDP Sciences] [Google Scholar]
- González-Alfonso, E., Fischer, J., Bruderer, S., et al. 2013, A&A, 550, A25 [NASA ADS] [CrossRef] [EDP Sciences] [Google Scholar]
- Güsten, R., Nyman, L. Å., Schilke, P., et al. 2006, A&A, 454, L13 [NASA ADS] [CrossRef] [EDP Sciences] [Google Scholar]
- Heyminck, S., Graf, U. U., Güsten, R., et al. 2012, A&A, 542, L1 [NASA ADS] [CrossRef] [EDP Sciences] [Google Scholar]
- Hollenbach, D., Kaufman, M. J., Neufeld, D., et al. 2012, ApJ, 754, 105 [NASA ADS] [CrossRef] [Google Scholar]
- Hunter, E. P. L., & Lias, S. G. 1998, J. Phys. Chem. Ref. Data, 27, 413 [NASA ADS] [CrossRef] [Google Scholar]
- Ilyushin, V. V., Alekseev, E. A., Dyubko, S. F., Motiyenko, R. A., & Hougen, J. T. 2005, J. Mol. Spectrosc., 229, 170 [NASA ADS] [CrossRef] [Google Scholar]
- Indriolo, N., & McCall, B. J. 2012, ApJ, 745, 91 [NASA ADS] [CrossRef] [Google Scholar]
- Indriolo, N., Neufeld, D. A., Gerin, M., et al. 2012, ApJ, 758, 83 [NASA ADS] [CrossRef] [Google Scholar]
- Jenkins, E. B. 2013, ApJ, 764, 25 [NASA ADS] [CrossRef] [Google Scholar]
- Johns, J. W. C. 1984, J. Mol. Spectrosc., 106, 124 [Google Scholar]
- Kessler, M. F., Steinz, J. A., Anderegg, M. E., et al. 1996, A&A, 315, L27 [NASA ADS] [Google Scholar]
- Kingston, A. E. 1965, Proc. Phys. Soc., 86, 467 [NASA ADS] [CrossRef] [Google Scholar]
- Krabbe, A., Mehlert, D., Röser, H.-P., & Scorza, C. 2013, Eur. J. Phys., 34, 161 [CrossRef] [Google Scholar]
- Langer, W. D., Velusamy, T., Pineda, J. L., Willacy, K., & Goldsmith, P. F. 2014, A&A, 561, A122 [NASA ADS] [CrossRef] [EDP Sciences] [Google Scholar]
- Levrier, F., Le Petit, F., Hennebelle, P., et al. 2012, A&A, 544, A22 [NASA ADS] [CrossRef] [EDP Sciences] [Google Scholar]
- Lis, D. C., Pearson, J. C., Neufeld, D. A., et al. 2010, A&A, 521, L9 [NASA ADS] [CrossRef] [EDP Sciences] [Google Scholar]
- Lis, D. C., Schilke, P., Bergin, E. A., et al. 2014, ApJ, 785, 135 [NASA ADS] [CrossRef] [Google Scholar]
- Liszt, H. 2003, A&A, 398, 621 [NASA ADS] [CrossRef] [EDP Sciences] [Google Scholar]
- Liu, D.-J., Ho, W.-C., & Oka, T. 1987, J. Chem. Phys., 87, 2442 [NASA ADS] [CrossRef] [Google Scholar]
- Matsushima, F., Ohtaki, Y., Torige, O., & Takagi, K. 1998, J. Chem. Phys., 109, 2242 [NASA ADS] [CrossRef] [Google Scholar]
- McCall, B. J., Geballe, T. R., Hinkle, K. H., & Oka, T. 1998, Science, 279, 1910 [NASA ADS] [CrossRef] [PubMed] [Google Scholar]
- Menten, K. M., Wyrowski, F., Belloche, A., et al. 2011, A&A, 525, A77 [NASA ADS] [CrossRef] [EDP Sciences] [Google Scholar]
- Micic, M., Glover, S. C. O., Federrath, C., & Klessen, R. S. 2012, MNRAS, 421, 2531 [NASA ADS] [CrossRef] [Google Scholar]
- Mitchell, J. B. A., Novotny, O., Angelova, G., et al. 2005a, J. Phys. B At. Mol. Phys., 38, 693 [NASA ADS] [CrossRef] [Google Scholar]
- Mitchell, J. B. A., Novotny, O., LeGarrec, J. L., et al. 2005b, J. Phys. B At. Mol. Phys., 38, L175 [NASA ADS] [CrossRef] [Google Scholar]
- Möller, T., Bernst, I., Panoglou, D., et al. 2013, A&A, 549, A21 [NASA ADS] [CrossRef] [EDP Sciences] [Google Scholar]
- Momferratos G., Lesaffre, P., Falgarone E., & Pineau des Forêts, G. 2014, MNRAS, in press [Google Scholar]
- Müller, H. S. P., Thorwirth, S., Roth, D. A., & Winnewisser, G. 2001, A&A, 370, L49 [NASA ADS] [CrossRef] [EDP Sciences] [Google Scholar]
- Müller, H. S. P., Schlöder, F., Stutzki, J., & Winnewisser, G. 2005, J. Mol. Struct., 742, 215 [NASA ADS] [CrossRef] [Google Scholar]
- Müller, H. S. P. , Schilke, P., & Gerin, M., et al. 2013, The Diffuse Interstellar Bands, Proc. IAU Symp., 297 [Google Scholar]
- Neill, J. L., Bergin, E. A., Lis, D. C., et al. 2012, J. Mol. Spectrosc., 280, 150 [NASA ADS] [CrossRef] [Google Scholar]
- Neufeld, D. A., & Wolfire, M. G. 2009, ApJ, 706, 1594 (NW09) [NASA ADS] [CrossRef] [Google Scholar]
- Neufeld, D. A., Goicoechea, J. R., Sonnentrucker, P., et al. 2010, A&A, 521, L10 [NASA ADS] [CrossRef] [EDP Sciences] [Google Scholar]
- Neufeld, D. A., Falgarone, E., Gerin, M., et al. 2012, A&A, 542, L6 [NASA ADS] [CrossRef] [EDP Sciences] [Google Scholar]
- Odashima, H., Kozato, A., Matsushima, F., Tsunekawa, S., & Takagi, K. 1999, J. Mol. Spectrosc., 195, 356 [Google Scholar]
- Ossenkopf, V., Müller, H. S. P., Lis, D. C., et al. 2010, A&A, 518, L111 [NASA ADS] [CrossRef] [EDP Sciences] [Google Scholar]
- Phillips, T. G. 1990, Liege International Astrophysical Colloquia, 29, 291 [NASA ADS] [Google Scholar]
- Pickett, H. M., Poynter, R. L., Cohen, E. A., et al. 1998, J. Quant. Spectrosc. Rad. Transf., 60, 883 [Google Scholar]
- Pilbratt, G. L., Riedinger, J. R., Passvogel, T., et al. 2010, A&A, 518, L1 [CrossRef] [EDP Sciences] [Google Scholar]
- Qin, S.-L., Schilke, P., Comito, C., et al. 2010, A&A, 521, L14 [NASA ADS] [CrossRef] [EDP Sciences] [Google Scholar]
- Ram, R. S., Bernath, P. F., & Brault, J. W. 1985, J. Mol. Spectrosc., 113, 451 [NASA ADS] [CrossRef] [Google Scholar]
- Rebrion, C., Rowe, B. R., & Marquette, J. B. 1989, J. Chem. Phys., 91, 6142 [NASA ADS] [CrossRef] [Google Scholar]
- Reid, M. J., Menten, K. M., Zheng, X. W., et al. 2009, ApJ, 700, 137 [NASA ADS] [CrossRef] [Google Scholar]
- Rodriguez-Fernandez, N. J., & Combes, F. 2008, A&A, 489, 115 [NASA ADS] [CrossRef] [EDP Sciences] [Google Scholar]
- Roelfsema, P. R., Helmich, F. P., Teyssier, D., et al. 2012, A&A, 537, A17 [NASA ADS] [CrossRef] [EDP Sciences] [Google Scholar]
- Roueff, E., Alekseyev, A. B., & Le Bourlot, J. 2014, A&A, 566, A30 [NASA ADS] [CrossRef] [EDP Sciences] [Google Scholar]
- Sawada, T., Hasegawa, T., Sugimoto, M., Koda, J., & Handa, T. 2012a, ApJ, 752, 118 [NASA ADS] [CrossRef] [Google Scholar]
- Sawada, T., Hasegawa, T., & Koda, J. 2012b, ApJ, 759, L26 [NASA ADS] [CrossRef] [Google Scholar]
- Schilke, P., HEXOS Team 2010, in Proc. Herschel First Results Symp., http://herschel.esac.esa.int/FirstResultsSymposium/presentations/A34_SchilkeP_ SgrB2.pdf [Google Scholar]
- Schilke, P., Lis, D. C., Bergin, E. A., Higgins, R., & Comito, C. 2013, J. Phys. Chem. A, 117, 9766 [CrossRef] [PubMed] [Google Scholar]
- Sonnentrucker, P., Neufeld, D. A., Phillips, T. G., et al. 2010, A&A, 521, L12 [NASA ADS] [CrossRef] [EDP Sciences] [Google Scholar]
- Shull, J. M., & van Steenberg, M. 1982, ApJS, 48, 95 [NASA ADS] [CrossRef] [Google Scholar]
- Takagi, H. 2004, Phys. Rev. A, 70, 022709 [Google Scholar]
- Vallée, J. P. 2008, AJ, 135, 1301 [NASA ADS] [CrossRef] [Google Scholar]
- van der Werf, P. P., Isaak, K. G., Meijerink, R., et al. 2010, A&A, 518, L42 [NASA ADS] [CrossRef] [EDP Sciences] [Google Scholar]
- Villinger, H., Futrell, J. H., Howorka, F., Duric, N., & Lindinger, W. 1982, J. Chem. Phys., 76, 3529 [NASA ADS] [CrossRef] [Google Scholar]
- Weiß, A., Requena-Torres, M. A., Güsten, R., et al. 2010, A&A, 521, L1 [NASA ADS] [CrossRef] [EDP Sciences] [Google Scholar]
- Wieler, R. 2002, Rev. Mineral. Geochim. 47, 21 [CrossRef] [Google Scholar]
- Wilson, T. L., & Rood, R. 1995, ARA&A, 32, 191 [Google Scholar]
- Wong, M., Bernath, P., & Amano, T. 1982, J. Chem. Phys., 77, 693 [NASA ADS] [CrossRef] [Google Scholar]
- Woosley, S. E., Heger, A., & Weaver, T. A. 2002, Rev. Mod. Phys., 74, 1015 [NASA ADS] [CrossRef] [Google Scholar]
- Wyrowski, F., Menten, K. M., Güsten, R., & Belloche, A. 2010, A&A, 518, A26 [NASA ADS] [CrossRef] [EDP Sciences] [Google Scholar]
- Young, E. T., Becklin, E. E., Marcum, P. M., et al. 2012, ApJ, 749, L17 [NASA ADS] [CrossRef] [Google Scholar]
All Tables
All Figures
|
Fig. 1 Spectrum of 36ArH+(1–0) toward SgrB2(M), with fit including the H2CNH line blending at –110 km s-1 (see Fig. 3) as a dashed red line, and fit of 36ArH+ only in red.Note the lack of absorption at the source velocity 64 km s-1, indicated by the vertical orange marker. |
| In the text | |
|
Fig. 2 Spectra with predictions for 36ArH+ and 38ArH+ (top) and zoom in to 38ArH+ (bottom). The 38ArH+ spectrum is scaled from 36ArH+ assuming as 36Ar/38Ar ratiothe solar system value of 5.6. |
| In the text | |
|
Fig. 3 The H2CNH(22,0 − 11,1) line with fit (top) and the two H2CNH lines (bottom). |
| In the text | |
|
Fig. 4 Column density per km s-1 of HF, H2O+, ArH+, and H, in descending order of f(H2) traced by the species. The color coding of the frequencies is explained in Table 1. The error estimate for ArH+ was done using the MAGIX Interval Nested Sampling algorithm (Möller et al. 2013), which implements a Markov chain Monte Carlo (MCMC) method to calculate the Bayesian evidence and Bayesian confidence interval. Hi column density errors were calculated by propagating uncertainties from the input emission and absorption spectra using a Monte-Carlo sampling technique. For the other species, a ±20% error of the column densities was assumed. The uncertainty is marked by the blue shading around the curves. |
| In the text | |
|
Fig. 5 Fit of SgrB2(N). The H2CNH(22,0 − 11,1) lines (here with the additional 80 km s-1 component) has been taken out the same way as for SgrB2(M). There has been no correction for emission lines from the background source, which most likely distort the absorption profile. |
| In the text | |
|
Fig. 6 Observations of OH+, H2O+, and ArH+ toward PRISMAS sources. The green lines for OH+ and H2O+, whose transitions have hyperfine structure, give the deconvolved strength of the main hyperfine component.The red lines are fits to the ArH+ spectra used in calculating the column densities presented in Fig. 7. Note that ArH+ spectra have been scaled up to more clearly show the absorption profiles. Vertical dashed lines and gray shaded regions mark the systemic velocity and velocity dispersion observed for background sources. All OH+ and H2O+ spectra in these sight lines will be presented and analyzed in detail by Indriolo et al. (in prep.). Analyses of OH+ and H2O+ that only utilized a subset of the eventual data have been performed for W31C (Gerin et al. 2010), W49N (Neufeld et al. 2010), and W51 (Wyrowski et al. 2010; Indriolo et al. 2012). |
| In the text | |
|
Fig. 7 Column density per km s-1 of ArH+ and H and abundance of ArH+ relative to H toward the PRISMAS sources. The H column densities come from Winkel et al. (in prep.). The uncertainty is marked by the blue shading around the curves. |
| In the text | |
|
Fig. 8 Abundances of Ar+ and ArH+ as function of AV (upper panel) and f(H2) (lower panel). The elemental abundance of Ar is 3.2 × 10⁻⁶, so most of the Argon is still neutral. |
| In the text | |
|
Fig. 9 Rates of formation (dashed lines) and destruction (solid lines) by various processes are shown for Ar+ (upper panel) and ArH+ (lower panel). |
| In the text | |
|
Fig. 10 Same as Fig. 8, except with the Ar+ and ArH+ abundances shown as a function of molecular fraction. |
| In the text | |
|
Fig. 11 Column-averaged ArH+ abundance, N(ArH+) /NH (top panel), and average molecular fraction, 2N(H2) /NH, as a function of AV(tot). Bottom panel: column-averaged ArH+ abundance versus average molecular fraction, 2N(H2) /NH. |
| In the text | |
Current usage metrics show cumulative count of Article Views (full-text article views including HTML views, PDF and ePub downloads, according to the available data) and Abstracts Views on Vision4Press platform.
Data correspond to usage on the plateform after 2015. The current usage metrics is available 48-96 hours after online publication and is updated daily on week days.
Initial download of the metrics may take a while.