Fig. 4
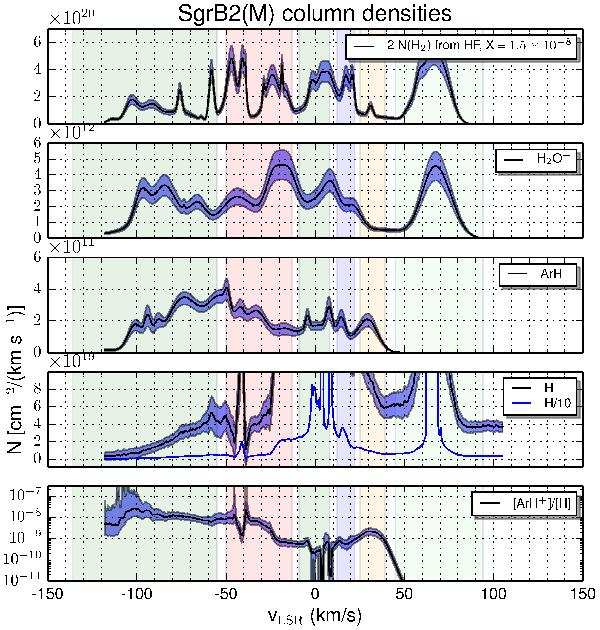
Column density per km s-1 of HF, H2O+, ArH+, and H, in descending order of f(H2) traced by the species. The color coding of the frequencies is explained in Table 1. The error estimate for ArH+ was done using the MAGIX Interval Nested Sampling algorithm (Möller et al. 2013), which implements a Markov chain Monte Carlo (MCMC) method to calculate the Bayesian evidence and Bayesian confidence interval. Hi column density errors were calculated by propagating uncertainties from the input emission and absorption spectra using a Monte-Carlo sampling technique. For the other species, a ±20% error of the column densities was assumed. The uncertainty is marked by the blue shading around the curves.
Current usage metrics show cumulative count of Article Views (full-text article views including HTML views, PDF and ePub downloads, according to the available data) and Abstracts Views on Vision4Press platform.
Data correspond to usage on the plateform after 2015. The current usage metrics is available 48-96 hours after online publication and is updated daily on week days.
Initial download of the metrics may take a while.