| Issue |
A&A
Volume 692, December 2024
|
|
|---|---|---|
| Article Number | A264 | |
| Number of page(s) | 15 | |
| Section | Interstellar and circumstellar matter | |
| DOI | https://doi.org/10.1051/0004-6361/202348445 | |
| Published online | 18 December 2024 | |
Fate and detectability of rare gas hydride ions in nova ejecta
A case study with nova templates
1
Univ. Grenoble Alpes, CNRS, IPAG,
38000
Grenoble,
France
2
Univ Rennes, CNRS, IPR (Institut de Physique de Rennes) – UMR 6251,
35000
Rennes,
France
3
S. N. Bose National Centre for Basic Sciences,
Block-JD, Sector-III, Salt Lake,
Kolkata
700106,
India
4
Institute of Astronomy Space and Earth Science,
P177 CIT Road, Scheme 7m,
Kolkata
700054,
India
5
Astronomy & Astrophysics Division, Physical Research Laboratory,
Ahmedabad
380009,
Gujarat,
India
6
Max-Planck-Institut für Radioastronomie,
Auf dem Hügel 69,
53121
Bonn,
Germany
7
Max-Planck-Institute for extraterrestrial Physics,
PO Box 1312
85741
Garching,
Germany
★ Corresponding author; This email address is being protected from spambots. You need JavaScript enabled to view it.
Received:
31
October
2023
Accepted:
8
November
2024
Abstract
HeH+ was the first heteronuclear molecule to form in the metal-free Universe after the Big Bang. The molecule gained significant attention following its first circumstellar detection in the young and dense planetary nebula NGC 7027. We target some hydride ions associated with the noble gases (HeH+, ArH+, and NeH+) to investigate their formation in harsh environments like the nova outburst region. We use a photoionization modeling (based on previously published best-fit physical parameters) of the moderately fast ONe type nova, QU Vulpeculae 1984, and the CO type novae, RS Ophiuchi and V1716 Scorpii. Our steady-state modeling reveals a convincing amount of HeH+, especially in the dense clump of RS Ophiuchi and V1716 Scorpii. The calculated upper limit on the surface brightness of HeH+ transitions suggests that the James Webb Space Telescope (JWST) could detect some of them, particularly in sources like RS Ophiuchi and V1716 Scorpii, which have similar physical and chemical conditions and evolution. It must be clearly noted that the sources studied are used as templates, and not as targets for observations. The detection of these lines could be useful for determining the physical conditions in similar types of systems and for validating our predictions based on new electron-impact ro-vibrational collisional data at temperatures of up to 20 000 K.
Key words: astrochemistry / molecular data / radiative transfer / novae, cataclysmic variables / ISM: abundances / ISM: molecules
© The Authors 2024
 Open Access article, published by EDP Sciences, under the terms of the Creative Commons Attribution License (https://creativecommons.org/licenses/by/4.0), which permits unrestricted use, distribution, and reproduction in any medium, provided the original work is properly cited.
This article is published in open access under the Subscribe to Open model. This email address is being protected from spambots. You need JavaScript enabled to view it. to support open access publication.
1 Introduction
Classical novae (CNe) are catastrophic events that occur on the surface of a white dwarf (WD) that accretes hydrogen-rich matter from a companion star, typically a main sequence star or a red giant star. The WD is generally a carbon-oxygen (CO) or oxygen-neon (ONe) type, whereas the secondary generally is a K or M main sequence star (José 2012). The outburst occurs due to thermonuclear runaway (TNR) on the WD surface when the accreted material reaches a critical temperature and pressure. The explosion releases a significant amount of energy (∼1040–1045 erg s–1) and ejects a shell with a material mass of ∼10–6–10–4 M⊙ (Gehrz et al. 1998) with velocities ranging from several hundred to ≥1000 km s–1 (Bode & Evans 2008, and references therein). Sometime after the explosion, the accretion process begins, and the system prepares for the next outburst. The outburst ejects matter into the surrounding area without disrupting the WD while continuing accretion for subsequent outburst periods ranging from tens to hundreds of years. Under specific conditions, such as those related to certain properties of the WD and the accretion process, these outbursts occur on timescales ranging from years to decades, indicating an accelerated rate of mass transfer within the binary system. This categorizes them as recurrent novae (RNe). Symbiotic novae (SymNe) represent a subclass of RNe characterized by systems with significant orbital separations and a companion red giant star (Starrfield et al. 2020).
Following an outburst, a small fraction of observed novae have been found to form dust and molecules inside the ejecta. The first observed molecule is CN, which was detected in the optical spectrum of nova DQ Her (1934) by Wilson & Merrill (1935) shortly after the eruption. At much later epochs, the 2.122 µm transition of H2 was detected in the DQ Her remnant (Evans 1991). Ferland et al. (1979) identified the most commonly detected emission features of CO at 4.8 µm (fundamental bands) and 2.3 µm (first overtone bands) in NQ Vul 1976. Rawlings (1988) deduced a CO column density of 1017–1018 cm–2 (corresponding to 1–10% of all available carbon in the ejecta being locked up in CO), indicating the high CO formation efficiency for NQ Vul. Subsequently, the first-overtone CO emission was observed in many novae; for example V842 Cen (Nova Cen 1986; Hyland & McGregor 1989; Wichmann et al. 1990), Cas 1993 (V705 Cas; Evans et al. 1996), V2274 Cyg (Rudy et al. 2003), and V2615 Oph (Das et al. 2009). Apart from CO, in a mid-infrared spectroscopic survey of novae, Smith et al. (1995) tentatively identified the υ = 2–1 transition of SiO in V992 Sco (1992) at an excitation temperature of 1500 K. An Al-bearing molecule, AlO, was tentatively identified in the spectrum of GK Per (1901; Bianchini et al. 1986) and RS Car (1895; Bianchini et al. 2001). The transient absorption bands of both C2 and CN were detected in the optical wavelength around the visual brightness maximum of the CNe V2676 Oph (Kawakita et al. 2015) and V1391 Cas (Fujii et al. 2021).
Despite significant research over decades, dust formation in nova ejecta has remained an enigma (Rawlings 1988; Rawlings & Williams 1989; Shore et al. 1994; Pontefract & Rawlings 2004; Shore & Gehrz 2004; Shore et al. 2018, and references therein). Recent studies have proposed the idea of “internal shocks” occurring within the nova ejecta. These shocks provide favorable circumstances for the creation of dust in the ejecta. The cooling efficiency of the gas in the shock zones causes an increase in the ejecta density, creating clumps of cold, neutral, and dense gas. These dense regions are well protected from the intense radiation emitted by the central ionizing WD (see, e.g., Chomiuk et al. 2014; Metzger et al. 2014, and references therein). Derdzinski et al. (2017) proposed a dust-shock model in which the powerful radiative shocks within the nova ejecta create very dense and cool layers of gas behind these shocks, providing favorable conditions for the formation of dust nucleation sites. Nova V2891 Cyg provided most likely the first observational evidence of such shock-induced dust formation within nova ejecta (Kumar et al. 2022; Pandey et al. 2024). In a recent study, Banerjee et al. (2023) detected CO and dust in the recurrent nova V745 Sco about 8.7 days after its 2014 outburst. In the ejecta of a recurrent nova, this is the first detection of molecules or dust, which have probably formed in a cool, dense, and clumpy region between the forward and reverse shocks.
In the present work, we investigate the possibility of the formation of the noble gas hydrides (ArH+, NeH+, and HeH+) in the outburst of two different types of novae, namely CO type and ONe type, and discuss the future detection of these hydrides in similar types of nova ejecta with a space-based telescope such as the James Webb Space Telescope (JWST). Hydrides are the first molecules to form in any astrophysical environment, as hydrogen is the most abundant species. Noble gas hydrides have already been observed in different radiation-dominated regions such as the Crab nebula (ArH+; Barlow et al. 2013) and the NGC 7027 planetary nebula (HeH+; Güsten et al. 2019; Neufeld et al. 2020). Recently, Das et al. (2020) studied the chemistry of noble gas hydride and hydroxyl cations in the Crab filamentary region and found a favorable parameter space (hydrogen number density of ~104–6 cm–3 and a cosmic-ray ionization rate per H2 of ∼10–11–10–10 s–1) to explain the observed features.
For the present study, we selected three different novae from the literature that have been investigated using photoionization modeling: QU Vulpeculae 1984 (hereafter, QU Vul), RS Ophiuchi (hereafter, RS Oph), and V1716 Scorpii (hereafter, V1716 Sco). It should be noted that these sources did not exhibit dust formation following an outburst. Other well-studied dustforming CNe, such as V705 Cas, V723 Cas, and V5668 Sgr, might be more appropriate for studying molecule formation due to their unique characteristic of forming dust post-outburst (Gehrz et al. 2018; Shore et al. 2018). However, modeling the formation of noble gas hydrides in these sources is beyond the scope of this study because photoionization model studies are not available for them in the literature. In our study, we focus on those novae whose best-fit photoionization model parameters are present in the literature, as we adopt these published results as preliminary parameters for our modeling.
QU Vul is a moderately fast nova with a ONeMg WD (Livio & Truran 1994) that has a mass of ∼0.82–0.96 M⊙ (Hachisu & Kato 2016). QU Vul was discovered by Collins et al. (1984) and further confirmed spectroscopically by Rosino & Iijima (1987). Using multiwavelength spectroscopic data at various epochs during the nebular phase of outbursts, Schwarz (2002) estimated the best-fit elemental abundances in the ejecta of QU Vul.
RS Oph is a well-studied Galactic symbiotic RNe with an average recurrence timescale of about 15 years (Schaefer 2010; Pandey et al. 2022). RS Oph, which is a probable Type Ia supernova progenitor, has a massive CO-type WD with a mass range of 1.2–1.4 M⊙ (Mikołajewska & Shara 2017) and an evolved red giant companion with a mass of 0.68–0.80 M⊙ (Brandi et al. 2009). The RS Oph system is renowned for generating shock waves (Hjellming et al. 1986; Sokoloski et al. 2006). These shock waves occur when the material ejected from the WD of RS Oph interacts with the surrounding winds of its red giant companion. As a result, a shock wave travels through the red giant wind, causing the shock velocity to decrease gradually over time.
V1716 Sco, also known as PNV J17224490-4137160, was first discovered in outburst by A. Pearce1 on 2023 April 20.6780 UT at an unfiltered magnitude of 8.0. Walter & Pearce (2023) classified it as a Fe II-type CNe by examining the spectral evolution. The time it takes for the brightness of the object to decline by 2 magnitudes (t2) and 3 magnitudes (t3) from its maximum was estimated to be around 5.8 and 11.7 days, respectively, making it a fast nova (Woodward et al. 2024). The distance of the nova is estimated to be around D = 3.6 ± 0.6 kpc (Woodward et al. 2024). V1716 Sco was also observed in gamma-rays above 100 MeV by Fermi. The X-ray observations using swift revealed that the nova transitioned into a supersoft X-ray (SSS) phase around day 55 (Page & Kuin 2023).
We performed photoionization modeling (based on the earlier published best-fit physical parameters) to estimate the intensity of the noble gas hydrides in the spectra of the novae. We use new electron-impact ro-vibrational collisional data for HeH+ at temperatures of up to 20 000 K (see Appendix A), the reaction network prepared by Das et al. (2020) (see Table C.1) for this study, and the best-fit model parameters (see Table 1) estimated by Schwarz (2002) for QU Vul, Pandey et al. (2022) for RS Oph, and Woodward et al. (2024) for V1716 Sco. The paper is organized as follows. Section 2 describes the physical and chemical properties implemented in the photoionization model. Section 3 discusses the obtained modeling results for the three different novae. Finally, we provide concluding remarks in Sect. 4.
2 Physico-chemical conditions
To model the nova ejecta, we used the latest version of the photoionization code CLOUDY, v23.01 (Chatzikos et al. 2023, and references therein). CLOUDY is a spectral synthesis code that simulates physical conditions over a broad range of physical parameters (temperature, density, radiation field, etc.). Thermal and statistical equilibrium equations, charge, and energy conservation are simultaneously solved in CLOUDY (Osterbrock & Ferland 2006). The ionization level is calculated by balancing the most important ionization (photo, Auger, collisional ionization, and charge transfer) and recombination processes (low- temperature dielectronic, high-temperature dielectronic, three- body recombination, radiative, dissociative, and charge transfer). The free electrons are considered to belong to a predominantly Maxwellian velocity distribution. The kinetic temperature is determined by the balance between heating (mechanical, photoelectric, cosmic-ray, etc.) and cooling (mainly inelastic collisions between the electrons and other particles) processes. The associated continuum and line radiative transfer are solved simultaneously. The predicted flux of emission lines can be directly compared to the measured line fluxes of the observed spectra.
We consider a central ionizing source to have a blackbody (TBB > 104 K) surrounded by a spherically symmetric expanding shell located at a distance of rin (inner radius) away from the central source. The thickness of the shell is set by specifying an outer radius (rout). Following Bath & Shaviv (1976), the density in the ejecta is of the form
 (1)
(1)
where n(r) and n(H) = n(rin) represent the total hydrogen nuclei density (in all forms, e.g., neutral, ionized, molecular, and any other) of the ejecta at a distance r and inner radius (rin), respectively, and α is the power-law index. Assuming the surrounding gas to be clumpy, the clumpiness is considered by setting the radial-dependent filling factor, f (r) as,
 (2)
(2)
where β is the exponent of the power law. The filling factor describes the fraction of the volume occupied by the gas (i.e., clumpiness). The initial elemental abundances of the ejecta (only those that were observed) are noted in Table 1. At the same time, all other elements (without observed lines) are kept at their solar abundances (Grevesse & Noels 1993; Grevesse et al. 2010).
The best-fit physical parameters are taken from Schwarz (2002), Pandey et al. (2022), and Woodward et al. (2024) for QU Vul, RS Oph, and V1716 Sco, respectively (see Table 1). The chemical reaction network for HeH+, ArH+, and NeH+ (excluding the reaction pathways of the hydroxyl cations, i.e., ArOH+, NeOH+, and HeOH+) is adopted from Das et al. (2020), who considered the rate coefficients based on the available literature (Schilke et al. 2014; Priestley et al. 2017; Güsten et al. 2019; Neufeld et al. 2020) and databases (McElroy et al. 2013). Additionally, the recently measured temperature-dependent dissociative recombination (DR) rate coefficient of ArH+ (Kálosi et al. 2024) is included in our network. We note that Kálosi et al. (2024) provided a set of piecewise-joined fit functions on several temperature intervals because a single Arrhenius-Kooij fit function could not adequately model their experimental results. This approach introduces discontinuities in the temperature dependence of the analytical rate coefficient between the temperature intervals. We have chosen a specific temperature interval of 7000–20 000 K from their Table III that is suitable for the conditions in the nova ejecta regions. To run the CLOUDY code for the chemistry at temperatures ranging from 10 to 20 000 K, we ensured that the poor fit below 7000 K does not affect the analysis of the nova ejecta in the three sources we are studying. We assume the same temperature-dependent DR rate coefficient for NeH+ as that of ArH+. The detailed list of reactions and the corresponding rate coefficients adopted here (for HeH+, ArH+, and NeH+) are presented in Appendix C and discussed in detail in Das et al. (2020). All other species, including neutral atoms, molecules, and ions, and their corresponding reactions, are kept similar to the default settings in CLOUDY, v23.01. It is important to note that electronic recombination (ER) reactions of all the atomic ions, ionization by direct X-rays (ζXR), ionization by secondary photons from X-rays (ζXRPHOT), and electron-impact X-ray ionization (ζXRS EC) for all basic elements and atomic ions are self-consistently controlled in CLOUDY by default. We list them in Table C.1 for the sake of completeness.
The Galactic cosmic-ray background with a mean primary cosmic-ray ionization rate per hydrogen atom (ζH) of 2 × 10–16 s–1 (Indriolo et al. 2007) is considered for all the models. Cosmic-ray ionization rates of molecular hydrogen ( ) of 4.6 × 10⁻¹⁶ s–1 are self-consistently determined in CLOUDY following the approach and conversion factor given by Glassgold & Langer (1974). The present background radiation temperature is assumed to be 2.725 ± 0.002 K. Following Shaw et al. (2005), an extensive model of the H2 molecule is considered. Considering a closed spherical shell geometry, the chemistry and thermal balance at each depth are calculated self-consistently.
We consider the collisional data files for HeH+, 36ArH+, and NeH+ for calculating the surface brightness using CLOUDY, which are discussed in Sect. 3. The collisional data file for HeH+ is unavailable in the CLOUDY database, and therefore the collisional data file for HeH+ is considered from the Excitation of Molecules and Atoms for Astrophysics (EMAA) database2 (Hamilton et al. 2016; Desrousseaux & Lique 2020)3, which includes 12 rotational energy levels in the range J = 0–11 at ground vibrational level υ = 0. The collisional data file for HeH+ contains the collisional rates with two collision partners: electrons (12 temperatures in the range 10–3000 K) and atomic hydrogen (18 temperatures in the range 10–500 K). The temperature of the nova outburst region is much higher than the temperature range provided in the HeH+ data file. To have realistic collisional rates for the nova outburst region, the Coulomb-Born (CB) approximation (see Appendix A for detailed discussion) is used to compute the electron-impact ro- vibrational rate coefficients up to ~20 000 K, which are suitable for the nova outburst region. We extract the radiative rates from the EXOMOL database (Tennyson et al. 2016; Amaral et al. 2019) to prepare the spectroscopy part. The new data file includes 162 bound ro-vibrational energy levels, with the highest level being υ = 11, J = 1, which lies 14 873.7 cm–1 (about 21 400 K) above the ground level. Quasi-bound levels have large dissociation probabilities and were neglected. Only electrons are used as the colliding partner in this extended data file as the electron abundance is significantly larger than other collisional partners (e.g., H) – this is discussed below. We calculate the rates at 21 temperatures within the temperature range of 10–20 000 K. We consider 1282 radiative and 553 collisional (Δυ = 0, ∆ J = ±1, ±2 and Δυ = ±1, ∆ J = ±1) transitions in this file. This newly generated data file is used as default throughout this work, unless stated otherwise.
We replace the collisional data file for 36ArH+ (already available in the CLOUDY data/lamda directory considering the hydrogen atom as the only collision partner) with that available in the EMAA database4. This latter includes 12 rotation energy levels in the range J = 0-11 at ground vibrational level υ = 0 and contains the collisional rates with two collision partners: electrons (for 12 temperatures in between 10–3000 K; Hamilton et al. 2016) and atomic hydrogen (for 34 temperatures within the range of 10-1000 K; Dagdigian 2018). For NeH+, no collisional rates are available. Thus, we approximate the collisional rates of NeH+ by considering the collisional rates of 36ArH+ with electrons as the only colliding partners (for nine temperatures within the range of 5–3000 K; Hamilton et al. 2016). The collisional data file for NeH+ includes eight rotation energy levels in the range J = 0–7 at ground vibrational level υ = 0. There are 7 radiative and 28 collisional transitions. We note that due to the unavailability of high-temperature data for 36ArH+ and NeH+, some predictions may be inaccurate (see Appendix B).
CLOUDY physical model parameters and initial elemental abundance set for QU Vul epoch D550 (Schwarz 2002), RS Oph epoch D22 (Pandey et al. 2022), and V1716 Sco epoch D132.8 (Woodward et al. 2024).
3 Results and discussion
3.1 QU Vul
The epoch D550 for QU Vul is chosen here since it contains the greatest number of observed emission lines (Schwarz 2002). The D550 epoch considered the average optical line ratios for the days 530 and 560 along with the day 554 UV lines. The initial elemental abundances and physical parameters used for the model are listed in Table 1. These are the best-fit parameters obtained by Schwarz (2002). The obtained geometry is both spherical and closed.
Figure 1 depicts the density and temperature variations throughout the depth (dr = rout – rin), that is, the distance starting from the illuminated face of the cloud (rin) through the entire thickness of the shell to the outer edge (rout). The electron temperature varies in the range of 7520–17 700 K. The very high density of electrons and H+ signifies that the shell is in an ionized form, and that the electrons are much more abundant than atomic hydrogen. We obtain a peak electron density of 7.1 × 106 cm–3, whereas it is 1.6 × 104 cm–3 for atomic hydrogen. Therefore, the collisional rate with electrons should dominate for the non-local thermodynamic equilibrium emission.
Figure 2 shows the abundance (with respect to total hydrogen nuclei) profile of noble gas hydride cations. HeH+ shows the highest peak abundance (~6.4 × 10⁻¹² with a total column density of ~3.02 × 109 cm–2), whereas, ArH+ and NeH+ show negligible abundance (2.1 × 10⁻²⁴ and 2.2 × 10⁻²⁰). ArH+ is mainly formed by Ar+ + H2 → ArH+ + H, whereas, for HeH+, the main formation pathway is He+ + H → HeH+ + hν. As NeH+ formation by Ne+ + H2 → NeH+ + H was questioned by Theis et al. (2015), we do not consider this reaction in our network. Rather, we notice a favorable formation of NeH+ by HeH+ + Ne → NeH+ + He. As molecular hydrogen is underabundant in this region, the abundance of ArH+ is insignificant. However, the abundance of HeH+ is favorable because of the comparatively high abundance of atomic hydrogen. Since NeH+ formation depends on the HeH+ formation, it requires an additional reaction with Ne with a rate constant of ~10–9 cm3 s–1.
Additionally, the formation of NeH+ is hampered due to the low abundance of Ne. Another reason for the higher production of HeH+ is that the initial elemental abundance for He is much higher (0.116) than that of Ar (2.55 × 10⁻³) and Ne (1.11 × 10⁻⁶) (Schwarz 2002). The oscillation of the abundances at large depths, as seen in Fig. 2, may be due to the decrease in both hydrogen and electron densities at those depths, as shown in Fig. 1.
Figure 3 shows the intrinsic absolute line surface brightness of the strongest pure rotational transitions of HeH+ in the range 15–149 µm noted in Table 2. Figure 3 compares surface brightness values to check their dependency on the different collisional data files used for HeH+ (see Appendix A). The indigo color bars show the modeled values considering the EMAA data. The modeled values considering our CB data are shown as the cyan (Δυ = 0, ±1, ∆ J = ±1) and blue (Δυ = 0, ±1, ∆ J = ±1, and Δυ = 0, ∆J = ±2) color bars. Figure 3 shows that the impact of collisional data considering Δυ = 0, ∆ J = ±2 (de-)excitation transitions is significant (see Appendix A). In particular, we note that the new extended data file has little effect for transitions above 17 µm. In contrast, for higher-frequency transitions (Jup ≥ 10), the surface brightness is significantly increased and is not sensitive to transitions with ∆υ = 0, ∆J = ±2 either. No effect is seen on the calculated surface brightness values when we consider the EMAA data file with or without hydrogen atoms as colliders, as expected from the low abundance of H. However, a dominant effect is seen for the electron impact collisional rate. Due to the minimal formation of ArH+ and NeH+, their abundance is very low (see Fig. 2), and hence, we do not calculate the surface brightness of their transitions.
The upper-state energy, frequency, and line-center optical depth of the transitions are noted in Table 2. From Fig. 3 and Table 2, the most intense transition of HeH+ is the J = 2–1 at 74.76 µm (4008 GHz), which shows an absolute intrinsic surface brightness value of 5.22 × 10⁻⁶ erg cm–2 s–1 sr–1. Within the JWST range (0.6–28.3 µm), the maximum surface brightness is obtained for the J = 6–5 transition at 25.71 µm, which shows a surface brightness of ~8.44 × 10⁻⁸ erg cm–2 s–1 sr–1.
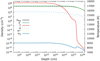 |
Fig. 1 Density and temperature profile in QU Vul ejecta. |
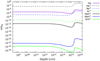 |
Fig. 2 Abundance (with respect to total hydrogen nuclei) profile in QU Vul. |
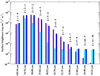 |
Fig. 3 Surface brightness of some of the potential pure rotational transitions of HeH+ in QU Vul by considering the collisional data, which is based on EMAA data (indigo), CB data considering only ∆υ = 0, ±1, ∆J = ±1 (cyan), and CB data considering ∆υ = 0, ±1, ∆J = ±1, and ∆υ = 0, ∆J = ±2 (blue). Table 2 summarizes the plotted CB data considering ∆υ = 0, ±1, ∆ J = ±1, and ∆υ = 0, ∆ J = ±2. |
3.2 RS Oph
Pandey et al. (2022) constructed a simple phenomenological model assuming a spherical geometry to study the optically thin phase of the 2021 outburst using the photoionization code CLOUDY, v.17.02. RS Oph is a shock-wave generator. However, the shock velocity it produces decreases gradually over time. Consequently, a late epoch of day 22 of the 2021 outburst for RS Oph is chosen (see Table 3 of Pandey et al. 2022).
We use the initial elemental abundances and physical parameters noted in Table 1 for modeling purposes. To take all the observed emission lines of both low and high ionization potential into account, we consider two separate density (high-density and low-density) component models with almost the same physical parameters, except n(H) [n(H)dense = 0.35 × 1010 cm–3, n(H)diffuse = 1.77 × 108 cm–3], and with two covering factors (0.61 for dense and 0.39 for diffuse) of the assumed spherically symmetric ejecta, following Pandey et al. (2022). The resulting geometry is a closed thick shell for both cases.
The density variation with depth is shown in Fig. 4 for the dense part (upper panel) and diffuse part (lower panel). The dense part shows a transition zone (at a Strömgren radius of ~6.5 × 1012 cm) from ionic (electron and H+) to atomic (H) with an abrupt decrease in temperature and increase in depth, whereas the diffuse part shows a high constant density of electrons and H+ throughout the depth. The electron temperature varies within ranges of 4000–12 400 K and 11 500–12 800 K for the dense and diffuse parts, respectively.
In the dense component (see the upper panel of Fig. 5), we have significant production of HeH+ with a peak abundance of ~6.88 × 10⁻¹⁰ and a total column density of ~4.00 × 1010 cm–2. As the abundance of H2 in the dense component of RS Oph is much higher (~5.80 × 10⁻⁹) than QU Vul (~3.05 × 10⁻¹⁷), the formation of ArH+ is comparatively favorable. Similarly, a comparatively high abundance of H accelerates the formation of NeH+ from HeH+. At the dense component, we have peak abundances of ~4.47 × 10⁻¹³ and ~1.40 × 10⁻¹² for ArH+ and NeH+, respectively.
Figure 6 shows the predicted absolute intrinsic line surface brightness (values are noted in Table 3) of the strongest pure rotational transitions of HeH+ in the 15-149 µm range. The most intense transition of HeH+ is predicted to be J = 11–10 at 15.21 µm (19 703 GHz) for the dense part and J = 7–6 at 22.31 µm (13 435 GHz) for the diffuse part. Similar to Fig. 3, a comparison has been conducted by considering different collisional data files of HeH+. In the dense component, the electron density is larger than the density of the hydrogen atom, where HeH+ abundance reached the peak (see the upper panels of Figs. 4 and 5). However, to see the impact of hydrogen atoms as collision partners, we check surface brightness values. We consider both electrons and hydrogen atoms as collision partners with the EMAA data file and only electrons with the CB data file. We do not see any significant impact, which is due to the much larger rate coefficients for electrons (~10–6 cm3 s–1) than for H (~10–10 cm3 s–1). Table 3 depicts the calculated surface brightness by considering the HeH+ collisional data file obtained with CB approximation with Δυ = 0, ±1, ∆ J = ±1, and Δυ = 0, ∆J = ±2 (see Appendix A). It is clear from both the panels of Fig. 6 and Table 3 that the dense part produces brighter transitions than the diffuse part of the ejecta.
From the upper panel of Fig. 6 and Table 3, the strongest transition of HeH+ is the J = 11-10 at 15.21 µm (19 703 GHz), which also lies within the JWST range, considering the dense part of the RS Oph ejecta, which shows an absolute intrinsic surface brightness value of 4.36 × 10⁻³ erg cm–2 s–1 sr–1. We also calculate the surface brightness of pure rotational transitions of 36ArH+ and NeH+ for the dense part of the ejecta (see Appendix B). However, as previously stated, the lack of high-temperature data could result in inaccurate estimations.
Pure rotational and ro-vibrational transitions of HeH+ for QU Vul.
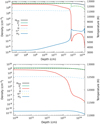 |
Fig. 4 Density and temperature profile in the dense part (upper panel) and diffuse part (lower panel) of the RS Oph ejecta. |
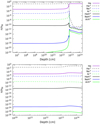 |
Fig. 5 Abundance with respect to total hydrogen in all forms for the dense part (upper panel) and diffuse part (lower panel) in RS Oph. |
Pure rotational and ro-vibrational transitions of HeH+ for RS Oph.
3.3 V1716 Sco
We consider another CNe, V1716 Sco, as a third case study. This choice is based on the most recent work by Woodward et al. (2024) and their prediction of HeH+ production in an observable amount in the denser component of V1716 Sco. Therefore, we only present the analysis of the high-density clump component of V1716 Sco in the coronal line phase of its evolution 132.8 days after outburst (Woodward et al. 2023), focusing on the proposed best-fit physical parameters and initial elemental abundances, as detailed in Table 1. A cylindrical (truncated spherical) geometry of gas expanding with a velocity of vexp = 1000 km s–1 was assumed by Woodward et al. (2024) to model the infrared spectroscopic data of V1716 Sco. The resulting geometry is a closed thick shell.
The density variation with depth is depicted in Fig. 7 for the dense part of the ejecta. The gas is highly ionized and becomes neutral atomic toward the outer edge at a Strömgren radius of ~1.10 × 1014 cm. The electron temperature decreases from 17 638 K to 292 K with increasing distance from the source. The abundance (with respect to total hydrogen nuclei) profiles of all noble gas hydride ions, along with their atomic ions and He, are shown in Fig. 8. As noted by Woodward et al. (2024), we also find an observable amount of HeH+ with a peak abundance of ~ 1.88 × 10⁻⁹ near the overlapping Strömgren spheres at a substantial column density of ~9.60 × 1011 cm–2 considering the chemical reaction set noted in Table C.1, with their corresponding rate coefficients. Woodward et al. (2024) obtained a HeH+ column density of ~9.10 × 1012 cm–2 from their modeling with an almost one-order-of-magnitude higher abundance than ours. The lower HeH+ column density is due to the modified rate coefficients of the dominating formation and destruction reactions of HeH+ (Neufeld et al. 2020) considered in this study (see Table C.1). We obtain peak abundances of ~7.18 × 10⁻¹⁴ and ~6.82 × 10⁻¹² of ArH+ and NeH+, respectively.
Figure 9 shows the predicted (based on HeH+ collisional data file obtained with the CB approximation with Δυ = 0, ± 1, ∆J = ±1, and Δυ = 0, ∆J = ±2 (see Appendix A)) absolute intrinsic line surface brightness (values are noted in Table 4) of the strongest pure rotational transitions of HeH+ and the three most intense ro-vibrational transitions. The most intense transition of HeH+ is predicted to be J = 4-3 at 37.82 µm (7925 GHz). However, within the JWST range, the strongest transition of HeH+ is predicted to be J = 6–5 at 25.70 µm (11 661 GHz). Based on the CLOUDY number densities, we also calculated the line surface brightnesses of the three ro-vibrational transitions, υ = 1–0 P(1), P(2), and R(0) to decipher whether or not they are likely to be detectable, which is further discussed in Sect. 3.5. We also calculated the surface brightness of pure rotational transitions of 36ArH+ and NeH+ for the dense part of the ejecta and provide these in Appendix B. However, as mentioned above, the absence of high-temperature data could lead to inaccurate estimates.
Finally, Fig. 10 illustrates the relative population per sublevel as a function of the upper-level energy for QU Vul (orange), the dense part of RS Oph (blue), the diffuse part of RS Oph (red), and the dense part of V1716 Sco (green). The relative population per sub-level of all the 162 ro-vibrational energy levels, up to the highest level υ = 11, J = 1, which lies about 21 400 K above the ground level, are plotted considering the HeH+ collisional data file obtained with the CB approximation with Δυ = 0, ± 1, ∆J = ±1, and Δυ = 0, ∆J = ±2 (see Appendix A).
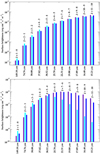 |
Fig. 6 Comparison of the surface brightness of some possible HeH+ pure rotational transitions in the dense (upper panel) and diffuse (lower panel) parts of RS Oph calculated using CLOUDY, considering HeH+ collisional data based on EMAA data (indigo), CB data considering only Δυ = 0, ±1, ∆ J = ±1 (cyan), and CB data considering both Δυ = 0, ±1, ∆J = ±1, and Δυ = 0, ∆J = ±2 (blue). The plotted CB data considering Δυ = 0, ±1, ∆ J = ±1, and Δυ = 0, ∆ J = ±2 are summarized in Table 3. |
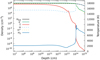 |
Fig. 7 Density and temperature profile in the dense part of V1716 Sco ejecta. |
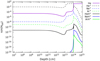 |
Fig. 8 Abundance (with respect to total hydrogen nuclei) profile in the dense part of V1716 Sco ejecta. |
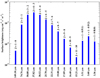 |
Fig. 9 Surface brightness of some of the potential pure rotational and ro-vibrational transitions of HeH+ in V1716 Sco by considering the collisional data based on CB data considering Δυ = 0, ±1, ∆ J = ±1, and Δυ = 0, ∆ J = ±2 (blue). Table 4 summarizes the plotted CB data considering Δυ = 0, ±1, ∆ J = ±1, and ∆υ = 0, ∆ J = ±2. |
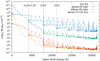 |
Fig. 10 HeH+ (υ, J) population diagram for QU Vul (orange), RS Oph dense part (blue), RS Oph diffuse part (red), and V1716 Sco dense part (green). |
Pure rotational and ro-vibrational transitions of HeH+ for V1716 Sco.
3.4 HeH+ formation timescale
For this modeling, we assume the gas is in steady-state equilibrium. We understand that this assumption is most likely invalid because of the rapidly changing dynamic nature of the nova outburst region, yet we wish to check the microphysical timescales involved in this study to verify whether our simplistic CLOUDY model is time-steady.
For QU Vul, we obtain the longest thermal timescale of ~7.81 × 10⁶ s (~90 days), a 21 cm equilibrium timescale of ~2.30 × 10³ s (~38 minutes), and the longest H recombination timescale of ~6.05 × 10⁷ s (~1.92 years ~702 days). As the longest calculated timescale (~1.92 years ~702 days) is comparable to the age of the cloud (day 550 ~1.51 years), our estimated surface brightness should be considered the upper limit of the transition.
In the case of the dense part of the RS Oph ejecta model, we obtain ~1.27 × 10⁶ s (14.7 days), 1.93 s, and 1.33 × 10⁵ s (1.5 days) for the longest thermal timescale, a 21 cm equilibrium timescale, and the longest H-recombination timescale, respectively. Therefore, the longest timescale is 14.7 days, and we are considering the 22nd day (1.9 × 10⁶ s) after the outburst occurs. For the diffuse part, we obtain an even lower longest timescale of 1.34 days, and so in these cases our calculated surface brightness is well constrained within the age of the cloud, and the system is in photoionization equilibrium. The longest time recorded is 14.5 days for the dense part, meaning the parameters should remain constant over this period. However, the situation is more dynamic in earlier days. Therefore, it is important to note that the value obtained here should be considered an upper limit.
In the case of the V1716 Sco dense component model, the longest thermal timescale is found to be ~970 days, or ~2.66 years. This suggests that the equilibrium timescale for the thermal solution is longer than the age of the gas cloud. However, Woodward et al. (2024) provided the best-fit model for the epoch day 132.8, which is shorter than the longest thermal timescale based on their best-fit CLOUDY model, and atomic processes or microphysics cannot become time-steady within this period.
3.5 Detectability
The atmospheric transmission of Earth limits the ground-based detection of the forecasted HeH+ transitions from suitable sites (e.g., Cerro Chajnantor, Chile) to a selection of spectral lines. For a water-vapor column of 0.2 mm (pwv), the J = 11–10 and J = 10–9 lines are blocked and hampered by the atmosphere, respectively. The transitions J = 9–8 to J = 6–5 are possible for high-resolution spectroscopy (R ~ 106, so as to correct for individual, narrow atmospheric features). The rotational transitions between lower J levels are reserved for airborne or space-based observatories. Currently, only the MIRI/MRS instrument on board the JWST provides access to the modeled mid-infrared observations, at moderate spectral resolution (R = λ/Δλ ~1000–3000, Argyriou et al. 2023). In the following, we assess their possibility to detect.
At a distance of 2.68 kpc (Schaefer 2022) and for the modeled transitions accessible to MIRI/MRS (J = 6-5 to J = 11–10), the line-area-integrated flux densities emitted from the dense component of RS Oph amount to (0.75-5.71) × 10–17 erg cm–2 s–1. Following the JWST exposure time calculator (version 3.2, Pontoppidan et al. 2016), with a total exposure time of approximately four hours, the J = 6–5 line (λ 25.70 µm) will be undetectable, with a signal-to-noise ratio (S/N) of 0.07, while the J = 11–10 line (λ 15.21 µm) reaches a detectable S/N of 8.3. These estimates are for spectroscopy with the integral field unit, two-point nodding, and sensitivity-optimizing apertures of 0.6″ and 0.3″, respectively, accounting for the sky background brightness. We note that the J = 10–9 line (λ 16.40 µm) of HeH+ is also detectable with the same setup, at a S/N of 6.4. However, these rather promising evaluations do not account for the possibility of spectral blends with infrared recombination lines (e.g., HI (21–11) at λ 15.20 µm and HI (15–10) at λ 16.41 µm); avoiding these would require a spectral resolution of R ≳ 1500. For V1716 Sco, the feasibility estimate for midinfrared spectroscopy is less optimistic, although its larger size compensates for the greater distance (3.6 kpc; Woodward et al. 2024). With the same technical and observational setup as for RS Oph, the J = 6–5 line would appear with 1.1 σrms, while the J = 11–10 line displays only 0.3 σms. Even for a marginal 3 σms detection, ∼30 hours telescope time would be required.
For the ro-vibrational υ = 1–0 transitions in the nearinfrared, the situation is more promising: Using the Near Infrared Spectrograph (NIRSpec) instrument on board JWST (Jakobsen et al. 2022) in a high-spectral-resolution (R ∼ 2700) single-slit configuration, after one hour integration time the P(1), P(2), and R(0) lines of the dense component of V1716 Sco at λ 3.515, 3.607, and 3.363 µm would be detected at, respectively, 5.6, 8.8, and 5.1 σrms . For the dense part of RS Oph, the corresponding results are, respectively, 2.0, 1.9, and 3.5 σrms, justifying a longer but reasonable integration time of a few hours. We note, however, that the near-infrared continuum brightness of V1716 Sco, as reported by Woodward et al. (2024), bears the risk of detector saturation, at least partially.
However, with this study of the detectability of HeH+ transitions in these sources, our aim is to assess the potential for their future detection in objects with comparable physical and chemical conditions. Monitoring the recurrent occurrences of novae in the nearby vicinity presents a unique opportunity to track HeH+ in real time, enabling us to observe their evolution as the nova progresses. We can gather evidence that either supports the presence of HeH+ or offers definitive data that can be used to challenge or rule out current hypotheses.
4 Conclusions
HeH+ was the first heteronuclear molecule formed in the metal- free Universe after the Big Bang. Its presence has long been speculated in interstellar space. Although it was first identified in the laboratory nearly a century ago (Hogness & Lunn 1925), the possibility that HeH+ might exist in local astrophysical plasmas, especially in the planetary nebula, was proposed in the late 1970s (Black 1978). After its first circumstellar detection in the young and dense planetary nebula, NGC 7027 (Güsten et al. 2019; Neufeld et al. 2020), the molecule received particular attention. Here, we report the possibility of identifying HeH+ in similar physical conditions to CNe ejecta with space-based observation (specifically by the JWST). We carry out a photoionization modeling (based on the earlier published best-fit physical parameters) for the nova outburst region to study the fate of noble gas-related species. Our findings are summarized as follows:
We find several pure rotational and ro-vibrational transitions of HeH+ that fall in the range of JWST and have observable surface brightness in both the dense component of RS Oph and V1716 Sco nova ejecta regions. The surface brightness values are larger in RS Oph and V1716 Sco than in QU Vul due to the much larger electron density and, to a lesser extent, the larger HeH+ abundance. Here, we consider steady-state calculations and check the microphysical timescales, which suggest that the surface brightnesses that we have computed for these transitions should be considered as upper limits. Nevertheless, our feasibility estimate for the JWST predicts that toward RS Oph, a S/N of up to 8 can be reached in the J = 11-10 line after four hours of integration time using the MIRI/MST instrument, leaving a sufficient margin for a potentially significant detection. For the ro- vibrational υ = 1–0, P(1), P(2), and R(0) transitions in the near-infrared toward V1716 Sco would have been detected at a S/N of 5.6, 8.8, and 5.1, respectively, using the JWST NIRSpec instrument after one hour of integration time. For RS Oph, the corresponding results suggest a longer but reasonable integration time of a few hours. However, there is a risk of detector saturation in the near-infrared continuum brightness of V1716 Sco. It should be noted that the CNe objects studied here are used as templates, and not as targets for observations. The detection of these lines toward similar objects could be important for deriving the physical conditions of these systems and for testing our chemical model prediction based on our chemical network and new electron-impact ro-vibrational collisional data for HeH+ at temperatures of up to 20 000 K. Furthermore, the application of our chemistry network and collisional data is not limited to novae and can be extended to other settings as well.
Due to the lower abundance of molecular hydrogen (specifically in QU Vul), the abundance of ArH+ is negligible. As NeH+ in our reaction network depends on the formation of HeH+, its formation is slowed down. However, we obtain a high abundance of HeH+ because of the high abundance of atomic hydrogen.
We cannot estimate the surface brightness of the transitions of 36ArH+ and NeH+ falling within the JWST domain because of the unavailability of the collisional de-excitation rates for a sufficient number of energy levels. However, we note that in the denser parts of RS Oph and V1716 Sco, an intense surface brightness can be expected for 36ArH+ and NeH+ transitions due to a very high abundance of electrons.
Finally, we note that HeH+ belongs to the class of “reactive” ions that can be destroyed so quickly that their level populations never get fully equilibrated, as observed, for example, in CH+ (Faure et al. 2017, and references therein) and OH (Zannese et al. 2024). For such species, chemical formation and destruction rates are in competition with inelastic rates and should be included in the statistical equilibrium equations. This will be investigated in future work.
Data availability
The data underlying this article are made available under a Creative Commons Attribution license on Zenodo: doi:10.5281/zenodo.14097180.
Acknowledgements
The authors thank the referees for the valuable insights and constructive critiques that significantly improved the manuscript. M.S. acknowledges financial support from the European Research Council (consolidated grant COLLEXISM, grant agreement ID: 811363). M.S. and R.D. would like to acknowledge S.N. Bose National Centre for Basic Sciences, Salt Lake, Kolkata, under the Department of Science and Technology (DST), Government of India. A.D. acknowledges the Max Planck Society for sponsoring a scientific visit of three months. R.P. acknowledges the Physical Research Laboratory, Department of Space, Government of India, for her Post-doctorate fellowship. P.C. acknowledges the support of the Max Planck Society. This research has made use of spectroscopic and collisional data from the EMAA database (https://emaa. osug.fr and https://dx.doi.org/10.17178/EMAA). EMAA is supported by the Observatoire des Sciences de l’Univers de Grenoble (OSUG).
Appendix A Electron-impact HeH+ ro-vibrational collisional (de-)excitation data
Because HeH+ has a large dipole (1.7 D), dipolar rotational transitions (i.e., those with ∆ J = ±1) are expected to have large cross sections dominated by high-partial waves, i.e., long-range interactions. In such a case, the dipolar Coulomb-Born (CB) theory should be a rather good approximation.
Following Chu & Dalgarno (1974) and Neufeld & Dalgarno (1989), the CB cross section for a dipole-allowed ro-vibrational excitation (υ, J) → (υ′, J′) can be formulated using the Einstein A coefficients as follows (adopting Gaussian units):
 (A.1)
(A.1)
where k (k′) is the initial (final) wave number of the electron, A (υ′, J′ → υ, J) is the Einstein coefficient of the transition, h is the Planck’s constant, c is the speed of light, ν is the frequency of the transition, e is the elementary charge, a0 is the bohr radius, and fE1(η, ζ) is a function related to the E1 nuclear Coulomb function, with η = –1 /k and ζ = 1/k – 1/k′. The exact expression of fE1(η,ζ) is given in Eq. (22) of Chu & Dalgarno (1974). We note that the CB approximation leads to a large and finite cross section at the threshold, where the expression of fE1(η, ζ) simplifies (Chu & Dalgarno 1974). In practice, Einstein coefficients are extracted from the EXOMOL database (Tennyson et al. 2016) for dipole-allowed transitions among all bound levels below a threshold of 14,874 cm–1, thus including rotational levels up to J = 23 and vibrational levels up to υ = 11. CB cross sections are computed for electron energies up to 20 eV and for 415 dipolar transitions (υ, J) → (υ′, J′). Rate coefficients are deduced for temperatures between 10 K and 20 000 K by Maxwell-Boltzmann averaging the cross sections.
As shown in the upper panel of Fig. A.1, the CB rate coefficient for J = 0 – 1 is in very good agreement with the result of Hamilton et al. (2016), but it is somewhat larger than that of Ayouz & Kokoouline (2019). This reflects the different treatments of the long-range interaction and the contribution of high partial waves, as discussed in Čurík & Greene (2017). For higher transitions (those with ∆ J > 1), the dipolar CB approximation predicts null cross sections by definition. The calculations of Hamilton et al. (2016) and Ayouz & Kokoouline (2019) have shown, however, that the transition J = 0 – 2 has a sizable crosssection, which is typically half the cross section for J = 0 – 1 at high collision energies. Cross sections for transitions with ∆ J = ±3, ±4 are, on the other hand, lower by at least an order of magnitude. Similar results are observed for vibrational excitation (lower panel of Fig. A.1) where the transition υ = 0 - 1 is found to largely dominate with a good agreement between the CB results and those of Ayouz & Kokoouline (2019). As expected, the dipolar CB theory is thus found to be accurate for transitions where ∆ J = ±1 and ∆υ = 0, ±1. This confirms that these transitions (in HeH+) are largely dominated by high-partial waves. The next dominant transitions, those with ∆ J = ±2 (and ∆υ = 0), are dominated by low-partial waves and cannot be predicted with the CB theory (Faure & Tennyson 2001). For these transitions (e.g., υ = 0, J = 0 → υ = 0, J = 2), the rate coefficients are fixed at half those of the corresponding ∆ J = ±1 transitions (e.g., υ = 0, J = 0 → υ = 0, J = 1). This simple recipe shows good results at 500 K when compared to RADEX calculations based on the complete and accurate dataset of Hamilton et al. (2016). This new extended data file are made available on Zenodo.
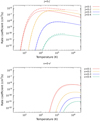 |
Fig. A.1 Thermal rate coefficients for several rotational (upper panel) and vibrational (lower panel) excitation transitions of HeH+. Solid lines in both panels are calculated rate coefficients by Ayouz & Kokoouline (2019), dashed lines in the upper panel are the calculations by Hamilton et al. (2016), and dotted lines in both panels indicate our CB data. |
Appendix B ArH+ and NeH+ in the dense part of the RS Oph and V1716 Sco ejecta
Figure B.1 shows the predicted absolute intrinsic line surface brightness of 36ArH+ and NeH+ from the dense part of the RS Oph and V1716 Sco ejecta as stated in Sect. 3.2 and 3.3, respectively. Surface brightness values along with upper-state energy, frequency, and line-center optical depth of the transitions are noted in Table B.1. Since collisional rates for only a limited number of energy levels are available for 36ArH+ and NeH+, we do not get any transitions in the JWST domain. Moreover, since we do not have high-temperature collisional data for 36ArH+ and NeH+ , these results can be considered as an approximation for the nova outburst region. The intense surface brightness for 36ArH+ and NeH+ transitions arises because of the high density (~109 cm–3) of electrons around this region. From Figure B.1 and Table B.1, the most intense transitions of 36ArH+ and NeH+ are the J = 11 – 10 and J = 7 – 6 transitions, respectively for RS Oph and J = 10 – 9 and J = 6 – 5 transitions, respectively for V1716 Sco.
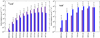 |
Fig. B.1 Surface brightness of some potential 36ArH+ (left panel) and NeH+ (right panel) rotational transitions in the dense part of the RS Oph (indigo) and V1716 Sco (blue) ejecta. The plotted data are summarized in Table B.1. |
Strongest transitions of 36ArH+ and NeH+ for the dense part in RS Oph and V1716 Sco ejecta.
Appendix C Reaction network
Reaction pathways for the formation and destruction of noble gas ions considered in CLOUDY modeling.
References
- Amaral, P. H. R., Diniz, L. G., Jones, K. A., et al. 2019, ApJ, 878, 95 [NASA ADS] [CrossRef] [Google Scholar]
- Argyriou, I., Glasse, A., Law, D. R., et al. 2023, A&A, 675, A111 [NASA ADS] [CrossRef] [EDP Sciences] [Google Scholar]
- Ayouz, M., & Kokoouline, V. 2019, Atoms, 7, 67 [NASA ADS] [CrossRef] [Google Scholar]
- Banerjee, D. P. K., Woodward, C. E., Joshi, V., et al. 2023, ApJ, 954, L16 [NASA ADS] [CrossRef] [Google Scholar]
- Barlow, M. J., Swinyard, B. M., Owen, P. J., et al. 2013, Science, 342, 1343 [NASA ADS] [CrossRef] [Google Scholar]
- Bath, G. T., & Shaviv, G. 1976, MNRAS, 175, 305 [Google Scholar]
- Bianchini, A., Sabbadin, F., Favero, G. C., & Dalmeri, I. 1986, A&A, 160, 367 [NASA ADS] [Google Scholar]
- Bianchini, A., Alford, B., Canterna, R., & Della Valle, M. 2001, MNRAS, 321, 625 [Google Scholar]
- Black, J. H. 1978, ApJ, 222, 125 [NASA ADS] [CrossRef] [Google Scholar]
- Bode, M. F., & Evans, A. 2008, Classical Novae, 43 [CrossRef] [Google Scholar]
- Brandi, E., Quiroga, C., Mikolajewska, J., Ferrer, O. E., & García, L. G. 2009, A&A, 497, 815 [NASA ADS] [CrossRef] [EDP Sciences] [Google Scholar]
- Chatzikos, M., Bianchi, S., Camilloni, F., et al. 2023, Rev. Mexicana Astron. Astrofis., 59, 327 [Google Scholar]
- Chomiuk, L., Linford, J. D., Yang, J., et al. 2014, Nature, 514, 339 [NASA ADS] [CrossRef] [Google Scholar]
- Chu, S.-I., & Dalgarno, A. 1974, Phys. Rev. A, 10, 788 [Google Scholar]
- Collins, P., Hurst, G. M., Wils, P., et al. 1984, IAU Circ., 4023, 1 [NASA ADS] [Google Scholar]
- Curík, R., & Greene, C. H. 2017, J. Chem. Phys., 147, 054307 [CrossRef] [Google Scholar]
- Dagdigian, P. J. 2018, MNRAS, 477, 802 [CrossRef] [Google Scholar]
- Das, R. K., Banerjee, D. P. K., & Ashok, N. M. 2009, MNRAS, 398, 375 [NASA ADS] [CrossRef] [Google Scholar]
- Das, A., Sil, M., Bhat, B., et al. 2020, ApJ, 902, 131 [Google Scholar]
- Derdzinski, A. M., Metzger, B. D., & Lazzati, D. 2017, MNRAS, 469, 1314 [NASA ADS] [CrossRef] [Google Scholar]
- Desrousseaux, B., & Lique, F. 2020, J. Chem. Phys., 152, 074303 [NASA ADS] [CrossRef] [Google Scholar]
- Esposito, F., Coppola, C. M., & De Fazio, D. 2015, J. Phys. Chem. A, 119, 12615 [Google Scholar]
- Evans, A. 1991, MNRAS, 251, 54 [Google Scholar]
- Evans, A., Geballe, T. R., Rawlings, J. M. C., & Scott, A. D. 1996, MNRAS, 282, 1049 [Google Scholar]
- Faure, A., & Tennyson, J. 2001, MNRAS, 325, 443 [NASA ADS] [CrossRef] [Google Scholar]
- Faure, A., Halvick, P., Stoecklin, T., et al. 2017, MNRAS, 469, 612 [NASA ADS] [CrossRef] [Google Scholar]
- Ferland, G. J., Lambert, D. L., Netzer, H., Hall, D. N. B., & Ridgway, S. T. 1979, ApJ, 227, 489 [NASA ADS] [CrossRef] [Google Scholar]
- Fujii, M., Arai, A., & Kawakita, H. 2021, ApJ, 907, 70 [CrossRef] [Google Scholar]
- Gehrz, R. D., Evans, A., Woodward, C. E., et al. 2018, ApJ, 858, 78 [NASA ADS] [CrossRef] [Google Scholar]
- Gehrz, R. D., Truran, J. W., Williams, R. E., & Starrfield, S. 1998, PASP, 110, 3 [NASA ADS] [CrossRef] [Google Scholar]
- Glassgold, A. E., & Langer, W. D. 1974, ApJ, 193, 73 [NASA ADS] [CrossRef] [Google Scholar]
- Grevesse, N., & Noels, A. 1993, in Origin and Evolution of the Elements, eds. N. Prantzos, E. Vangioni-Flam, & M. Casse, 15 [Google Scholar]
- Grevesse, N., Asplund, M., Sauval, A. J., & Scott, P. 2010, Ap&SS, 328, 179 [Google Scholar]
- Güsten, R., Wiesemeyer, H., Neufeld, D., et al. 2019, Nature, 568, 357 [CrossRef] [Google Scholar]
- Hachisu, I., & Kato, M. 2016, ApJ, 816, 26 [Google Scholar]
- Hamilton, J. R., Faure, A., & Tennyson, J. 2016, MNRAS, 455, 3281 [NASA ADS] [CrossRef] [Google Scholar]
- Hjellming, R. M., van Gorkom, J. H., Taylor, A. R., et al. 1986, ApJ, 305, L71 [NASA ADS] [CrossRef] [Google Scholar]
- Hogness, T. R., & Lunn, E. G. 1925, Phys. Rev., 26, 786 [Google Scholar]
- Hyland, A. R., & McGregor, P. J. 1989, in Interstellar Dust, 135, eds. L. J. Allamandola, & A. G. G. M. Tielens, 101 [NASA ADS] [Google Scholar]
- Indriolo, N., Geballe, T. R., Oka, T., & McCall, B. J. 2007, ApJ, 671, 1736 [NASA ADS] [CrossRef] [Google Scholar]
- Jakobsen, P., Ferruit, P., Alves de Oliveira, C., et al. 2022, A&A, 661, A80 [NASA ADS] [CrossRef] [EDP Sciences] [Google Scholar]
- José, J. 2012, Bull. Astron. Soc. India, 40, 443 [Google Scholar]
- Kálosi, Á., Grieser, M., Isberner, L. W., et al. 2024, Phys. Rev. A, 110, 022816 [Google Scholar]
- Kawakita, H., Fujii, M., Nagashima, M., et al. 2015, PASJ, 67, 17 [Google Scholar]
- Kingdon, J. B., & Ferland, G. J. 1996, ApJS, 106, 205 [NASA ADS] [CrossRef] [Google Scholar]
- Kumar, V., Srivastava, M. K., Banerjee, D. P. K., et al. 2022, MNRAS, 510, 4265 [Google Scholar]
- Livio, M., & Truran, J. W. 1994, ApJ, 425, 797 [NASA ADS] [CrossRef] [Google Scholar]
- McElroy, D., Walsh, C., Markwick, A. J., et al. 2013, A&A, 550, A36 [NASA ADS] [CrossRef] [EDP Sciences] [Google Scholar]
- Metzger, B. D., Hascoët, R., Vurm, I., et al. 2014, MNRAS, 442, 713 [NASA ADS] [CrossRef] [Google Scholar]
- Mikolajewska, J., & Shara, M. M. 2017, ApJ, 847, 99 [CrossRef] [Google Scholar]
- Neufeld, D. A., & Dalgarno, A. 1989, Phys. Rev. A, 40, 633 [NASA ADS] [CrossRef] [Google Scholar]
- Neufeld, D. A., & Wolfire, M. G. 2016, ApJ, 826, 183 [Google Scholar]
- Neufeld, D. A., Goto, M., Geballe, T. R., et al. 2020, ApJ, 894, 37 [CrossRef] [Google Scholar]
- Novotný, O., Wilhelm, P., Paul, D., et al. 2019, Science, 365, 676 [CrossRef] [Google Scholar]
- Orient, O. J. 1977, Chem. Phys. Lett., 52, 264 [NASA ADS] [CrossRef] [Google Scholar]
- Osterbrock, D. E., & Ferland, G. J. 2006, Astrophysics of gaseous nebulae and active galactic nuclei (Sausalito, CA: University Science Books) [Google Scholar]
- Page, K. L., & Kuin, N. P. M. 2023, ATel, 16069, 1 [NASA ADS] [Google Scholar]
- Pandey, R., Habtie, G. R., Bandyopadhyay, R., et al. 2022, MNRAS, 515, 4655 [NASA ADS] [CrossRef] [Google Scholar]
- Pandey, R., Srivastava, M. K., & Shaw, G. 2024, MNRAS, 532, 3985 [Google Scholar]
- Pontefract, M., & Rawlings, J. M. C. 2004, MNRAS, 347, 1294 [NASA ADS] [CrossRef] [Google Scholar]
- Pontoppidan, K. M., Pickering, T. E., Laidler, V. G., et al. 2016, SPIE Conf. Ser., 9910, 991016 [NASA ADS] [Google Scholar]
- Priestley, F. D., Barlow, M. J., & Viti, S. 2017, MNRAS, 472, 4444 [NASA ADS] [CrossRef] [Google Scholar]
- Rawlings, J. M. C. 1988, MNRAS, 232, 507 [Google Scholar]
- Rawlings, J. M. C., & Williams, D. A. 1989, MNRAS, 240, 729 [Google Scholar]
- Rosino, L., & Iijima, T. 1987, Ap&SS, 130, 157 [NASA ADS] [CrossRef] [Google Scholar]
- Roueff, E., Alekseyev, A. B., & Le Bourlot, J. 2014, A&A, 566, A30 [NASA ADS] [CrossRef] [EDP Sciences] [Google Scholar]
- Rudy, R. J., Dimpfl, W. L., Lynch, D. K., et al. 2003, ApJ, 596, 1229 [NASA ADS] [CrossRef] [Google Scholar]
- Schaefer, B. E. 2010, ApJS, 187, 275 [NASA ADS] [CrossRef] [Google Scholar]
- Schaefer, B. E. 2022, MNRAS, 517, 6150 [NASA ADS] [CrossRef] [Google Scholar]
- Schilke, P., Neufeld, D. A., Müller, H. S. P., et al. 2014, A&A, 566, A29 [NASA ADS] [CrossRef] [EDP Sciences] [Google Scholar]
- Schwarz, G. J. 2002, ApJ, 577, 940 [NASA ADS] [CrossRef] [Google Scholar]
- Shaw, G., Ferland, G. J., Abel, N. P., Stancil, P. C., & van Hoof, P. A. M. 2005, ApJ, 624, 794 [NASA ADS] [CrossRef] [Google Scholar]
- Shore, S. N., & Gehrz, R. D. 2004, A&A, 417, 695 [NASA ADS] [CrossRef] [EDP Sciences] [Google Scholar]
- Shore, S. N., Starrfield, S., Gonzalez-Riestrat, R., Hauschildt, P. H., & Sonneborn, G. 1994, Nature, 369, 539 [Google Scholar]
- Shore, S. N., Kuin, N. P., Mason, E., & De Gennaro Aquino, I. 2018, A&A, 619, A104 [NASA ADS] [CrossRef] [EDP Sciences] [Google Scholar]
- Smith, C. H., Aitken, D. K., Roche, P. F., & Wright, C. M. 1995, MNRAS, 277, 259 [Google Scholar]
- Sokoloski, J. L., Luna, G. J. M., Mukai, K., & Kenyon, S. J. 2006, Nature, 442, 276 [CrossRef] [Google Scholar]
- Starrfield, S., Bose, M., Iliadis, C., et al. 2020, ApJ, 895, 70 [NASA ADS] [CrossRef] [Google Scholar]
- Tennyson, J., Yurchenko, S. N., Al-Refaie, A. F., et al. 2016, J. Mol. Spectrosc., 327, 73 [Google Scholar]
- Theis, R. A., Morgan, W. J., & Fortenberry, R. C. 2015, MNRAS, 446, 195 [Google Scholar]
- Villinger, H., Futrell, J. H., Howorka, F., Duric, N., & Lindinger, W. 1982, J. Chem. Phys., 76, 3529 [NASA ADS] [CrossRef] [Google Scholar]
- Walter, F. M., & Pearce, A. 2023, ATel, 16003, 1 [NASA ADS] [Google Scholar]
- Wichmann, R., Krautter, J., Kawara, K., & Williams, R. E. 1990, in Astronomis-che Gesellschaft Abstract Series, 5, 17 [NASA ADS] [Google Scholar]
- Wilson, O., & Merrill, P. W. 1935, PASP, 47, 53 [NASA ADS] [CrossRef] [Google Scholar]
- Woodward, C. E., Evans, A., & Banerjee, D. K. P. 2023, ATel, 16222, 1 [NASA ADS] [Google Scholar]
- Woodward, C. E., Shaw, G., Starrfield, S., Evans, A., & Page, K. L. 2024, ApJ, 968, 31 [Google Scholar]
- Zannese, M., Tabone, B., Habart, E., et al. 2024, Nat. Astron., 8, 577 [Google Scholar]
All Tables
CLOUDY physical model parameters and initial elemental abundance set for QU Vul epoch D550 (Schwarz 2002), RS Oph epoch D22 (Pandey et al. 2022), and V1716 Sco epoch D132.8 (Woodward et al. 2024).
Strongest transitions of 36ArH+ and NeH+ for the dense part in RS Oph and V1716 Sco ejecta.
Reaction pathways for the formation and destruction of noble gas ions considered in CLOUDY modeling.
All Figures
|
Fig. 1 Density and temperature profile in QU Vul ejecta. |
| In the text | |
|
Fig. 2 Abundance (with respect to total hydrogen nuclei) profile in QU Vul. |
| In the text | |
|
Fig. 3 Surface brightness of some of the potential pure rotational transitions of HeH+ in QU Vul by considering the collisional data, which is based on EMAA data (indigo), CB data considering only ∆υ = 0, ±1, ∆J = ±1 (cyan), and CB data considering ∆υ = 0, ±1, ∆J = ±1, and ∆υ = 0, ∆J = ±2 (blue). Table 2 summarizes the plotted CB data considering ∆υ = 0, ±1, ∆ J = ±1, and ∆υ = 0, ∆ J = ±2. |
| In the text | |
|
Fig. 4 Density and temperature profile in the dense part (upper panel) and diffuse part (lower panel) of the RS Oph ejecta. |
| In the text | |
|
Fig. 5 Abundance with respect to total hydrogen in all forms for the dense part (upper panel) and diffuse part (lower panel) in RS Oph. |
| In the text | |
|
Fig. 6 Comparison of the surface brightness of some possible HeH+ pure rotational transitions in the dense (upper panel) and diffuse (lower panel) parts of RS Oph calculated using CLOUDY, considering HeH+ collisional data based on EMAA data (indigo), CB data considering only Δυ = 0, ±1, ∆ J = ±1 (cyan), and CB data considering both Δυ = 0, ±1, ∆J = ±1, and Δυ = 0, ∆J = ±2 (blue). The plotted CB data considering Δυ = 0, ±1, ∆ J = ±1, and Δυ = 0, ∆ J = ±2 are summarized in Table 3. |
| In the text | |
|
Fig. 7 Density and temperature profile in the dense part of V1716 Sco ejecta. |
| In the text | |
|
Fig. 8 Abundance (with respect to total hydrogen nuclei) profile in the dense part of V1716 Sco ejecta. |
| In the text | |
|
Fig. 9 Surface brightness of some of the potential pure rotational and ro-vibrational transitions of HeH+ in V1716 Sco by considering the collisional data based on CB data considering Δυ = 0, ±1, ∆ J = ±1, and Δυ = 0, ∆ J = ±2 (blue). Table 4 summarizes the plotted CB data considering Δυ = 0, ±1, ∆ J = ±1, and ∆υ = 0, ∆ J = ±2. |
| In the text | |
|
Fig. 10 HeH+ (υ, J) population diagram for QU Vul (orange), RS Oph dense part (blue), RS Oph diffuse part (red), and V1716 Sco dense part (green). |
| In the text | |
|
Fig. A.1 Thermal rate coefficients for several rotational (upper panel) and vibrational (lower panel) excitation transitions of HeH+. Solid lines in both panels are calculated rate coefficients by Ayouz & Kokoouline (2019), dashed lines in the upper panel are the calculations by Hamilton et al. (2016), and dotted lines in both panels indicate our CB data. |
| In the text | |
|
Fig. B.1 Surface brightness of some potential 36ArH+ (left panel) and NeH+ (right panel) rotational transitions in the dense part of the RS Oph (indigo) and V1716 Sco (blue) ejecta. The plotted data are summarized in Table B.1. |
| In the text | |
Current usage metrics show cumulative count of Article Views (full-text article views including HTML views, PDF and ePub downloads, according to the available data) and Abstracts Views on Vision4Press platform.
Data correspond to usage on the plateform after 2015. The current usage metrics is available 48-96 hours after online publication and is updated daily on week days.
Initial download of the metrics may take a while.