Fig. 6
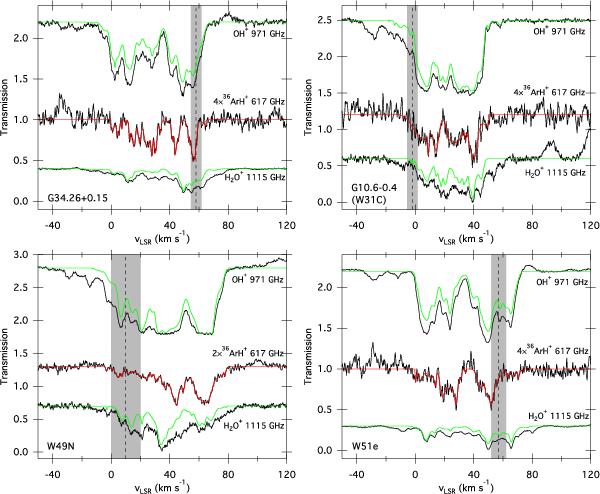
Observations of OH+, H2O+, and ArH+ toward PRISMAS sources. The green lines for OH+ and H2O+, whose transitions have hyperfine structure, give the deconvolved strength of the main hyperfine component.The red lines are fits to the ArH+ spectra used in calculating the column densities presented in Fig. 7. Note that ArH+ spectra have been scaled up to more clearly show the absorption profiles. Vertical dashed lines and gray shaded regions mark the systemic velocity and velocity dispersion observed for background sources. All OH+ and H2O+ spectra in these sight lines will be presented and analyzed in detail by Indriolo et al. (in prep.). Analyses of OH+ and H2O+ that only utilized a subset of the eventual data have been performed for W31C (Gerin et al. 2010), W49N (Neufeld et al. 2010), and W51 (Wyrowski et al. 2010; Indriolo et al. 2012).
Current usage metrics show cumulative count of Article Views (full-text article views including HTML views, PDF and ePub downloads, according to the available data) and Abstracts Views on Vision4Press platform.
Data correspond to usage on the plateform after 2015. The current usage metrics is available 48-96 hours after online publication and is updated daily on week days.
Initial download of the metrics may take a while.