| Issue |
A&A
Volume 566, June 2014
|
|
|---|---|---|
| Article Number | A7 | |
| Number of page(s) | 11 | |
| Section | Stellar structure and evolution | |
| DOI | https://doi.org/10.1051/0004-6361/201423373 | |
| Published online | 29 May 2014 | |
Fundamental properties of nearby single early B-type stars⋆
1 Dr. Karl Remeis-Observatory & ECAP, University Erlangen-Nuremberg, Sternwartstr. 7, 96049 Bamberg, Germany
e-mail: This email address is being protected from spambots. You need JavaScript enabled to view it.
2 Institute for Astro- and Particle Physics, University of Innsbruck, Technikerstr. 25/8, 6020 Innsbruck, Austria
e-mail: This email address is being protected from spambots. You need JavaScript enabled to view it.
Received: 2 January 2014
Accepted: 21 April 2014
Abstract
Aims. Fundamental parameters of a sample of 26 apparently slowly-rotating single early B-type stars in OB associations and in the field within a distance of ≲400 pc from the Sun are presented and compared to high-precision data from detached eclipsing binaries (DEBs). Together with surface abundances for light elements the data are used to discuss the evolutionary status of the stars in context of the most recent Geneva grid of models for core hydrogen-burning stars in the mass-range ~6 to 18 M⊙ at metallicity Z = 0.014.
Methods. The fundamental parameters are derived on the basis of accurate and precise atmospheric parameters determined earlier by us from non-LTE analyses of high-quality spectra of the sample stars, utilising the new Geneva stellar evolution models.
Results. Evolutionary masses plus radii and luminosities are determined to better than typically 5%, 10%, and 20% uncertainty, respectively, facilitating the mass−radius and mass−luminosity relationships to be recovered for single core hydrogen-burning objects with a similar precision as derived from DEBs. Good agreement between evolutionary and spectroscopic masses is found. Absolute visual and bolometric magnitudes are derived to typically ~0.15−0.20 mag uncertainty. Metallicities are constrained to better than 15−20% uncertainty and tight constraints on evolutionary ages of the stars are provided. Overall, the spectroscopic distances and ages of individual sample stars agree with independently derived values for the host OB associations. Signatures of mixing with CN-cycled material are found in 1/3 of the sample stars. Typically, these are consistent with the amount predicted by the new Geneva models with rotation. The presence of magnetic fields appears to augment the mixing efficiency. In addition, a few objects are possibly the product of binary evolution. In particular, the unusual characteristics of τ Sco point to a blue straggler nature, due to a binary merger.
Conclusions. The accuracy and precision achieved in the determination of fundamental stellar parameters from the quantitative spectroscopy of single early B-type stars comes close (within a factor 2–4) to data derived from DEBs. While our fundamental parameters are in good agreement with those derived from DEBs as a function of spectral type, significant systematic differences with data from the astrophysical reference literature are found. Masses are ~10−20% and radii ~25% lower then the recommended values for luminosity class V, resulting in the stars being systematically fainter than assumed usually, by ~0.5 mag in absolute visual and bolometric magnitude. Our sample of giants is too small to derive firm conclusions, but similar trends as for the dwarfs are indicated.
Key words: stars: early-type / stars: evolution / stars: fundamental parameters / stars: massive
Based on observations collected at the Centro Astronómico Hispano Alemán (CAHA) at Calar Alto, operated jointly by the Max-Planck Institut für Astronomie and the Instituto de Astrofísica de Andalucía (CSIC), proposals H2001-2.2-011 and H2005-2.2-016. Based on observations collected at the European Southern Observatory, Chile, ESO 074.B-0455(A). Based on spectral data retrieved from the ELODIE archive at Observatoire de Haute-Provence (OHP). Based on observations made with the Nordic Optical Telescope, operated on the island of La Palma jointly by Denmark, Finland, Iceland, Norway, and Sweden, in the Spanish Observatorio del Roque de los Muchachos of the Instituto de Astrofísica de Canarias.
Visiting scientist at OAC & IATE, UNC, Córdoba, Argentina.
Visiting professor at OAC & IATE, UNC, Córdoba, Argentina.
© ESO, 2014
1. Introduction
Massive stars are main drivers of the evolution of galaxies because of their energy and momentum input into the interstellar medium (ISM) through stellar winds and supernovae, and they are important sites of nucleosynthesis. The development of a detailed understanding of their inner structure and evolution is of utmost importance for wide fields of astrophysics. Among many others, evolution models of massive stars provide the basis for the interpretation of stellar populations in star clusters and galaxies (e.g. Maeder & Conti 1994). They describe the structure of supernova progenitors and allow chemical yields to be predicted (Hirschi et al. 2004; Chieffi & Limongi 2013). They are the starting point for explaining exotic phenomena such as neutron stars, stellar black holes and γ-ray bursts of the long-duration soft-spectrum type (Woosley & Heger 2012).
Enormous progress has been made in the modelling of massive star evolution by accounting for the effects of rotation (Heger & Langer 2000; Meynet & Maeder 2000, 2005) and – to date only far less comprehensively investigated – the effects of interplay of rotation and magnetic fields (Heger et al. 2005; Maeder & Meynet 2005; Meynet et al. 2011). There is a growing body of evidence that rotation together with mass loss are physical key ingredients shaping the evolution of massive stars throughout cosmic history (for a recent review see Maeder & Meynet 2012), as well as mass transfer in close binary systems (Vanbeveren et al. 1998; Wellstein et al. 2001; Langer 2012).
However, it is not clear whether the physical processes currently accounted for are comprehensive and sufficiently well represented in the stellar evolution models. The current models make detailed predictions on the surface properties of massive stars (atmospheric parameters and elemental abundances) as a function of mass, initial chemical composition and initial rotation rate. This facilitates the assumptions made in the models to be verified, by comparison to detailed observations.
Comprehensive tests of stellar evolution models require as accurate characterisation of all stellar properties as possible. Besides atmospheric parameters like effective temperature Teff and (logarithmic) surface gravity log g and elemental abundances a knowledge of fundamental stellar parameters mass M, radius R and luminosity L, and of age τ is necessary. Primary source of such data are double-lined detached eclipsing binaries (DEBs), which allow a direct determination of accurate masses and radii at a precision of 1–2% from analysis of the Keplerian orbits. As only the Teff-ratio of the two stars in a DEB is tightly constrained from light-curve and radial-velocity-curve analysis, but not the effective temperatures of the components, stellar luminosities remain slightly less well-constrained. Ages need to be derived by comparison with theoretical isochrones, with particular constraints set by the condition that both components have to be coeval. The most accurate and precise fundamental parameters for massive stars available at present can be found in the compilation by Torres et al. (2010, henceforth abbreviated TAG10), mainly for the most common among them, the early B-type stars of spectral types B0 to B3. Data on abundances of individual chemical elements in massive DEBs are scarce, though ongoing projects promise to alleviate the situation (Pavlovski & Hensberge 2005; Pavlovski & Southworth 2009, 2014; Pavlovski et al. 2009, 2011; Mayer et al. 2013; Tkachenko et al. 2014).
Yet, the number of DEBs is limited, and it would be highly valuable if data of high quality could be obtained for single stars. The best candidate stars are located in clusters or associations, where distances (and therefore luminosities) and ages can be constrained from photometry and main-sequence fitting. Despite the importance of this basic data in the astrophysical context, little work on masses, radii, luminosities and ages of early B-type stars has been published over the past two decades (Wolff 1990; Gies & Lambert 1992; Kilian 1992; Lyubimkov et al. 2002; Hohle et al. 2010, but all far less accurate and precise than the DEB data). Moreover, the astrophysical reference literature like the Landolt-Börnstein (Schmidt-Kaler 1982), which has also been adopted in more recent compilations like Allen’s Astrophysical Quantities (Cox 2000), are based on the state-of-the art achieved more than three decades ago.
Over the past years, we have improved the modelling and analysis of the atmospheres of early B-stars by introducing non-LTE line-formation calculations based on a new generation of sophisticated model atoms (Nieva & Przybilla 2006, 2007, 2008; Przybilla et al. 2008). Quantitative analyses of two samples of stars based on these models (Nieva & Simón-Díaz 2011; Nieva & Przybilla 2012, henceforth abbreviated NS11 and NP12, respectively), provide a highly accurate and precise characterisation of their atmospheric parameters and chemical abundances.
Here, we want to discuss in particular the fundamental parameters M, R, L and τ of the sample stars. As these are (effectively) single stars, stellar evolution models need to be employed in their derivation. Among the available state-of-the-art stellar model grids we focus on the new generation of Geneva models (Ekström et al. 2012, EGE12), as these have been computed for the same metallicity as found for the early B-stars in the solar neighbourhood (NP12), Z = 0.0141. Similar grids by other groups differ either significantly in metallicity (Brott et al. 2011, Z = 0.0088) or do not provide information on surface abundances of the light elements (Chieffi & Limongi 2013), which are required for the discussion of the evolutionary status of the stars. A detailed comparison of evolution tracks for single massive stars computed with six different state-of-the-art codes has been undertaken recently by Martins & Palacios (2013). Their conclusions support our approach, as they find that the different models agree well for the main-sequence evolution. The only decisive factor for the loci of the evolution tracks in the Hertzsprung-Russell diagram (HRD) is the metallicity, while all other factors like e.g. the overshooting parameter have little effect, except close to the terminal-age main-sequence. Once the fundamental parameters are derived, they can – together with atmospheric parameters and light element abundances – also be employed to discuss the evolutionary status of the individual objects and their accordance with the predictions from the models.
The paper is structured in the following way. A brief summary of the quantitative spectroscopy of the sample stars is given in the next section. Details and results of the fundamental parameter determination are discussed in Sect. 3. Then, the evolutionary status of the sample stars is discussed in Sect. 4. Functional relationships of the fundamental parameters in dependence on spectral type are compared to data from the reference literature in Sect. 5, which is followed by some concluding remarks.
2. Quantitative spectroscopy of the sample stars
The present study relies on the quantitative model atmosphere analysis of 26 early B-type stars published earlier by us (NS11; NP12). All sample stars are located in nearby OB associations (Cas-Tau, Sco-Cen, Lac OB1, Ori OB1) or in the field at distances of less than about 400 pc from the Sun, see Figs. 1 and 13 of NP12 for the spatial distribution of the stars. They are apparently slow rotators, with projected rotational velocities vrotsini ≲ 30 km s-1.
High-resolution échelle spectra at very high signal-to-noise ratio (S/N ≃ 250–800 in B) and wide wavelength coverage were investigated. The observational data for stars 1–6 (see Table 1) were obtained with Feros on the ESO 2.2 m telescope in La Silla/Chile (resolving power R = λ/ Δλ ≈ 48 000), for stars 7–16 with Foces on the 2.2 m telescope at Calar Alto/Spain (R ≈ 40 000), and for stars 21–26 with Fies on the 2.5 m Nordic Optical Telescope/La Palma (R ≈ 46 000). The spectra for stars 17–20 were extracted from the Elodie archive (Moultaka et al. 2004, R ≈ 42 000). Details on the observations and data reduction are provided by NS11 and NP12.
The quantitative analysis was carried out following a hybrid non-LTE approach (i.e. deviations from local thermodynamic equilibrium (LTE) were accounted for) discussed by Nieva & Przybilla (2007, 2008, 2012) and Przybilla et al. (2011). In brief, line-blanketed LTE model atmospheres were computed with Atlas9 (Kurucz 1993) and non-LTE line-formation calculations were performed using updated and extended versions of Detail and Surface (Giddings 1981; Butler & Giddings 1985). In the following we abbreviate our approach by “ADS”, according to the initials of the three involved codes. State-of-the-art model atoms were adopted (see Table 3 of NP12 for details) which allowed atmospheric parameters and elemental abundances to be obtained with high accuracy and precision.
Properties of the program stars.
Spectral types, measured V magnitudes, effective temperatures Teff and surface gravities log g (in cgs units) for the sample stars together with their respective uncertainties (1σ-values) are summarised in Table 1, see Table 3 of NS11 and Tables 5 and 6 of NP12 for further data on atmospheric parameters and chemical abundances. Note that the derived surface gravities for the individual stars are practically identical to the polar gravities (which is the decisive quantity in terms of stellar evolution, Maeder & Meynet 2012). There is observational evidence that many of the objects are true slow rotators, see Sect. 4. Moreover, it is likely that among the remaining stars true fast rotators seen nearly pole-on – only therefore showing sharp lines – are absent.
The sample has passed a critical test for the quality of the quantitative analysis in terms that the derived CNO abundances follow tightly the predicted nuclear path (Przybilla et al. 2010; Maeder et al. 2014), see Fig. 14 of NP12. For a verification of the catalytic nature of the CNO cycles we also provide the sum of carbon, nitrogen and oxygen abundances in Table 1. The sample stars turn out to be homogeneous in ε( ∑CNO) on the 10%-level, similar to the general trend of chemical homogeneity established in NP12. The sample mean value is  = 8.94±0.04.
Metallicities Z were computed for the individual objects on the basis of the abundance data published by NS11 and NP12. In addition to the most abundant species discussed in these studies (C, N, O, Ne, Mg, Si, Fe), data for all other metals in the periodic system up to zinc were considered for constraining Z, adopting solar meteoritic values of Asplund et al. (2009), except for chlorine and argon, where abundances from the Orion nebula were taken (Esteban et al. 2004). Any deviations of these auxiliary data from the “true” cosmic values are likely to be absorbed by the error margins of Z due to their small contribution.
3. Fundamental parameter determination and results
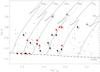 |
Fig. 1 Sample stars in the log Teff − log g-plane. Black/red dots denote CN-unmixed/mixed chemical composition and open thick circles objects near/beyond core-H exhaustion. Wide circles surrounding the dots mark magnetic stars. Error bars denote 1σ-uncertainties. Data from double-lined detached eclipsing binary stars (Torres et al. 2010) are shown for comparison (small triangles). Overplotted are evolution tracks for non-rotating stars at Z = 0.014 from Ekström et al. (2012), for initial masses as indicated, and isochrones for log τevol(yr) = 6.5, 7.0, 7.5 and 8.0 (dotted lines, left to right). The position of the ZAMS is indicated by the long-dashed line. The sample stars are marked according to the numbering scheme introduced in Table 1. |
Once the basic atmospheric parameters Teff and log g are known, evolutionary masses Mevol of stars can be determined by comparison with the loci of stellar evolution tracks in the Teff − log g plane. This is visualised for our sample stars in Fig. 1, with evolution tracks and isochrones for non-rotating stars adopted from EGE12. Our stars span a range of ~6 to 18 M⊙, covering the main-sequence band from the zero-age main sequence (ZAMS) to the terminal-age main sequence (TAMS). Among the most massive stars several objects from the youngest parts in the Orion OB1 association and τ Sco in the Upper Sco association fall on the ZAMS. Three objects close to the TAMS could either be in the last phases of core H-burning, or may have terminated core H-burning, and have started shell H-burning already. The status of these stars is in particular not clear because rotation widens the main sequence (EGE12). Note that the Mevol data in Table 1 deviate slightly from the values presented in NP12, as the latter were based on stellar evolution tracks of Meynet & Maeder (2003) for Z = 0.02. In anticipation of the discussion in Sect. 4, additional information on the status of mixing of the stellar surface with CN-processed material from the core and on the presence of surface magnetic fields is encoded in Fig. 1.
For comparison, positions of DEB components discussed by TAG10 are also displayed in Fig. 1. DEB components at this point of evolution qualify as excellent examples of slowly-rotating single stars (de Mink et al. 2011). They are spherical, have not experienced mass exchange, and rotate at velocities of typically ~100 km s-1 – in practice they are therefore slow rotators for a comparison with stellar evolution models. The periods of the massive binaries discussed by TAG10 (typically 2−10 days) may be long enough to significantly reduce the potential effects of tides on the structure and evolution of the binary components (Song et al. 2013).
A representation complementary to the log Teff − log g plane is the physical HRD, stellar luminosity vs. log Teff, see Fig. 2. The derivation of the luminosity from measured V magnitudes requires a knowledge of the distance and the extinction along the line-of-sight to each sample star. We follow the same strategy as in NP12 for the calculation of spectroscopic distances, and extend it to the additional stars from NS11. Then, bolometric corrections are adopted from Nieva (2013,. The resulting luminosities are summarised in Table 1, together with the deduced radii (from the relation between L, Teff and R). The distribution of the sample stars relative to the stellar evolution tracks is the same as in Fig. 1.
Next, we put the sample stars in context of the mass−radius and the mass−luminosity relationships as deduced from DEBs of TAG10 in Figs. 3 and 4, respectively. We want to draw the attention to the extremely small error bars for these particular DEB data – both components of a DEB have masses and radii determined to ±3%, or better. These comprise only data of highest accuracy and precision discussed within the much broader literature on DEBs. The predicted loci of the ZAMS and TAMS (non-rotating models of EGE12) are also displayed, as well as the locus where the models reach 50% core-H depletion. Our sample stars fit well into the trends, with error bars coming close to that of the DEB components, typically within a factor 2–4. The precision in luminosity even reaches similar values as that obtained for DEBs. This opens up the possibility to improve on the number statistics and in particular to trace the regions close to the ZAMS in the M–R and M–L relations for the more massive objects, which so far is not covered by DEBs.
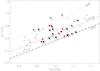 |
Fig. 3 Mass−radius relationship for the sample stars. See Fig. 1 for the symbol encoding. Abscissa values are evolutionary masses. In addition to the ZAMS, two additional loci, for 50% core-H depletion and for the TAMS, are indicated by the thick/thin-dotted lines, as predicted by the stellar evolution models of Ekström et al. (2012). Error bars are shown also for the detached eclipsing binary components. |
A further test for the consistency of the results is the comparison of evolutionary with spectroscopic masses Mspec. The latter are derived from computing the stellar luminosity based on independent distance determinations, either from (revised) Hipparcos parallaxes (van Leeuwen 2007) or from distances to associations (see Table 2 for references). This allows radii to be derived (in analogy to the procedure described above), and finally spectroscopic masses, utilising Newton’s law of gravitation. The data on Mspec is summarised in Table 1. The comparison between spectroscopic and evolutionary masses is visualised in Fig. 5. In general, there is good agreement within the 1σ error bars. Note that the uncertainties in Mspec are large. These are dominated by the uncertainties in the parallaxes or the association distances, where in the latter case also systematic effects for individual stars may occur, depending on their relative position in the radially extended associations. An apparent systematic trend – in the sense that spectroscopic masses appear to be larger than evolutionary masses for values larger than about 15 M⊙ – looses significance if two outliers are omitted. These are HD 36512 (υ Ori, #11) and HD 205021 (β Cep, #14). In the former case, the literature value of the distance to the Ori OB1c association may be overestimated (our spectroscopic distances for 3 other Ori OB 1c members tend also to be systematically smaller than the adopted association distance), while in the latter case the object is a binary (see Sect. 4), which may have biased the parallax determination.
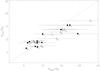 |
Fig. 5 Comparison of spectroscopic Mspec and evolutionary masses Mevol for the sample stars. Dots mark objects with measured parallaxes (van Leeuwen 2007), circles mark stars where only association distances are available (see Table 2). A few field stars have no reliable parallaxes and are therefore omitted here. Error bars denote 1σ-uncertainties and the dotted line indicates the 1:1 relation. |
Conservatively, one should view the uncertainties of the spectroscopic masses, which are typically larger by a factor of five to ten than those for evolutionary masses, as the limitation to the precision to which masses can be derived for single stars. However, there is broad agreement on evolutionary tracks for the main-sequence phase (Martins & Palacios 2013, in particular for slow- or non-rotating stars), indicating that the evolutionary masses seem largely unaffected by systematic errors, while distances are highly uncertain. We therefore argue that the small uncertainties of the evolutionary masses may therefore be nevertheless realistic, while remaining differences in the absolute values of evolutionary and spectroscopic masses are due to systematic bias in the distances2. Without doubt, parallaxes obtained with Gaia will settle the issue.
Comparison with OB association properties.
Finally, evolutionary ages τevol of the sample stars are determined by comparison with isochrones of EGE12, see Figs. 1 and 2 for a visualisation, and Table 1 for the derived data. In addition, Table 1 contains information on absolute visual  and bolometric magnitudes Mbol of the sample stars3, a statement whether the atmospheres show indications for mixing with CN-processed material, and information on the presence and strength of a magnetic field, where available.
A test for the consistency of the derived properties of the sample stars can be made for members of OB associations, which are located at similar distances and have similar ages. Distances and ages of OB associations are compared with the data derived here for member stars in Table 2. We have adopted uncertainties of 25 pc, 15 pc and 30 pc for the distances to the Ori OB1a, OB1b and OB1c associations, respectively, as Bally (2008) does not provide these data. Thus, the radial extension of these associations is assumed to be comparable to their extension across the sky.
Overall, good agreement is found in terms of distances and ages, i.e. within the 1σ-uncertainties. However, two distinctively discrepant objects are found. The first is τ Sco in the Upper Sco association, which appears much too young with an apparent age of <2 Myr compared to the association age of ~11 Myr (Pecaut et al. 2012). On the other hand, there is a very good mutual agreement between spectroscopic and Hipparcos distance (see NP12), and the association distance (see Table 2). It will be shown in the next section that these characteristics together with other indications point towards a blue straggler nature for this star. The second discrepant object is HD 35039 in Ori OB1a. The star appears too evolved (corresponding to an age discrepant by ~4σ) in comparison to other association members, despite the distance, radial velocity and proper motion is compatible. We suggest that HD 35039 belongs to the (older) field population overlapping with the Ori OB1a association. The alternative, that it has evolved to its current characteristics through a binary channel (it is a single-lined spectroscopic binary, SB1, with a period of 290 d, Eggleton & Tokovinin 2008, ET08), appears less appealing. CN-processed material should have been transferred in the process, which is not traced at the stellar surface.
4. Evolutionary status of the sample stars
The majority of the sample stars falls on the main sequence band (see Figs. 1 to 4), i.e. they are core hydrogen-burning stars. Most among them seem to have used up ~50% of their hydrogen fuel. Whether the three objects close to the TAMS (HD 35039, HD 74575 and HD 209008) are still core hydrogen-burning or have already started shell hydrogen-burning will depend on their (unknown) initial rotation rates. This is because rotation increases the core mass, extends the stellar main-sequence lifetime and therefore shifts the TAMS towards lower gravities/higher luminosities (EGE12). Figures 1 and 2 therefore indicate the lower boundary for the TAMS position, as evolution tracks for non-rotating stars are shown.
The true rotational velocities of the sample stars are primarily not known, as only the projected rotational velocities vrotsini can be determined from the available optical spectra. The sample could therefore contain faster rotators seen at low inclination i. One possibility to distinguish fast rotators seen nearly pole-on from slow rotators may come from the observed line-profile shapes in high-resolution and high-S/N spectra: fast rotators seen nearly pole-on produce flat-bottomed profiles with a trapezoidal appearance in some weak lines like prominently observed in Vega (Gulliver et al. 1994) and some Be stars (T. Rivinius, priv. comm.) – such are not present in the sample star spectra. Another possibility, motivated by evolution models for rotating stars, may come from surface N/C ratios (see Figs. 6 and 7). Noticeable effects on the main sequence are predicted to occur when OB stars evolve off the ZAMS and attain surface gravities log g in the range ~4.0 to 3.9 for ratios of initial to critical angular velocity Ω/Ωcrit ≳ 0.4. Therefore, even stars with an average vrot of ~100 to 140 km s-1 (depending on mass) on the main sequence – corresponding to vrot up to slightly larger than 200 km s-1 on the ZAMS – are expected to show a behaviour similar to that predicted by non-rotating models until the end of H core-burning within our limitations reached in accuracy and precision of abundance determinations. In order for our sample stars rotating that fast, their inclination angles would need to be i < 10° for their typical vrotsini < 30 km s-1 (NS11, NP12), which is statistically unlikely for the majority of objects.
Observationally, 2/3 of the sample stars are compatible with pristine N/C ratios (as defined by the cosmic abundance standard, NP12), including stars close to the TAMS, implying that many sample stars are objects with a genuine Ω/Ωcrit ≲ 0.4. This is in agreement with results on a sample of massive DEBs (Pavlovski & Hensberge 2005; Pavlovski & Southworth 2009, 2014; Pavlovski et al. 2009, 2011; Mayer et al. 2013; Tkachenko et al. 2014, with typical vrotsini ≲ 100 km s-1), which also show no signs of mixing with CN-cycled matter. Mixing signatures are found in the remaining 1/3 of our sample stars. About half of them are compatible with the predictions from the stellar evolution tracks accounting for rotation (EGE12; Georgy et al. 2013). Four objects appear too unevolved to explain the observed amount of mixing with CN-processed matter. They may be results of binary evolution (Wellstein et al. 2001; de Mink et al. 2011), as discussed below in the notes on individual objects. The absence of indications for binarity from fitting of their spectral energy distributions (NP12) imply either a merger or the presence of a very faint companion.
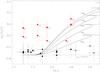 |
Fig. 6 Sample stars in the log g −log (N/C)-plane. Symbol encoding according to Fig. 1. Predictions from evolution models for rotating stars (EGE12, Z = 0.014, for an initial Ω/Ωcrit = 0.40) are indicated by full lines. The tracks are labelled by the corresponding ZAMS mass. The tracks for non-rotating stars in this mass range all coincide, as indicated. |
However, the topic is certainly more complex than apparent at first glance. For some of the stars it is feasible to determine rotation periods P from the temporal variability of polarisation measurements and/or the wind variability established from time-series UV spectra (e.g. Morel et al. 2006). Coupled with our radius determination (Table 1) this allows their true vrot and the inclination angles i to be constrained. Accordingly, 1/5th of the sample stars turn out to be genuine slow rotators, including several of those showing signatures of CN-mixing compatible with initial rotation faster than Ω/Ωcrit ≈ 0.5 (Fig. 7, stars #14, 17 and 18). The presence of magnetic fields can apparently be considered as an indicator for augmented mixing in rotating stars (see also Morel et al. 2008, but see Aerts et al. 2014 for a contrary view). Then, angular momentum losses through a magnetically confined line-driven stellar wind (ud-Doula et al. 2009) seem to be required to produce the observed slow rotation. The situation in the early B-type stars therefore appears to be similar to that of magnetic O stars with observed nitrogen enrichment (Martins et al. 2012). While a qualitative understanding of the underlying mechanisms may be available, only first steps towards a comprehensive implementation into stellar evolution models have been made yet (Meynet et al. 2011). The probably most fundamental question that needs clarification is on the origin of the magnetic fields, whether they are intrinsic or due to some form of dynamo action in the radiative envelopes of hot, massive stars.
Notes on individual objects
#1: HD 36591.
This star is a member of common proper motion system. The partner has a V magnitude of 9.8 mag and is located at a distance of 2.1′′ (ET08). It does not contribute any significant light to the observed spectrum.
#2: HD 61068 (PT Pup).
The star shows a significantly enhanced N/C-ratio. Its relatively low age may hint to some form of binary interaction being responsible for the mixing signature.
#3: HD 63922 (P Pup).
We do not see spectral lines from the secondary in this binary system in our spectrum, despite it is relatively bright, V = 7.19, and close, at 0.340′′ distance (ET08).
#4: HD 74575 (α Pyx).
Hubrig et al. (2009) reported the detection of a magnetic field for this object based on spectropolarimetry with Fors1 on the VLT, which could not be confirmed by Bagnulo et al. (2012) by reanalysis of the same observational data, and also by Shultz et al. (2012) based on spectropolarimetry at high spectral resolution. The star shows a slightly higher N/C-ratio than the baseline value, which can be explained in the framework of rotationally-induced mixing.
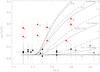 |
Fig. 7 Same as Fig. 6, but showing the effects of varying initial rotational velocity. Full and long-dashed lines mark predictions of Georgy et al. (2013) for a 9 M⊙ and a 15 M⊙ model at Z = 0.014, respectively, for initial Ω/Ωcrit varying from 0.1 to 0.9, as indicated. |
#6: HD 149438 (τ Sco).
The star is known to host a ~500 G strong magnetic field with a highly complex geometry (Donati et al. 2006). Modulation in the spectropolarimetry data and UV stellar wind line variability point to a period of 41.033±0.002 d, which was identified with the rotational period. With our radius from Table 1 a rotational velocity of vrot = 6 km s-1 is deduced, which implies an inclination i in the range ~30 to 70° for a vrotsini = 4±1 km s-1 (NP12). The observed high N/C ratio could therefore be explained in the scenario of an initially fast rotator that experienced spin-down from magnetic breaking by mass- and angular momentum-loss by a line-driven stellar wind (ud-Doula et al. 2009). This argument apparently fails in view of the low evolutionary age of τ Sco of less than 2 Myrs (from its position close to the ZAMS, see Figs. 1 or 2). However, this evolutionary age is in conflict with the age of the Upper Scorpius association (11±1±2 Myr (statistical, systematic), Pecaut et al. 2012) that τ Sco is a member of. τ Sco is located on the ZAMS beyond the main sequence turn-off from this association. The only resort from this is that τ Sco is in fact a blue straggler that has been rejuvenated either by a merger or by mass gain in a binary system. The merger scenario is in particular appealing if the scenario discussed by Ferrario et al. (2009) also works for massive main-sequence mergers (see discussion by Langer 2012), as this would explain the origin of the observed magnetic field. The current observed slow rotation would then be the result of angular-momentum loss in a magnetically confined stellar wind, despite the initial rejection of the idea (see above).
#7: HD 886 (γ Peg).
Handler et al. (2009) suggest the star to be single from a high-precision space-based photometric and ground-based spectroscopic observation campaign. This is in contrast to previous claims, as summarised by ET08, but consistent with our finding of the absence of second light from the B2 IV spectrum. The detection of a magnetic field by Butkovskaya & Plachinda (2007) appears questionable given the large errors of the individual measurements. The non-detection is confirmed by Silvester et al. (2009) and Neiner et al. (2014).
#8: HD 29248 (ν Eri).
Asteroseismic analysis of the rich pulsation spectrum of the β Cephei star ν Eri lead Pamyatnykh et al. (2004) to conclude that its equatorial rotation velocity amounts to vrot ≈ 6 km s-1. Their deduced value is in contrast to the observed vrotsini = 26±2 km s-1 (NP12). The enhanced N/C-ratio is consistent with predictions from models with rotationally induced mixing.
#10: HD 35708 (o Tau).
This star is a member of the loose Cas-Tau association. It is less evolved than the other two Cas-Tau members of our sample, HD 3360 and HD 16582, but also shows an equally high N/C-ratio. Reaching such a high N/C-ratio early in the evolution would require a dynamo mechanism to be active and the presence of differential rotation in the stellar interior, a combination for which a detailed understanding still has to be developed (Meynet et al. 2011). Alternatively, a binary scenario may be invoked to explain the mixing signature (Langer 2012; de Mink et al. 2013).
#12: HD 36822 (φ1 Ori).
The star is classified as SB1, with an orbital period of 3068 d (ET08). No details are known on the properties of the secondary, which also does not contribute any significant second light to our spectrum. The enhanced N/C-ratio is consistent with predictions from models with rotationally induced mixing.
#13: HD 36960.
This is the brightest member of a triple common proper-motion system. The other two stars, a B1 V star of V-magnitude 5.65 and a fainter companion at V = 8.84, form a tight pair separated by 36.11′′ from HD 36960. This makes the object effectively a single star for the analysis.
#14: HD 205021 (β Cep).
Henrichs et al. (2013) have recently presented the so far most comprehensive study of the primary of a triple system. The secondary is a ΔV = 3.4 mag fainter Be star, and has an orbital period of ~85 years. An angular distance of ~0.25′′ was found from speckle interferometry at the epoch of observation (Gezari et al. 1972). We see no indication of second light in the spectrum available to us, but the Be star is known to produce an emission component in Hα of the primary occasionally, with the spectrum of the secondary separated using spectro-astrometric techniques (Schnerr et al. 2006). The third body is an A2 V star at 7.8 mag, 13.6′′ away. β Cep hosts a sinusoidally varying magnetic field with an amplitude 97±4 G and an average value −6±3 G, implying a polar field strength of about 300 G. From the periodicity of the UV stellar wind line variability Henrichs et al. (2013) derived a rotational period of P = 12.00075(11) d (which is compatible with the magnetic field signal). This implies a true rotational velocity of vrot = 24±2 km s-1, using our radius value (see Table 1). This is compatible with the spectroscopically determined value vrot sini = 28±3 km s-1 (NP12), requiring that the star is seen close to equator-on. Despite this slow rotation, the star shows high N/C. It may be speculated that initially this was a faster rotator, thus explaining the mixing of the surface with CN-processed material, while magnetic breaking due to angular momentum losses by a magnetically confined line-driven stellar wind has lead to the spin-down (ud-Doula et al. 2009). Overall, there is excellent agreement of β Cep’s fundamental parameters derived by Henrichs et al. (2013) and our values, despite somewhat different atmospheric parameters. Note that the = −5.8±0.2 given by Henrichs et al. (2013) is probably a typo.
#16: HD 216916 (EN Lac).
The star belongs to a triple system. The B2 IV primary forms a close pair with the secondary of spectral type F6-7 with a 12.10 d period. The third body in the system is an 11.4 mag F0 star at 27.6′′ distance (ET08). The two other objects do not contribute light to the spectrum of the primary in a significant way, making it effectively a single star in terms of interpretation.
#17: HD 3360 (ζ Cas).
Neiner et al. (2003) find this member of the Cas-Tau association to be magnetic on the basis of spectropolarimetric observations, with an inferred polar field strength of 335 G. From the periodicity of the magnetic signal and UV stellar wind line variability they derived a rotational period of P = 5.37 d, which results in a true rotational velocity of vrot = 59±5 km s-1, employing our radius value (see Table 1). From an observed projected rotational velocity of vrotsini = 20±2 km s-1 (NP12) follows i ≈ 20°. The star shows one of the highest N/C ratios in our sample, despite being a slow rotator. It may be speculated that initially this was a faster rotator, thus explaining the mixing of the surface with CN-processed material, while magnetic breaking due to angular momentum losses by a magnetically confined line-driven stellar wind has lead to the current low rotation rate over its ~25 Myr lifetime (which is within a factor ~2.5 of the prediction by ud-Doula et al. 2009). With such an age ζ Cas is close to the TAMS. There is excellent agreement between all stellar parameters presented here and those derived by Neiner et al. (2003).
#18: HD 16582 (δ Cet).
The star resembles closely HD 3360 in almost all aspects (see Table 1), including its membership to the Cas-Tau association. It is a true slow rotator with vrot = 14 or 28 km s-1, as suggested by asteroseismic analysis (Aerts et al. 2006). From the observed vrotsini = 15±2 km s-1 (NP12) we can reject the second solution of Aerts et al. (2006) and conclude that the star is seen equator-on, with a rotational period of about 22 d (employing R from Table 1). Hubrig et al. (2009) reported the detection of a magnetic field for this object based on spectropolarimetric observations with Fors1 on the VLT, which could not be confirmed by Bagnulo et al. (2012) by reanalysis of the same observational data, and also by Silvester et al. (2009) based on spectropolarimetry at high spectral resolution. The origin of the mixing of the surface with CN-cycled material is compatible with evolution models accounting for the effects of rotation. However, an initial Ω/Ωcrit of the order 0.7 is required (see Fig. 7), and therefore leaves open the question how the star has lost practically its entire angular momentum. One may speculate about a magnetic field generated by a dynamo and magnetic braking, which suppressed the dynamo successively. Alternatively, a binary scenario may be invoked to explain the mixing signature (Langer 2012; de Mink et al. 2013).
#20: HD 160762 (ι Her).
The B3 IV star is the primary in a binary, with a companion of unknown spectral type. The orbital period is 113.8 d (ET08). We see no indication of lines produced by the secondary in the spectrum available to us.
#21: HD 37020 (θ1 Ori A).
This star of the Orion Trapezium is an eclipsing binary (for a discussion see Strickland & Lloyd 2000), consisting of the B0.5 V primary and a low-luminosity companion (contributing no significant second light to our spectrum), a probably late-type pre-main sequence star. The eclipses imply i ≈ 90°, therefore vrot = 45±3 km s-1, adopting vsini from NS11. No indication of mixing with CN-cycled products is found for this slow rotator on the ZAMS.
#22: HD 37042 (θ2 Ori B).
A rv-variable (Morrell & Levato 1991). We find no indication of second light in our spectrum. Only a binary merger seems to be able to produce such a high N/C-ratio that near the ZAMS (see the discussion on τ Sco above). The merger should be a fast-spinning object initially, requiring HD 37042 to be seen nearly pole-on to produce the observed vrotsini = 30 km s-1 (NP12).
#23: HD 36959.
A potential rv-variable (Morrell & Levato 1991). We find no indication of second light in our spectrum.
#26: HD 35039 (o Ori).
Periodic rv-variations and the non-detection of spectral signatures from a second object lead to a classification as a single-lined spectroscopic binary (SB1). The secondary is of unknown spectral type, and the system has a period of 290 days (ET08). Based on its location in the HRD, the star is near the TAMS and may even have terminated core-hydrogen burning already.
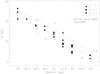 |
Fig. 8 Masses of the sample stars (full symbols) as a function of spectral type. Encoding of the luminosity class according to the legend, open triangles denote data derived from detached eclipsing binary stars (Torres et al. 2010). Error bars denote 1σ-uncertainties. The functional relationship for dwarfs (luminosity class V) as advocated in the astrophysical reference literature – Landolt-Börnstein (Schmidt-Kaler 1982), Allen’s Astrophysical Quantities (Cox 2000) – is also indicated. |
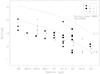 |
Fig. 10 Absolute visual magnitudes of the sample stars as a function of spectral type, see Fig. 8 for further explanation. The functional relationship for giants (luminosity class III) from the reference literature is also indicated. |
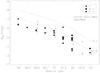 |
Fig. 11 Absolute bolometric magnitudes of the sample stars as a function of spectral type, see Fig. 8 for further explanation. The functional relationship for giants (luminosity class III) from the reference literature is also indicated. |
5. Functional relationships
The good agreement of our and the binary data in terms of the M-R and M-L relationships motivates us to perform further comparisons. The aim of this section is to verify data from the astrophysical reference literature, from the Landolt-Börnstein (Schmidt-Kaler 1982) which also provides the basis for the values presented in Allen’s Astrophysical Quantities (Cox 2000).
Masses of the sample stars as a function of spectral type and luminosity class are discussed in Fig. 8. As expected, there is an overall good match between our and the DEB data. Within a spectral class, giants appear to have higher masses than subgiants by tendency, which in turn appear to have higher masses than dwarfs, though the number statistics for the more evolved objects is arguably small. On the other hand, the reference literature relation is clearly off, indicating masses systematically higher by ~10−20%.
A similar picture is found for radii as a function of spectral type (Fig. 9): our and the DEB data agree, and fall systematically below the reference relation by ~25% for luminosity class V. As expected, radii become larger from dwarfs to giants. Note that in terms of observational quantities, g ∝ M/R2. Consequently, our data implies an average log g ≈ 4.15−4.20 for luminosity class V, while the Schmidt-Kaler (1982) relation indicates log g ≈3.95, more appropriate for luminosity class IV in our analysis.
A direct consequence of our smaller masses and radii and therefore higher gravities is that the stars are more compact and significantly fainter than assumed in the reference literature. The difference in absolute visual and bolometric magnitude is ~0.5 mag, see Figs. 10 and 11, respectively. Again, this is in agreement with the DEB data. Note that a discussion of the Teff-spectral-type relation is omitted here as this has been investigated in detail by Nieva (2013).
The reasons for the discrepancies between the relations implied by our data and the modern DEB data on one hand, and the data from the reference literature on the other hand appear to have a historical background. Regarding masses and radii, it is clear from the critical evaluation of the most reliable data from binary stars by Popper (1980, including his own huge efforts), and subsequent critical compilations by Habets & Heintze (1981) and Underhill & Doazan (1982), how uncertain and scarce reliable data for OB stars were at the time of the compilation of the Landolt-Börnstein input (Schmidt-Kaler 1982). The situation was improving only by observations made with the first electronic detectors. This is clear from the compilations of Harmanec (1988) and later of Andersen (1991). These tabulations of masses and radii are already in rather good agreement with the present data.
In the case of absolute visual and bolometric magnitudes additional reasons stem from systematics in the distance scale to star clusters and associations, and to differences in bolometric correction scales. The high frequency of multiples among massive OB-stars has been uncovered only recently, reaching 50–70% (Chini et al. 2012; Sana et al. 2012). As a consequence, higher luminosities for OB stars may have resulted on average in the past because of a contribution from binaries mistaken for single stars.
We conclude that the general astrophysics reference literature on OB-type stars needs to be updated with regard to masses, radii and luminosities as a function of spectral type. As the differences of modern results and established data from the reference literature will extend beyond the early B-type stars investigated here, a more comprehensive study than the present one is clearly required. However, we refrain here from providing reference values from our sample as a first step in that direction because many spectral type/luminosity class combinations are covered only by one or no observed data point, in particular for subgiants and giants. It is therefore not feasible to give average values or ranges in a meaningful way. We postpone this to the near future, when larger samples of accurate and precise parameters of OB stars will become available. For the moment Table 1 allows all relevant data in this context to be extracted.
6. Concluding remarks
We have shown that on the basis of a careful non-LTE analysis of high-quality spectra, coupled to state-of-the-art stellar evolution models, accurate and precise fundamental parameters of single core hydrogen-burning early B-type stars can be determined. Evolutionary masses, radii, and luminosities can thus be constrained to better than typically 5%, 10%, and 20% uncertainty, respectively, coming to within a factor 2–3 of data derived from the best indicators, detached eclipsing binaries (Torres et al. 2010). Spectroscopic masses show uncertainties by a factor 5 to 10 higher, which is only because of the highly uncertain distances. There is good agreement of evolutionary tracks from different modelling approaches for slowly-/non-rotating massive stars on the main sequence (Martins & Palacios 2013), such that the low uncertainties of evolutionary masses appear realistic.
Good quantitative agreement of the single star and DEB properties is found, while differences to accepted values from the reference literature (Schmidt-Kaler 1982; Cox 2000) are noted. An extension of the present work is clearly required to update the reference values over a larger spectral range. Objects that are influenced by second light in the photometric and spectral data need carefully to be rejected (except for DEBs). The determination of the fundamental parameters of the bona-fide single stars can then benefit from the progress made in stellar atmosphere modelling over the past three decades, as shown here.
The vast majority of our sample early B-type stars from the solar neighbourhood appear to be genuine slow rotators. Their observational properties are overall in agreement with the recent Geneva stellar evolution models by Ekström et al. (2012) and Georgy et al. (2013). A few stars are found that seem incompatible with predicted characteristics. One group is that of somewhat evolved genuine slow rotators that show signatures of mixing of CN-processed matter. These may be explained by magnetically augmented mixing in an initially faster rotator that was spun-down by angular momentum losses through a magnetically confined stellar wind (Meynet et al. 2011). Another group are apparently young but already significantly nitrogen-enriched stars that may stem from a binary interaction scenario (de Mink et al. 2011). In particular, τ Sco turns out to be a blue straggler, rejuvenated possibly via a merger, which may also explain the origin of its magnetic field according to the mechanism suggested by Ferrario et al. (2009).
The differences between the abundance mix adopted by EGE12, i.e. the revised solar values by Asplund et al. (2009), and the one found for the nearby early B-stars by NP12 are irrelevant in this context.
We want to remind the reader of the ongoing and unsolved discussion about systematics affecting Hipparcos- and ground-based distance determinations for stars as close as those in the Pleiades open cluster (e.g. van Leeuwen 2009). Our sample objects, with a possible exception of γ Peg, are much more distant.
Note that in the few cases where no information is available on the uncertainty of the V-magnitude (see Table 1), it has been set to zero in the error propagation for computing the uncertainty of . The contribution of ΔV is negligible compared to the contribution of the uncertainty in distance.
Acknowledgments
The authors would like to thank the staff of OAC & IATE at Universidad Nacional de Córdoba for their hospitality during their stay where part of the present work was accomplished. We also thank S. Kimeswenger for stimulating discussion and the anonymous referee for valuable comments. MFN acknowledges financial support by the equal opportunities program FFL of the University of Erlangen-Nuremberg.
References
- Aerts, C., Marchenko, S. V., Matthews, J. M., et al. 2006, ApJ, 642, 470 [NASA ADS] [CrossRef] [Google Scholar]
- Aerts, C., Molenberghs, G., Kenward, M. G., & Neiner, C. 2014, ApJ, 781, 88 [NASA ADS] [CrossRef] [Google Scholar]
- Andersen, J. 1991, A&ARv, 3, 91 [NASA ADS] [CrossRef] [Google Scholar]
- Asplund, M., Grevesse, N., Sauval, A. J., & Scott, P. 2009, ARA&A, 47, 481 [NASA ADS] [CrossRef] [Google Scholar]
- Bagnulo, S., Landstreet, J. D., Mason, E., et al. 2006, A&A, 450, 777 [NASA ADS] [CrossRef] [EDP Sciences] [Google Scholar]
- Bagnulo, S., Landstreet, J. D., Fossati, L., & Kochukhov, O. 2012, A&A, 538, A129 [NASA ADS] [CrossRef] [EDP Sciences] [Google Scholar]
- Bally, J. 2008, in Handbook of Star Forming Regions, Volume I: The Northern Sky, ed. B. Reipurth, (ASP Monograph Publication), 459 [Google Scholar]
- Blaauw, A. 1958, AJ, 63, 186 [NASA ADS] [CrossRef] [Google Scholar]
- Blaauw, A. 1991, in The Physics of Star Formation and Early Stellar Evolution, eds. C. J. Lada, & N. D. Kylafis (Dordrecht: Kluwer), 125 [Google Scholar]
- Bresolin, F., Crowther, P. A., & Puls, J. 2008, Massive Stars as Cosmic Engines, Proc. IAU Symp., 250 [Google Scholar]
- Brott, I., de Mink, S. E., Cantiello, M., et al. 2011, A&A, 530, A115 [NASA ADS] [CrossRef] [EDP Sciences] [Google Scholar]
- Butkovskaya, V. V., & Plachinda, S. I. 2007, A&A, 469, 1069 [NASA ADS] [CrossRef] [EDP Sciences] [Google Scholar]
- Butler, K., & Giddings, J. R. 1985, in Newsletter of Analysis of Astronomical Spectra, No. 9 (Univ. London) [Google Scholar]
- Chieffi, A., & Limongi, M. 2013, ApJ, 764, 21 [NASA ADS] [CrossRef] [Google Scholar]
- Chini, R., Hoffmeister, V. H., Nasseri, A., Stahl, O., & Zinnecker, H. 2012, MNRAS, 424, 1925 [NASA ADS] [CrossRef] [Google Scholar]
- Cox, A. N. 2000, Allen’s astrophysical quantities (New York: Springer-Verlag) [Google Scholar]
- de Mink, S. E., Langer, N., & Izzard, R. G. 2011, Bull. Soc. Roy. Sci. Liège, 80, 543 [Google Scholar]
- de Mink, S. E., Langer, N., Izzard, R. G., et al. 2013, ApJ, 764, 166 [NASA ADS] [CrossRef] [Google Scholar]
- Donati, J.-F., Howarth, I. D., Jardine, M. M., et al. 2006, MNRAS, 370, 629 [NASA ADS] [CrossRef] [Google Scholar]
- Eggleton, P. P., & Tokovinin, A. A. 2008, MNRAS, 389, 869 (ET08) [NASA ADS] [CrossRef] [Google Scholar]
- Ekström, S., Meynet, G., Maeder, A., & Barblan, F. 2008, A&A, 478, 467 [NASA ADS] [CrossRef] [EDP Sciences] [Google Scholar]
- Ekström, S., Georgy, C., Eggenberger, P., et al. 2012, A&A, 537, A146 (EGE12) [NASA ADS] [CrossRef] [EDP Sciences] [Google Scholar]
- Esteban, C., Peimbert, M., García-Rojas, J., et al. 2004, MNRAS, 355, 229 [NASA ADS] [CrossRef] [Google Scholar]
- Ferrario, L., Pringle, J. E., Tout, C. A., & Wickramasinghe, D. T. 2009, MNRAS, 400, L71 [NASA ADS] [CrossRef] [Google Scholar]
- Georgy, C., Ekström, S., Granada, A., et al. 2013, A&A, 553, A24 [NASA ADS] [CrossRef] [EDP Sciences] [Google Scholar]
- Gezari, D. Y., Labeyrie, A., & Stachnik, R. V. 1972, ApJ, 173, L1 [NASA ADS] [CrossRef] [Google Scholar]
- Giddings, J. R. 1981, Ph.D. Thesis, University of London [Google Scholar]
- Gies, D. R., & Lambert, D. L. 1992, ApJ, 387, 673 [NASA ADS] [CrossRef] [Google Scholar]
- Gulliver, A. F., Hill, G., & Adelman, S. J. 1994, ApJ, 429, L81 [NASA ADS] [CrossRef] [Google Scholar]
- Habets, G. M. H. J., & Heintze, J. R. W. 1981, A&AS, 46, 193 [NASA ADS] [Google Scholar]
- Handler, G., Matthews, J. M., Eaton, J. A., et al. 2009, ApJ, 698, L56 [NASA ADS] [CrossRef] [Google Scholar]
- Harmanec, P. 1988, Bull. Astron. Inst. Czechoslovakia, 39, 329 [Google Scholar]
- Heger, A., & Langer, N. 2000, ApJ, 544, 1016 [NASA ADS] [CrossRef] [Google Scholar]
- Heger, A., Woosley, S. E., & Spruit, H. C. 2005, ApJ, 626, 350 [NASA ADS] [CrossRef] [Google Scholar]
- Henrichs, H. F., de Jong, J. A., Verdugo, E., et al. 2013, A&A, 555, A46 [NASA ADS] [CrossRef] [EDP Sciences] [Google Scholar]
- Hirschi, R., Meynet, G., & Maeder, A. 2004, A&A, 425, 649 [NASA ADS] [CrossRef] [EDP Sciences] [Google Scholar]
- Hohle, M. M., Neuhäuser, R., & Schutz, B. F. 2010, Astron. Nachr., 331, 349 [NASA ADS] [CrossRef] [Google Scholar]
- Hubrig, S., Briquet, M., De Cat, P., et al. 2009, Astron. Nachr., 330, 317 [NASA ADS] [CrossRef] [Google Scholar]
- Kilian, J. 1992, A&A, 262, 171 [Google Scholar]
- Kurucz, R. L. 1993, CD-ROM No. 13 (SAO, Cambridge, Mass.) [Google Scholar]
- Langer, N. 2012, ARA&A, 50, 107 [NASA ADS] [CrossRef] [Google Scholar]
- Lyubimkov, L. S., Rachkovskaya, T. M., Rostopchin, S. I., & Lambert, D. L. 2002, MNRAS, 333, 9 [NASA ADS] [CrossRef] [Google Scholar]
- Maeder, A., & Conti, P. S. 1994, ARA&A, 32, 227 [NASA ADS] [CrossRef] [Google Scholar]
- Maeder, A., & Meynet, G. 2005, A&A, 440, 1041 [NASA ADS] [CrossRef] [EDP Sciences] [Google Scholar]
- Maeder, A., & Meynet, G. 2012, Rev. Mod. Phys., 84, 25 [NASA ADS] [CrossRef] [Google Scholar]
- Maeder, A., Przybilla, N., Nieva, M. F., et al. 2014, A&A, 565, A39 [NASA ADS] [CrossRef] [EDP Sciences] [Google Scholar]
- Martins, F., & Palacios, A. 2013, A&A, 560, A16 [NASA ADS] [CrossRef] [EDP Sciences] [Google Scholar]
- Martins, F., Escolano, C., Wade, G. A., et al. 2012, A&A, 538, A29 [NASA ADS] [CrossRef] [EDP Sciences] [Google Scholar]
- Mayer, P., Harmanec, P., & Pavlovski, K. 2013, A&A, 550, A2 [NASA ADS] [CrossRef] [EDP Sciences] [Google Scholar]
- Menten, K. M., Reid, M. J., Forbrich, J., & Brunthaler, A. 2007, A&A, 474, 515 [NASA ADS] [CrossRef] [EDP Sciences] [Google Scholar]
- Meynet, G., & Maeder, A. 2000, A&A, 361, 101 [NASA ADS] [Google Scholar]
- Meynet, G., & Maeder, A. 2003, A&A, 411, 543 [NASA ADS] [CrossRef] [EDP Sciences] [Google Scholar]
- Meynet, G., & Maeder, A. 2005, A&A, 429, 581 [Google Scholar]
- Meynet, G., Eggenberger, P., & Maeder, A. 2011, A&A, 525, L11 [NASA ADS] [CrossRef] [EDP Sciences] [Google Scholar]
- Morel, T., Butler, K., Aerts, C., et al. 2006, A&A, 457, 651 [NASA ADS] [CrossRef] [EDP Sciences] [Google Scholar]
- Morel, T., Hubrig, S., & Briquet, M. 2008, A&A, 481, 453 [NASA ADS] [CrossRef] [EDP Sciences] [Google Scholar]
- Morrell, N., & Levato, H. 1991, ApJS, 75, 965 [NASA ADS] [CrossRef] [Google Scholar]
- Moultaka, J., Ilovaisky, S. A., Prugniel, P., & Soubiran, C. 2004, PASP, 116, 693 [NASA ADS] [CrossRef] [Google Scholar]
- Neiner, C., Geers, V. C., Henrichs, H. F., et al. 2003, A&A, 406, 1019 [NASA ADS] [CrossRef] [EDP Sciences] [Google Scholar]
- Neiner, C., Monin, D., Leroy, B., Mathis, S., & Bohlender, D. 2014, A&A, 562, A59 [NASA ADS] [CrossRef] [EDP Sciences] [Google Scholar]
- Nieva, M. F. 2013, A&A, 550, A26 [NASA ADS] [CrossRef] [EDP Sciences] [Google Scholar]
- Nieva, M. F., & Przybilla, N. 2006, ApJ, 639, L39 [NASA ADS] [CrossRef] [Google Scholar]
- Nieva, M. F., & Przybilla, N. 2007, A&A, 467, 295 [NASA ADS] [CrossRef] [EDP Sciences] [Google Scholar]
- Nieva, M. F., & Przybilla, N. 2008, A&A, 481, 199 [NASA ADS] [CrossRef] [EDP Sciences] [Google Scholar]
- Nieva, M. F., & Przybilla, N. 2012, A&A, 539, A143 (NP12) [NASA ADS] [CrossRef] [EDP Sciences] [Google Scholar]
- Nieva, M. F., & Simón-Díaz, S. 2011, A&A, 532, A2 (NS11) [NASA ADS] [CrossRef] [EDP Sciences] [Google Scholar]
- Pamyatnykh, A. A., Handler, G., & Dziembowski, W. A. 2004, MNRAS, 350, 1022 [NASA ADS] [CrossRef] [Google Scholar]
- Pavlovski, K., & Hensberge, H. 2005, A&A, 439, 309 [NASA ADS] [CrossRef] [EDP Sciences] [Google Scholar]
- Pavlovski, K., & Southworth, J. 2009, MNRAS, 394, 1519 [NASA ADS] [CrossRef] [Google Scholar]
- Pavlovski, K., & Southworth, J. 2014, EAS Publ. Ser., 64, 29 [Google Scholar]
- Pavlovski, K., Tamajo, E., Koubský, P., et al. 2009, MNRAS, 400, 791 [NASA ADS] [CrossRef] [Google Scholar]
- Pavlovski, K., Southworth, J., Tamajo, E., & Kolbas, V. 2011, Bull. Soc. Roy. Sci. Liège, 80, 714 [NASA ADS] [Google Scholar]
- Pecaut, M. J., Mamajek, E. E., & Bubar, E. J. 2012, ApJ, 746, 154 [NASA ADS] [CrossRef] [Google Scholar]
- Popper, D. M. 1980, ARA&A, 18, 115 [NASA ADS] [CrossRef] [Google Scholar]
- Przybilla, N., Nieva, M. F., & Butler, K. 2008, ApJ, 688, L103 [NASA ADS] [CrossRef] [Google Scholar]
- Przybilla, N., Firnstein, M., Nieva, M. F., Meynet, G., & Maeder, A. 2010, A&A, 517, A38 [NASA ADS] [CrossRef] [EDP Sciences] [Google Scholar]
- Przybilla, N., Nieva, M. F., & Butler, K. 2011, J. Phys.: Conf. Ser., 328, 2015 [Google Scholar]
- Sana, H., de Mink, S. E., de Koter, A., et al. 2012, Science, 337, 444 [Google Scholar]
- Schmidt-Kaler, T. 1982, in Landolt-Börnstein, 2, Subvol. b (Berlin: Springer-Verlag) [Google Scholar]
- Schnerr, R. S., Henrichs, H. F., Oudmaijer, R. D., & Telting, J. H. 2006, A&A, 459, L21 [NASA ADS] [CrossRef] [EDP Sciences] [Google Scholar]
- Schnerr, R. S., Henrichs, H. F., Neiner, C., et al. 2008, A&A, 483, 857 [NASA ADS] [CrossRef] [EDP Sciences] [Google Scholar]
- Shultz, M., Wade, G. A., Grunhut, J., et al. 2012, ApJ, 750, 2 [NASA ADS] [CrossRef] [Google Scholar]
- Silvester, J., Neiner, C., Henrichs, H. F., et al. 2009, MNRAS, 398, 1505 [NASA ADS] [CrossRef] [Google Scholar]
- Song, H. F., Maeder, A., Meynet, G., et al. 2013., A&A, 556, A100 [NASA ADS] [CrossRef] [EDP Sciences] [Google Scholar]
- Strickland, D. J., & Lloyd, C. 2000, Observatory, 120, 141 [NASA ADS] [Google Scholar]
- Tkachenko, A., Degroote, P., Aerts, C., et al. 2014, MNRAS, 438, 3093 [NASA ADS] [CrossRef] [Google Scholar]
- Torres, G., Andersen, J., & Giménez, A. 2010, A&ARv, 18, 67 (TAG10) [Google Scholar]
- Ud-Doula, A., Owocki, S. P., & Townsend, R. H. D. 2009, MNRAS, 392, 1022 [NASA ADS] [CrossRef] [Google Scholar]
- Underhill, A., & Doazan, V. 1982, B Stars with and without emission lines, NASA-SP–456 (NASA, Washington, D.C.) [Google Scholar]
- van Leeuwen, F. 2007, Hipparcos, the New Reduction of the Raw Data (Berlin: Springer-Verlag) [Google Scholar]
- van Leeuwen, F. 2009, A&A, 497, 209 [NASA ADS] [CrossRef] [EDP Sciences] [Google Scholar]
- Vink, J. S., de Koter, A., & Lamers, H. J. G. L. M. 2001, A&A, 369, 574 [NASA ADS] [CrossRef] [EDP Sciences] [Google Scholar]
- Vanbeveren, D., De Loore, C., & Van Rensbergen, W. 1998, A&ARv, 9, 63 [NASA ADS] [CrossRef] [Google Scholar]
- Wellstein, S., Langer, N., & Braun, H. 2001, A&A, 369, 939 [NASA ADS] [CrossRef] [EDP Sciences] [Google Scholar]
- Wolff, S. C. 1990, AJ, 100, 1994 [NASA ADS] [CrossRef] [Google Scholar]
- Woosley, S. E., & Heger, A. 2012, ApJ, 752, 32 [NASA ADS] [CrossRef] [Google Scholar]
- de Zeeuw, P. T., Hoogerwerf, R., de Bruijne, J. H. J., Brown, A. G. A., & Blaauw, A. 1999, AJ, 117, 354 [NASA ADS] [CrossRef] [Google Scholar]
All Tables
All Figures
|
Fig. 1 Sample stars in the log Teff − log g-plane. Black/red dots denote CN-unmixed/mixed chemical composition and open thick circles objects near/beyond core-H exhaustion. Wide circles surrounding the dots mark magnetic stars. Error bars denote 1σ-uncertainties. Data from double-lined detached eclipsing binary stars (Torres et al. 2010) are shown for comparison (small triangles). Overplotted are evolution tracks for non-rotating stars at Z = 0.014 from Ekström et al. (2012), for initial masses as indicated, and isochrones for log τevol(yr) = 6.5, 7.0, 7.5 and 8.0 (dotted lines, left to right). The position of the ZAMS is indicated by the long-dashed line. The sample stars are marked according to the numbering scheme introduced in Table 1. |
| In the text | |
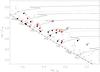 |
Fig. 2 Sample stars in the log Teff − log L-plane. The symbol encoding is the same as in Fig. 1. |
| In the text | |
|
Fig. 3 Mass−radius relationship for the sample stars. See Fig. 1 for the symbol encoding. Abscissa values are evolutionary masses. In addition to the ZAMS, two additional loci, for 50% core-H depletion and for the TAMS, are indicated by the thick/thin-dotted lines, as predicted by the stellar evolution models of Ekström et al. (2012). Error bars are shown also for the detached eclipsing binary components. |
| In the text | |
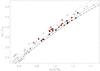 |
Fig. 4 Mass−luminosity relationship for the sample stars. See Figs. 1 and 3 for the symbol encoding. |
| In the text | |
|
Fig. 5 Comparison of spectroscopic Mspec and evolutionary masses Mevol for the sample stars. Dots mark objects with measured parallaxes (van Leeuwen 2007), circles mark stars where only association distances are available (see Table 2). A few field stars have no reliable parallaxes and are therefore omitted here. Error bars denote 1σ-uncertainties and the dotted line indicates the 1:1 relation. |
| In the text | |
|
Fig. 6 Sample stars in the log g −log (N/C)-plane. Symbol encoding according to Fig. 1. Predictions from evolution models for rotating stars (EGE12, Z = 0.014, for an initial Ω/Ωcrit = 0.40) are indicated by full lines. The tracks are labelled by the corresponding ZAMS mass. The tracks for non-rotating stars in this mass range all coincide, as indicated. |
| In the text | |
|
Fig. 7 Same as Fig. 6, but showing the effects of varying initial rotational velocity. Full and long-dashed lines mark predictions of Georgy et al. (2013) for a 9 M⊙ and a 15 M⊙ model at Z = 0.014, respectively, for initial Ω/Ωcrit varying from 0.1 to 0.9, as indicated. |
| In the text | |
|
Fig. 8 Masses of the sample stars (full symbols) as a function of spectral type. Encoding of the luminosity class according to the legend, open triangles denote data derived from detached eclipsing binary stars (Torres et al. 2010). Error bars denote 1σ-uncertainties. The functional relationship for dwarfs (luminosity class V) as advocated in the astrophysical reference literature – Landolt-Börnstein (Schmidt-Kaler 1982), Allen’s Astrophysical Quantities (Cox 2000) – is also indicated. |
| In the text | |
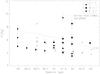 |
Fig. 9 Radii of the sample stars as a function of spectral type, see Fig. 8 for further explanation. |
| In the text | |
|
Fig. 10 Absolute visual magnitudes of the sample stars as a function of spectral type, see Fig. 8 for further explanation. The functional relationship for giants (luminosity class III) from the reference literature is also indicated. |
| In the text | |
|
Fig. 11 Absolute bolometric magnitudes of the sample stars as a function of spectral type, see Fig. 8 for further explanation. The functional relationship for giants (luminosity class III) from the reference literature is also indicated. |
| In the text | |
Current usage metrics show cumulative count of Article Views (full-text article views including HTML views, PDF and ePub downloads, according to the available data) and Abstracts Views on Vision4Press platform.
Data correspond to usage on the plateform after 2015. The current usage metrics is available 48-96 hours after online publication and is updated daily on week days.
Initial download of the metrics may take a while.