Fig. 3
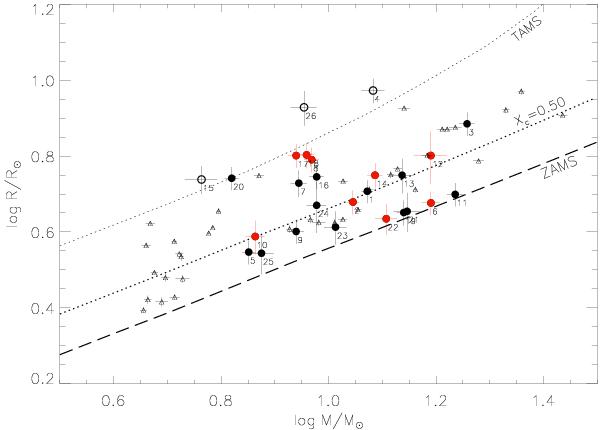
Mass−radius relationship for the sample stars. See Fig. 1 for the symbol encoding. Abscissa values are evolutionary masses. In addition to the ZAMS, two additional loci, for 50% core-H depletion and for the TAMS, are indicated by the thick/thin-dotted lines, as predicted by the stellar evolution models of Ekström et al. (2012). Error bars are shown also for the detached eclipsing binary components.
Current usage metrics show cumulative count of Article Views (full-text article views including HTML views, PDF and ePub downloads, according to the available data) and Abstracts Views on Vision4Press platform.
Data correspond to usage on the plateform after 2015. The current usage metrics is available 48-96 hours after online publication and is updated daily on week days.
Initial download of the metrics may take a while.