Fig. 6
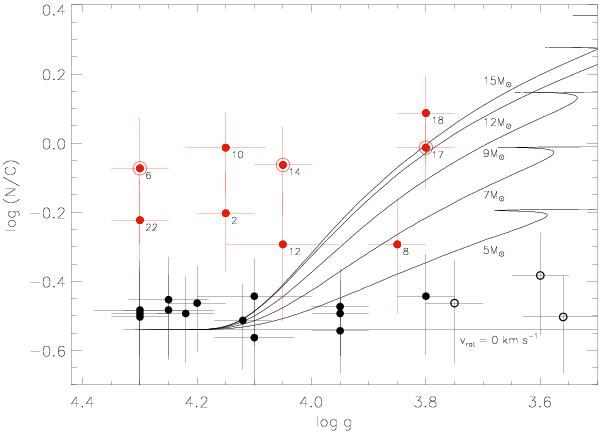
Sample stars in the log g −log (N/C)-plane. Symbol encoding according to Fig. 1. Predictions from evolution models for rotating stars (EGE12, Z = 0.014, for an initial Ω/Ωcrit = 0.40) are indicated by full lines. The tracks are labelled by the corresponding ZAMS mass. The tracks for non-rotating stars in this mass range all coincide, as indicated.
Current usage metrics show cumulative count of Article Views (full-text article views including HTML views, PDF and ePub downloads, according to the available data) and Abstracts Views on Vision4Press platform.
Data correspond to usage on the plateform after 2015. The current usage metrics is available 48-96 hours after online publication and is updated daily on week days.
Initial download of the metrics may take a while.