Fig. 5
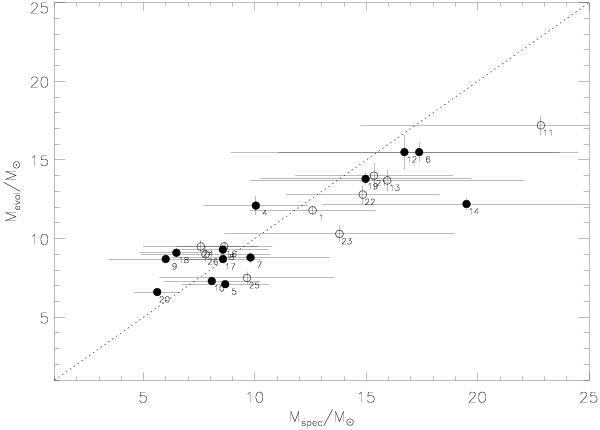
Comparison of spectroscopic Mspec and evolutionary masses Mevol for the sample stars. Dots mark objects with measured parallaxes (van Leeuwen 2007), circles mark stars where only association distances are available (see Table 2). A few field stars have no reliable parallaxes and are therefore omitted here. Error bars denote 1σ-uncertainties and the dotted line indicates the 1:1 relation.
Current usage metrics show cumulative count of Article Views (full-text article views including HTML views, PDF and ePub downloads, according to the available data) and Abstracts Views on Vision4Press platform.
Data correspond to usage on the plateform after 2015. The current usage metrics is available 48-96 hours after online publication and is updated daily on week days.
Initial download of the metrics may take a while.